NFLX

NFLX bullish on Mondays pullbackTalked about this possible scenario on NFLX. Look to get bullish for the next week or two after an early week pullback to 282; probably hits into 278 area the Wed and Thurs highs from last week. Gonna snag the 287.5/290 Bull call vertical spread.

NFLX to reach 180 by the end of SeptemberNetflix (NFLX) has been forming an ascending broadening triangle since May and fully established a support level between 162.71 and 169.70 from the middle of May to the middle of July. Then the price reached a resistance level of about 250 in the middle of August.
In my opinion, NFLX is nearing the end of a 2+ week consolidation period and has formed a bearish head & shoulders pattern. In addition, the new descending trend line and 3 bearish key reversals suggest that the price will move lower approaching the support level of 174 by September 30, give or take a few days.
See my recent analysis of GOOGL to see how I marked support and resistance levels and observed key reversals to make a very accurate prediction (or maybe I was lucky).
Disclaimer: I am not a financial advisor, and the above statements are not investment advice. My comments are only intended for educational purposes. You are solely responsible for your own trading decisions.

Some stock to consider buying I think stocks will go up next week
I consider to buy these stocks not for long term just scalping
NFLX , U , TSLA , DSNY , and AMD
I think they well be a good play
Tell me do you trade stocks & what to do you like for scalping
Have a good day
GOOD LUCK

NETFLIX - personal opinion Hello everyone,🙋🏾
🗣Here again Rom with a personal opinion,
All traders have experienced the frustration of being “the last one to the party.” Missing the run.
And I think an opportunity has been created here, quietly and slowly.
I don't think it's necessary to introduce Netflix,
The big streaming company. NASDAQ:NFLX
Company data ✅
Market Cap 108.28B💰
P/E 22.54
Income 4.84B
Sales 31.03B
JP Morgan Target Price $240 → $330💥
Deutsche Bank Target Price $270 → $350💥
🎉Netflix has stopped losing customers, after struggling to hold on to them in the face of competition and pressures from the rising cost of living.
The streaming giant said it added 2.4 million households to its subscriber base over the July to September period.
That reversed the losses it suffered in the first half of the year after raising its prices in key markets.
Hits such as Stranger Things and Monster: The Jeffrey Dahmer Story helped draw viewers back to the site.
"After a challenging first half, we believe we're on a path to reaccelerate growth," the company said in a letter to investors on Tuesday.
The company said it expected to continue to add subscribers in the coming months. It is also rolling out several changes intended to restore its fortunes, including launching a less expensive option with adverts next month.
Those who want to be exposed to the stock indirectly can do so through the following ETF:🎲
Ticker_____Fund Name _________________ # OF SHARES
QQQ _____Invesco QQQ Trust_________________ 6.46M
SPY ____ SPDR S&P 500 ETF Trust____________4.83M
IVV _____iShares Core S&P 500 ETF ______ ____3.96M
VOO____ Vanguard S&P 500 ETF______________3.49M
VTI_____ Vanguard Total Stock Market ETF____ 2.96M
More content, follow me, express your opinion, and share me.💃🏿
⚠️__🚧___🚧___🚧__🚧___🚧__🚧_🚧__🚧__🚧__🚧__🚧_🚧__🚧__🚧_🚧__🚧_⚠️
There is no recommendation for buying or selling or any action in the stock, I am not an investment advisor and publish this article as a hobby only.
Everyone has to perform risk management on their own or contact an investment advisor with a license, I don't have one.
Investing in the stock market involves risking your money!⛔️
have fun💃🏿

Netflix destroyed slowly until someone buy the companyNetflix destroyed slowly until someone buy the company And stop supporting gays.
It’s now in second wave that targeted 36$ after that we will see big pump in it.
This analysis for long-term.

Entry Points in NFLX Ahead of EarningsPlatforms ahead of earnings is an important pattern to watch for. Platform-building markets develop on the dominance of institutional investors buying quietly with controlled orders via the Dark Pools.
NFLX has a classic "quiet accumulation" pattern, also known as a Dark Pool buy zone. These platforms provide strong support for the bottom formation, especially since this was a breakaway gap.

Guilt Yield seller. NFLX STRONG DAY
Lockheed Martin, Netflix, Tesla, Bank of America see positive notes on earnings.
Multiple investment firm banks give positive sentiment on investments.

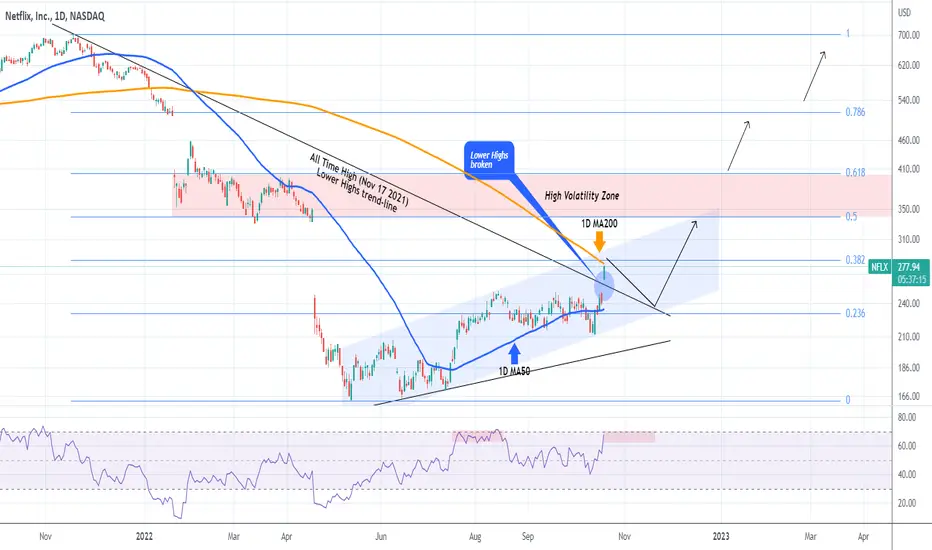
NETFLIX +15% near the 1D MA200 for the first time since January!Netflix (NFLX) had its highest daily opening in over one year, rising so far +15.21% form a 240.86 close yesterday to a 277.50 intra day peak. This is of course a fundamental move due to the big earnings surprise yesterday (3.1 EPS against a 2.18 forecast). Technically, this brings the price just below the 1D MA200 (orange trend-line), which has been untouched since January 05 2022!
A break above it has to be backed-up by new fundamentals though as there is a strong Resistance Cluster formed by both the 0.382 Fibonacci retracement level and the top (Higher Highs trend-line) of the Channel Up that started in mid-May. If that rejection occurs, then buying again on the 1D MA50 (blue trend-line) would be the most optimal low risk strategy, targeting just below the 0.5 Fibonacci level at 330.00. Further long-term buys can be taken, in our view, only above the 0.618 Fib which is the top of the High Volatility Zone of January - April 2022.
P.S. Check our previous analysis on Netflix in an attempt to price a good long-term buy. Has been working out very well so far:
-------------------------------------------------------------------------------
** Please LIKE 👍, SUBSCRIBE ✅, SHARE 🙌 and COMMENT ✍ if you enjoy this idea! Also share your ideas and charts in the comments section below! This is best way to keep it relevant, support me, keep the content here free and allow the idea to reach as many people as possible. **
-------------------------------------------------------------------------------
You may also TELL ME 🙋♀️🙋♂️ in the comments section which symbol you want me to analyze next and on which time-frame. The one with the most posts will be published tomorrow! 👏🎁
-------------------------------------------------------------------------------
👇 👇 👇 👇 👇 👇
💸💸💸💸💸💸
👇 👇 👇 👇 👇 👇
SHORT | NFLXNASDAQ:NFLX
Possible Scenario: SHORT
Evidence: Price Action
TP1: 211$
TP2: 195$
TP3: 165$
*Today is the earning day, and I expect a 20% haircut. Let's see.
My idea is based on price action, not ER; ER accelerates it.


NFLX Potential for Bearish Continuation | 12th October 2022On H4, with the price moving below ichimoku cloud, and RSI is showing a descending trend, as well as breaking the support line, we have a bearish bias that the price may drop from the sell entry at 212.72, which is in line with the 50% fibonacci retracement to the take profit at 163.08, where the previous swing low is. Alternatively, the price may rise to the stop loss at 246.14, which is in line with the previous swing highs.
Any opinions, news, research, analyses, prices, other information, or links to third-party sites contained on this website are provided on an "as-is" basis, as general market commentary, and do not constitute investment advice. The market commentary has not been prepared in accordance with legal requirements designed to promote the independence of investment research, and it is therefore not subject to any prohibition on dealing ahead of dissemination. Although this commentary is not produced by an independent source, FXCM takes all sufficient steps to eliminate or prevent any conflicts of interest arising out of the production and dissemination of this communication. The employees of FXCM commit to acting in the clients' best interests and represent their views without misleading, deceiving, or otherwise impairing the clients' ability to make informed investment decisions. For more information about the FXCM's internal organizational and administrative arrangements for the prevention of conflicts, please refer to the Firms' Managing Conflicts Policy. Please ensure that you read and understand our Full Disclaimer and Liability provision concerning the foregoing Information, which can be accessed on the website.

NFLX - Seems to be holding Pivot..Breakout soon?
Held VMA and printed a big bullish candle on 09/28 ++
Now reclaimed 11 EMA and seems to be bullflagging on daily. ++
Has shown good resilience in weak conditions. If it breaks 252, will likely test 300 before ER.

NETFLIX AND CHILL? BEARISH DIVERGENCES FORMINGBearish Divergences forming on daily timeframe.
We expect the stock market to pull back in the next days therefore Netflix may retest the support one more time to build a strong base before filling the gap.
Be patient, wait for a pullback .
Buy low, sell high

$NFLX MAKE OR BREAK NFLX is expected to break to the upside but due to current market conditions she might get dragged down with everything else. keeping a close eye on the break out to the downside or the upside keep close eyes.

NETFLIX: SAME SCENARIO?Hi guys, i'm looking some stock to buy in the coming weeks/months if market will collapse and for now i'm watching carefully Netflix.
What do you think?
Is the 2012 crash similar to today situations?
Let me know, for now i'm just looking at some good entry point to start accumulating

NFLX: Inside a CONGESTION! How to proceed?• NFLX is trading inside a range between $213 - $ 251;
• The 21 ema is flat, another indicator that the mid-term trend is neutral;
• Since it is a congestion, NFLX is a buy when it is near $213, and a sell when it is near $251;
• The price action is uncertain, and NFLX would need to do a real breakout either to the upside or to the downside so we can work with new key points;
• If NFLX loses the support at $213, then the next target will be the $190;
• By breaking the $251 it will probably try to fill the last monster gap at $333;
I’ll keep you guys updated on this. Remember to follow me for more analysis like this! Keep in touch.

Netflix ready for another breakdown?Netflix - Intraday - We look to Sell a break of 214.49 (stop at 224.21)
Price continues to trade within the triangle formation.
Posted a Double Top formation.
Trend line support is located at 218.00.
A break of the recent low at 214.69 should result in a further move lower.
214.69 has been pivotal.
Daily signals are bearish.
Short term momentum is bearish.
There is no clear indication that the downward move is coming to an end.
Our profit targets will be 191.61 and 182.61
Resistance: 230.00 / 240.00 / 250.00
Support: 215.00 / 200.00 / 190.00
Disclaimer – Saxo Bank Group. Please be reminded – you alone are responsible for your trading – both gains and losses. There is a very high degree of risk involved in trading. The technical analysis , like any and all indicators, strategies, columns, articles and other features accessible on/though this site (including those from Signal Centre) are for informational purposes only and should not be construed as investment advice by you. Such technical analysis are believed to be obtained from sources believed to be reliable, but not warrant their respective completeness or accuracy, or warrant any results from the use of the information. Your use of the technical analysis , as would also your use of any and all mentioned indicators, strategies, columns, articles and all other features, is entirely at your own risk and it is your sole responsibility to evaluate the accuracy, completeness and usefulness (including suitability) of the information. You should assess the risk of any trade with your financial adviser and make your own independent decision(s) regarding any tradable products which may be the subject matter of the technical analysis or any of the said indicators, strategies, columns, articles and all other features.
Please also be reminded that if despite the above, any of the said technical analysis (or any of the said indicators, strategies, columns, articles and other features accessible on/through this site) is found to be advisory or a recommendation; and not merely informational in nature, the same is in any event provided with the intention of being for general circulation and availability only. As such it is not intended to and does not form part of any offer or recommendation directed at you specifically, or have any regard to the investment objectives, financial situation or needs of yourself or any other specific person. Before committing to a trade or investment therefore, please seek advice from a financial or other professional adviser regarding the suitability of the product for you and (where available) read the relevant product offer/description documents, including the risk disclosures. If you do not wish to seek such financial advice, please still exercise your mind and consider carefully whether the product is suitable for you because you alone remain responsible for your trading – both gains and losses

NFLX, is now the strongest FAANG stock. It should bounce again.NFLX has proven in recent weeks to be the strongest stock in the FAANG family of stocks. It has held above a long-term trendline linking the 2013 and 2016 lows.
Comparing the ratios of the SPX and each of the FAANG stocks, NFLX is the only one that has held above the June 2 high.
This is a short term trade to take advantage of a bounce and then decide according to price action.
We are expecting a bounce in the SPX tomorrow Monday or Tuesday after extreme readings on several indicators. We do not expect a very long lasting rally and when the downtrend resumes, NFLX will probably follow suit as well.


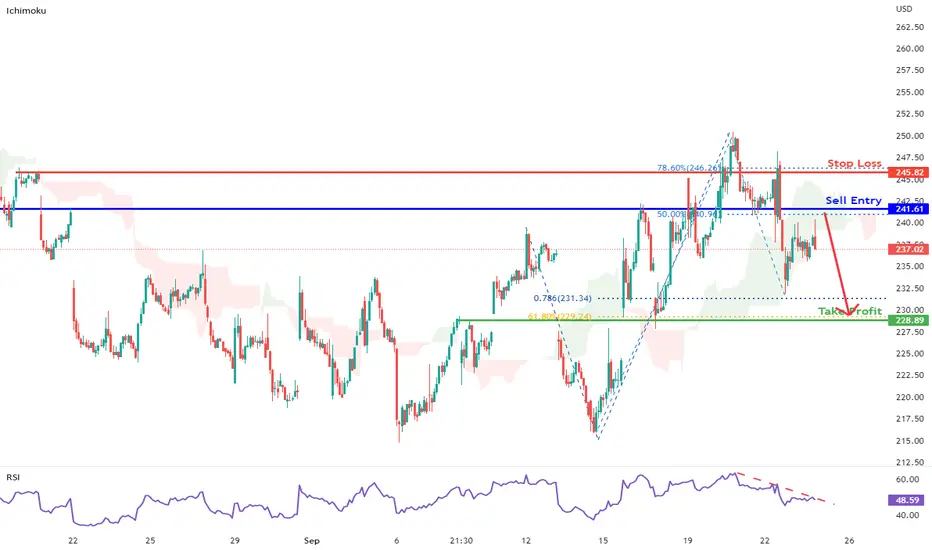
NFLX Potential for Bearish Continuation| 23rd Sept 2022On H4, with the RSI is showing a descending trend, and price is breaking ichimoku cloud, we can expect the price drop form the sell entry at 241.61, which is in line with the 50% fibonacci retracement and overlap resistance to the take profit at 228.89, which is in line with the overlap support and 61.8% fibonacci retracement. Alternatively, the price may rise to the stop loss ta 245.82, where the 78.6% fibonacci retracement is.
Any opinions, news, research, analyses, prices, other information, or links to third-party sites contained on this website are provided on an "as-is" basis, as general market commentary, and do not constitute investment advice. The market commentary has not been prepared in accordance with legal requirements designed to promote the independence of investment research, and it is therefore not subject to any prohibition on dealing ahead of dissemination. Although this commentary is not produced by an independent source, FXCM takes all sufficient steps to eliminate or prevent any conflicts of interest arising out of the production and dissemination of this communication. The employees of FXCM commit to acting in the clients' best interests and represent their views without misleading, deceiving, or otherwise impairing the clients' ability to make informed investment decisions. For more information about the FXCM's internal organizational and administrative arrangements for the prevention of conflicts, please refer to the Firms' Managing Conflicts Policy. Please ensure that you read and understand our Full Disclaimer and Liability provision concerning the foregoing Information, which can be accessed on the website.
NFLX Down Flag Distribution zone(Down Flag Formation) on Netflix stock. If ıt broke out down the price may dump. According to momentum ıt will break out to down.

Netflix in an ascending triangle.Netflix - 30D expiry - We look to Buy a break of 252.11 (stop at 234.98)
Daily pivot is at 251.99.
A break of yesterdays high would confirm bullish momentum.
We are trading at oversold extremes.
Although an initial rally was posted, sellers emerged and follow through bearish momentum resulted in all the previous day's gains being overturned.
Daily signals are mildly bullish.
Although we remain bullish overall, a correction is possible with plenty of room to move lower without impacting the trend higher.
The trend of higher lows is located at 217.00.
Price action has formed a bullish ascending triangle formation.
Our profit targets will be 297.88 and 307.88
Resistance: 245.00 / 252.00 / 260.00
Support: 230.00 / 220.00 / 215.00
Daily perspective
Disclaimer – Saxo Bank Group. Please be reminded – you alone are responsible for your trading – both gains and losses. There is a very high degree of risk involved in trading. The technical analysis , like any and all indicators, strategies, columns, articles and other features accessible on/though this site (including those from Signal Centre) are for informational purposes only and should not be construed as investment advice by you. Such technical analysis are believed to be obtained from sources believed to be reliable, but not warrant their respective completeness or accuracy, or warrant any results from the use of the information. Your use of the technical analysis , as would also your use of any and all mentioned indicators, strategies, columns, articles and all other features, is entirely at your own risk and it is your sole responsibility to evaluate the accuracy, completeness and usefulness (including suitability) of the information. You should assess the risk of any trade with your financial adviser and make your own independent decision(s) regarding any tradable products which may be the subject matter of the technical analysis or any of the said indicators, strategies, columns, articles and all other features.
Please also be reminded that if despite the above, any of the said technical analysis (or any of the said indicators, strategies, columns, articles and other features accessible on/through this site) is found to be advisory or a recommendation; and not merely informational in nature, the same is in any event provided with the intention of being for general circulation and availability only. As such it is not intended to and does not form part of any offer or recommendation directed at you specifically, or have any regard to the investment objectives, financial situation or needs of yourself or any other specific person. Before committing to a trade or investment therefore, please seek advice from a financial or other professional adviser regarding the suitability of the product for you and (where available) read the relevant product offer/description documents, including the risk disclosures. If you do not wish to seek such financial advice, please still exercise your mind and consider carefully whether the product is suitable for you because you alone remain responsible for your trading – both gains and losses
