NFLX is going to complete wave 4NFLX is going to complete it's retrace to 0.33 of wave 3. If this wave counting is correct, wave 5 will be formed after wave 4.
NFLX

NetFlix needs to Attention nowNetflix is so ready to start a Reverse and Rise Price Cause it falls more than 50% of Price and now on a Strong support that can push price to up, so Buy carefully and buy it in 4 Step.
Buy@ 210$, 180$, 140$, 90$
Stop loss@ 80$
Take Profit@ 700$, 950$, 1200$
it's so Important to buy Step by step and not be Greedy and buy More Volume in 90$

Near 6 year lowas price goes lower, good long term buy opportunities ahead, near enough 5 years of price movement undone

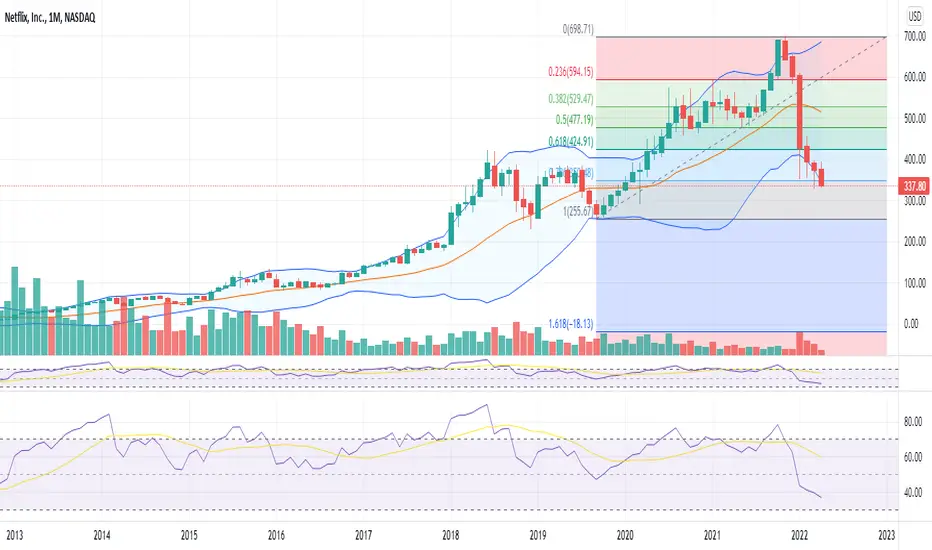
Netflix - Potential for 250% Upside?Is there an opportunity for a good bull trend for Netflix ?
There has been a lot of discussion around Netflix lately with sharp drop in share price after the latest earnings report. And not getting much into fundamental analysis where the main message is clear - growth of subscribers and hence revenue, profits and generally margins is going to slow down. Here are few points/questions on the potential development of the price for discussion:
Has the market already priced this negative forecast with 70% collapse in share price?
Is the price fair now considering that (1) P/E is at the lowest point 19 x compared to over 70 x 2 years ago, and over 100 x 3 years ago, (2) RSI is the lowest since 2011 on the weekly timeframe?
Is technical analysis telling us that correction in the shape of an Expanded Flat (using Elliot Wave Analysis) is getting to completion and there is a new bull trend may be beginning soon with upside of 250% to $700?
Technical analysis remarks - this idea is based on formation of the Expanded Flat correction with 3-3-5 structure as noted in the graph:
First wave (zigzag) - drop in price from 21 Jun 2018
Second wave (zigzag) - bullish trend which is difficult to mark as an impulse, from 26 Dec 2018
Third wave (impulse) - a clear 5 wave decline from 17 Nov 2021
This is only one of the potential scenarios that can develop in Netflix and it is not an advice to go long All-In. There are different rules for entering position depending on your risk appetite.
Glad to hear your thoughts on the analysis and if you see the next potential scenarios through fundamental or technical lenses differently, please share.
Thanks

It is buy opportunity in 200As the chart shows price decreased and it is near 203 as the good support and the price of 2018 , netflix is not exploded so dont sell yours cheap, from 203$ it can come back to pull back .
I believe that Netflix market maker buy all your in the dip for comming days to sell you again
203$ support in exactly equal to the channel width and if we see and signs of come back such as divergence with RSI or good volume we can enter with target of higher price
Have a good days
NFA

NFLX Netflix: 1D Chart ReviewHello friends, today you can review the technical analysis idea on a 1D linear scale chart for Netflix, Inc. (NFLX).
The chart is self-explanatory. Death cross may be coming up. RSI just broke out of the support line. Keep an eye on the Support Zone.
Included in the chart: Trend line, Support and Resistance Lines, RSI, MFI, Death Cross, Simple Moving Average, EMA Ribbons, Volume.
If you enjoy my ideas, feel free to like it and drop in a comment. I love reading your comments below.
I have additional charts below on cryptocurrencies, stocks and more to review. Check them out!
Disclosure: This is just my opinion and not any type of financial advice. I enjoy charting and discussing technical analysis . Don't trade based on my advice. Do your own research! #cryptopickk


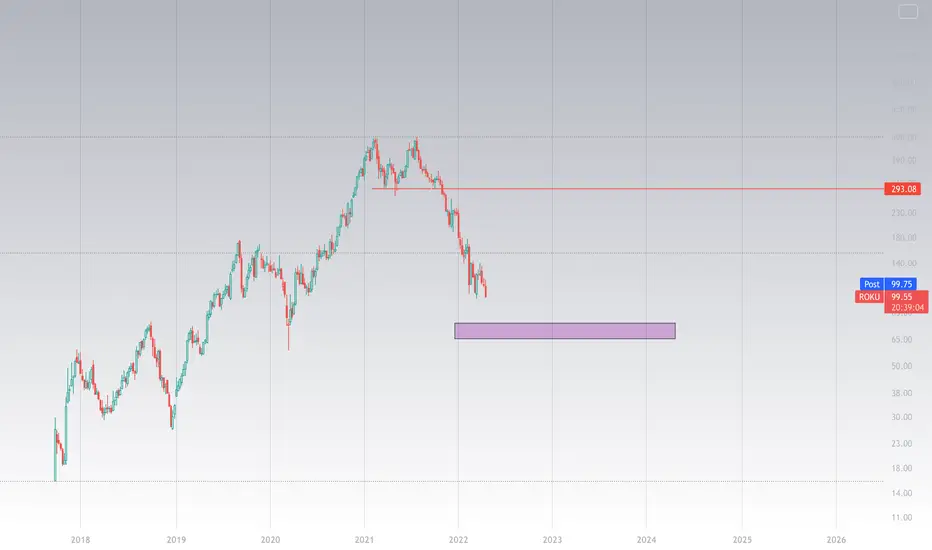
ROKURoku maybe after ER will finally go down towards that 70 target??
I'd be interested in playing the puts to the downside on this name after what I saw happen to NFLX.
Weekly looks like it wants continued downside.
NETFLIX When bubbles pop. The bottom isn't in yet.Netfilx (NFLX) is having a historic weekly selling pressure after the negative quarterly report, which showed a loss of 200k subscribers, putting a stop to a growth for the first time in 10 years.
This chart on the 1W time-frame shows how the NFLX bubble popped in mid January 2022. The Jan 18 1W candle broke both below the parabolic growth curve (black) and the 1W MA200 (orange trend-line) in the same week. That was the confirmation of the start of a Bear Cycle. So far the stock is on an almost -70% correction from the November 2021 All Time High (ATH) but this is by no means the bottom.
Since the 1W MA200 broke, which was a trend-line supporting the bubble since January 2013, we have to go to the monthly (1M) time-frame to look for the next Support. That is the 1M MA200 (red trend-line) which is currently at $137.82. If that is reached before June, that would represent a -80% correction from the top, which is typical for Bear Market bottoms. The 1W RSI is at the lowest level historically since Netflix started first trading.
--------------------------------------------------------------------------------------------------------
** Please support this idea with your likes and comments, it is the best way to keep it relevant and support me. **
--------------------------------------------------------------------------------------------------------

NFLX express - where's the next stop..???NFLX
Currently the price is below the support/resistance structure, after a correction/pullback, I expect the price to continue lower
Support area :-
1st support area - near 180 level
2nd support area - near 130 level
Trade Wisely
*The content on this analysis is subject to change at any time without notice, and is provided for the sole purpose of assisting traders to make independent investment decisions.

This is what happens when parabolic advances are violatedThe violation of parabolic advances lead to 80% corrections as shown on the NFLX chart

Will Netflix (NFLX) replicate the past ?Past events do not reproduce the future but out of curiosity, just an idea of what it might look like if we look at how it happened in the past.
We are here in logarithmic scale (necessarily).

NFLX: it was a good movie!The earnings season continues in the U.S. stock market. Netflix (NFLX) is down by 35% on a negative quarterly report. Netflix lost 200,000 subscribers in Q1.
Subscriber growth stopped for the first time in 10 years! The company acknowledged that it was becoming harder and harder to grow its subscriber base in many markets. Also, the termination of streaming platforms in russia could have affected this. Closest competitor and streaming giant Disney (DIS) fell by 5.56% after the Netflix report.
Fundamental analysis. Globally, we can already say that against the background of geopolitical instability, rising prices for energy and high inflation - user growth is not expected, because consumers will spend more money on basic products (food, real estate) than on additional luxury products.
Also, the lockdown in China, as one of the world's leading manufacturers, does not help market to grow and the negative news about the worsening economic indicator does not inspire optimism at all. Chinese developer Evergrande is just the beginning of the chain.
Chart analysis. On the chart we marked the accumulation and distribution zones. The trigger for Netflix's price rise was the HYPE (according to G.Trends data) around the newsmaker of the 2021 TV series Squid Game. The hype helped the big player sell stocks even faster.
The low liquidity areas were a great support for the price. Note the increased volume of the first bottom. This is where traders and investors opened longs, expecting this to be the end of the fall. The second bottom liquidated traders who use any leverage, and the panic sell-offs now will only help the big player to buy more.
The liquidity gaps areas:
1. $188-226
2. $389-422
Technically, these levels could give a good clue about the direction of the trend in the future.
Right now the price is down by 73% from the ATH. Here the accumulation phase may begin again in the $200-350 range.
Write in your comments, did the Squid Game HYPE accidentally become a NFLX highs (ATH)?
Friends, press the "like" button, write comments and share with your friends - it will be the best THANK YOU.
P.S. Personally, I open an entry if the price shows it according to my strategy.
Always do your analysis before making a trade.

NFLX (Netflix) expected correction to 185 before bullishAn ABC correction seems to play out
To reach parity of A and C each leg corrects with the same 50%, reaching 185
Divergence in all wave 5's
Expecting a bullish reversal mid may

NFLX: Bill Ackman and knowing when to quitBy now, if you haven't heard about Netflix's results then you've surely been living under a rock!
The key driver of the price decline was the first decline in subscribers in 10 years in Q1...
-200k
But the real story here isn't Netflix's decline, but the way a one Bill Ackman has responded to the price decline.
If you don't know Bill Ackman, he's the famed owner and fund manager at Pershing Square Capital Management, who is notorious for his massive short on Herbalife (which got blown out of the water, but he was absolutely right to be short that hell hole of a company).
Ackman started buying shares in Netflix back in late January, and built up a position to the tune of 3.1mm shares...
In a letter to his clients, Ackman praised the company's "best-in-class management team" and on Twitter, the manager said he has long admired Netflix CEO Reed Hastings and the "remarkable company he and his team have built."
But as we know, things change quickly in markets.
Let me preface this by saying I don't think Pershing's Netflix bet was a particularly strong one.
Many streaming services have been introduced increasing competition and diluting the customer pool and with budgets constrained by inflation, demand for luxuries was always going to subside.
That's the economic case, but from a market focused and portfolio basis, there was always going to be turbulence as the Fed turns ever more hawkish - higher rates lead to cash flows in the future being discounted less as the working average cost of capital increases, which is BAD for high growth companies with large price:earnings multiples (see what's happened to Zoom, Roku, and more generally, all the pandemic related memestocks with massive PE ratios which have been nicely deflated over the last 12 months or so).
But that doesn't take away from how Ackman handled his Netflix position.
See, the central thesis was really predicated on positive subscriber growth...
Netflix didn't achieve that this quarter...
So Ackman dumped the position.
That's what everyone should be doing, and it is how I look at risk and management of positions...
If your central thesis changes, then change your position.
Now to go further on why I don't think Netflix is a good buy, and why I disagree with Ackman that management is good, you simply have to take a look at their FX hedging strategy (or lack of).
In 2021, they lost $280mm due to not hedging their FX exposure globally.
For a company that operates in every country in the world, this is quite frankly insanity, and shows the management that they have too much concentration on subscriber growth and not enough on where they might be bleeding revenue, especially revenue that has a relatively easy fix.
But again, this is something to learn from.
Work out the core thesis as to why people will buy the stock - prioritise what matters.
To me, the unhedged aspect is simply alluding to the management not looking at certain parts of the biz, which then asks the question, 'what else don't they have their eye on?'
But if that subscriber growth had gone up, it wouldn't matter.
Prioritise your themes.
The key thing to remember as well, is that although this is a big monetary loss, the position was only about 4% of AUM at Pershing.
Some people lose that and more in a day!
So this is simply another day for good old Bill.

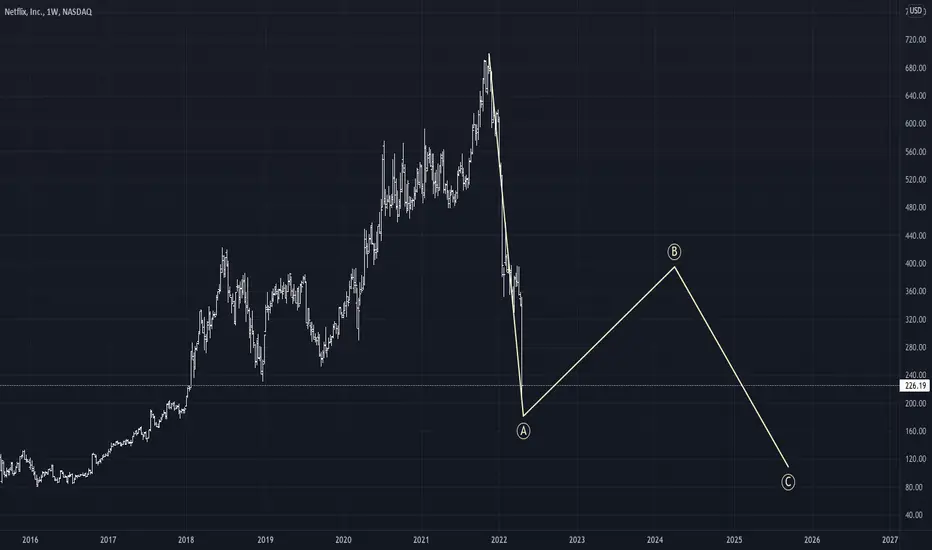
Netflix clear path going forward
In a nutshell for the non- analyst out there : I see a clear move down in Netflix fallowed by a correction and than a final move down.
For the wave analyst:
This is a clear wave A to the downside in 5 waves , now being in the 5th wave.
After the completion of this move down, a correction Wave B will follow and then the final move C down usually equal in length with the first Wave A but much shallower , and not that steep as this wave A.
Disclosure: I am not an investor in Netflix, this is my analysis and does not constitute financial advice.
What's your take on $NFLX ?
NetflixWow , Netflix stock is huge sharp decreased and really i just determined one supply zone in weekly time but its not thecnical things its MACRO DATA THING

It look like the bridge in the Squid game..!All the gains in the past 50 months were wiped out..!
No need for more explanation..!
Try to be on the right side of the game is important..!
What if Netflix goes down another 30-50% from here?
Best,
Dr. Moshkelgosha M.D
DISCLAIMER
I’m not a certified financial planner/advisor, a certified financial analyst, an economist, a CPA, an accountant, or a lawyer. I’m not a finance professional through formal education. The contents on this site are for informational purposes only and do not constitute financial, accounting, or legal advice. I can’t promise that the information shared on my posts is appropriate for you or anyone else. By using this site, you agree to hold me harmless from any ramifications, financial or otherwise, that occur to you as a result of acting on information found on this site.

Netflix Investment Outlook Volume 2Top called July 27th, 2021, months prior. No surprises/remorse here! The idea is linked below.
Moving forward, Netflix's price action will be choppy and downward facing. ABC correction in progress; B wave recovery expected soon. Bottom of the historical channel - end game. Fundamentally, increased competition will continue the downtrend in subscriptions. Conclusion: Bear!

Was the NFLX sell-off predictable???Of course it was! You could have sold the head and shoulders bearish chart pattern back in November, before Jim Cramer said NFLX is a buy! :)
My forecast is that NFLX will make a small bounce before going even lower, at a buy area of $175 - 190.
Looking forward to read your opinion about it.

Netflix Potential Double BottomHey there as you know netflix bloody novadays, especially elon musk talk about this company. In technicaly we see double bottom here confirmation is 362 if we retest again 362$ its safe to bought this stocks.

WHAT'S GOING ON WITH THE NETFLIX QUOTATION? +67% FALL!What do you think about this? Are we in a favorable scenario to invest in Netflix shares? Do you think this drop will last longer or with the RSI at such a low level, can we get a breather from the market? Maybe even a trend reversal (which has been happening for a long time now, this price drop)

NFLX how can they guide higher? $267 next support?Last quarters guidance for growth was abysmal. This was BEFORE the Russian invasion of Ukraine, terminating service for 200,000 Russians. How many customers are lost in Ukraine? Before the "official" USA inflation numbers higher than expected. Before oil and gas surged squeezing the middle class in north America. These headwinds will continue to cause the consumer to begin cutting back on non-essentials. I think it's great NFLX will be cutting back on password sharing which might give them a small bump. Where will their growth come from? How can they curb inflation related expenses? The chart looks oversold but it was way oversold prior to the last ER too.