NFLX Netflix SelloffIf you haven`t shorted the top at my last call:
then you can see NFLX reached a strong support area and it`s now consolidating.
In 2021 insiders sold around $500Mil worth of shares.
The buy opportunity area is $350 - $385 in my opinion if you want to long it once again.
Looking forward to read your opinion about it.
NFLX

NFLX bearish fade on 1/21This will be a slam dunk trade. NFLX bearish fade on the market open for 1/21. It's been sold off for several weeks now, and it's looking to drop 20% (as of right now) after earnings. It looks to be gapping down to a long term support area. Easy buy for a day trade higher, but be careful of the rollover selling later. I'd get in early for the move, and close once there is any hint of stopping. I'll be looking to sell puts. But I wouldn't look to hold on past half a day.

Netflix leading the market crush, set dips buys ?Netflix chart hit straight away their support zone, things are getting ugly.

How Low Can #Netflix Go? 📉 (NASDAQ: $NFLX)Netflix, Inc. provides entertainment services. It offers TV series, documentaries, and feature films across various genres and languages. The company provides members the ability to receive streaming content through a host of Internet-connected devices, including TVs, digital video players, television set-top boxes, and mobile devices. It also provides DVDs-by-mail membership services. The company has approximately 204 million paid members in 190 countries. Netflix, Inc. was founded in 1997 and is headquartered in Los Gatos, California.

NFLX Bullish or Bearish ??1. Its at the majore support level , SInce broader market fell so the script ,
2. The conflunce of volumetric base will piush the script up unless there is more fall in braoder market
3. The script price corrected very well , Now its time to rise up .
4. Tradee with targets as shown , its beter R:R entry now
with Struch Stop Loss
CHEERS !!
LIke if you agree with the analysis

Potential Pull back for the QQQsWith the pundits calling H1 to be uncertain with the backdrop of interest rates and recently missed earnings from a tech giant, these are potential pull backs for $NQ in various bearish pull back scenarios each visiting critical moving average support.
Revisit SMA 100 @ 14,000 with a -15% pull back in Jun-22
Revisit SMA 150 @ 12,500 with a -25% pull back in Jul-22
Revisit SMA 200 @ 11,000 with a -35% pull back in Aug-22 (less likely scenario)
Pure analysis, no position and not investment advice.

Discussion: Market CorrectionA/ Issues:
1) Grow stocks dropped 50% - 70% (long term portfolio)
2) Margin calls
3) Run out of cash
4) Average down?
5) Passive income on weekly / monthly basic
B/ Solutions:
1) Review your stock in term of Fundamental Analysis, Business Analysis to make final decision
2) Stay focus in family & health
3) Buy PUT (5%) to protect your account
4) Average down or NO average down depends upon each person
5) Sell Cover Call to get premium to collect weekly/monthly income and/or Buy PUT
6) Exchange ABC to XYZ and/or dividend stocks
7) Utilize home equity to invest in big cap and/or mega cap stocks

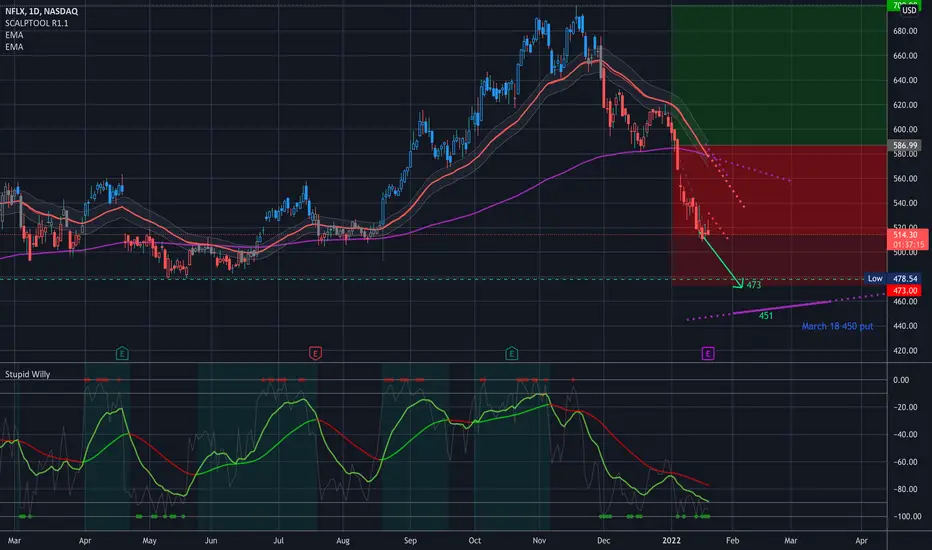
Netflix plays Squid Game with investors in the past 2 months!25% decline in less than 2 months for NFLX is not what many people expected, but option data suggest more volatile days ahead.
Looking at the options date for the next 4 weeks, you can see 1.37 Put/Call ratio which is very high and indicate more bearish momentum!
Option wall:400-580
Maxpain: 550
Be careful with the earning in the next 8 days!
The big question is if it first move toward 580 and then slips down toward 400 zone or the opposite???
Since I do not have the answer, I will stay neutral.
You can see the most important support(green line) and resistance (red line) levels.
Best,
Moshkelgosha
DISCLAIMER
I’m not a certified financial planner/advisor, a certified financial analyst, an economist, a CPA, an accountant, or a lawyer. I’m not a finance professional through formal education. The contents on this site are for informational purposes only and do not constitute financial, accounting, or legal advice. I can’t promise that the information shared on my posts is appropriate for you or anyone else. By using this site, you agree to hold me harmless from any ramifications, financial or otherwise, that occur to you as a result of acting on information found on this site.

NFLX big time head and shoulders - target 475volume spike on neckline break. interestingly the projection here would be to the bottom end of the previous trading range. looks poopy for sure with the head actually being a clear double top. hard to find much to like here.

$NFLX Key Levels, Analysis & Targets $NFLX Key Levels, Analysis & Targets
No position at this time but when It hits 473 or even 478 I’ll likely do something.
Alerts set.
There is one more support I didn't include, accidentally, at the 504 level...
GL, y’all…
——————
I am not your financial advisor, but I will happily answer questions and analyze to the best of my ability but ultimately the risk is on you. Check out my ideas, but also do your own due diligence.
I am not a bull. I am not a bear. I just see what I see in the charts and I don’t pay too much attention to the noise in the news.
If you want me to analyze any stock or ETF just leave me a comment and I’ll do it if I can. (If I have time)
Have fun, y’all!!
(\_/)
( •_•)
/ >🚀
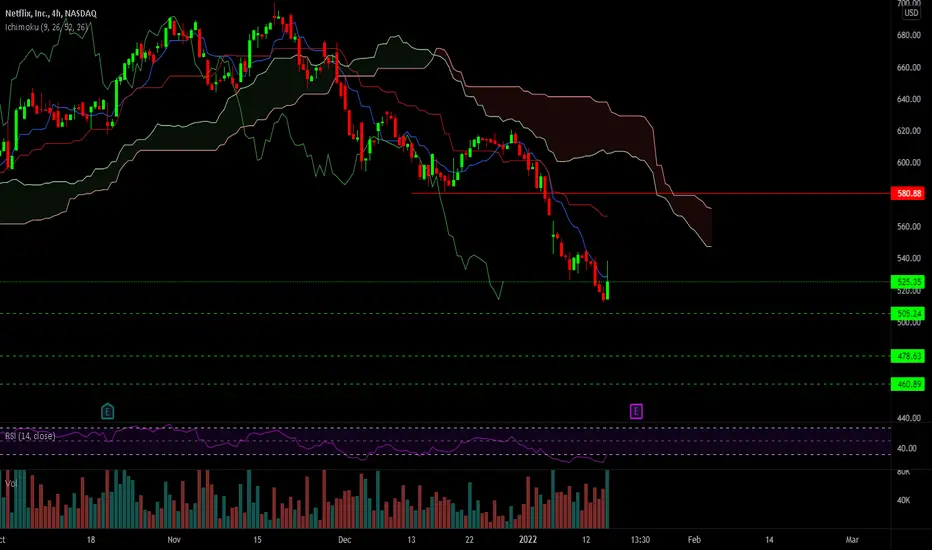
NFLX pre-earnings breakdown NFLX Earning today, NFLX has 3 levels of support to hold to downward momentum.

$NFLX Earnings run up!-We have earnings on the 1/20 (thu) And we are looking to make a continuation downwards as we have been respecting the 9-day ema very well
-Now we can see a trend reversal and I am willing to switch to calls if necessary but mainly looking at puts
-If it does play out these are my profit target levels we just need to see a continuation of the trend
NFLX: Setting the Stage for Big Tech and Growth Earnings on Thursday and the first big tech name to report (as always).
Over 527 can give you a trade, but I think they want to take this thing down to the 500 mark in to earnings. I will spec buy at 3:58pm on Thursday (eastern time) the $510c if she is red and trading around $500.

NFLX - Looking for 440-450 Buying ZoneNFLX, looking for this W4 to complete around 440-450 which represents the 2002 Longterm middle trend line. From here, I believe NFLX has upside into 960's as a long term hold.

The Week Ahead: NFLX, ARKF/ARKG/ARKK, XBI, KWEB, URA, IWM, QQQI haven't done one of these in quite some time, but thought I'd do one over this long holiday weekend.
Earnings:
I looked at a number of these for next week (there are quite a few) and have culled things down to the most liquid options underlyings, ideally with implied volatility rank >70% and 30-day greater than 50%. Only NFLX really fits that bill, even though it's a smidge shy of a 50% 30-day. For instance, I did look at CTXS (87/46), but when I dug into the options table, I wasn't fantastically excited about setting up a short strangle with only 2.5 to 5-wides where I'd want to set up my tent on both the put and call sides.
NFLX (76.9% rank/44.8% 30-day) announces earnings on Thursday after market close, so look to put on a play before the end of that session if you're looking to play the announcement for a volatility contraction. Pictured here is a February 18th 450/610 short strangle with the legs camped out at the 13 delta. Paying 9.20 at the mid as of Friday's close on buying power of 52.59 (on margin), it has a 17.5% ROC at max, 8.7% ROC at 50% max. I like to go wider with earnings announcement volatility contraction plays since these do one of two things: (1) come in immediately; or (2) give you headaches for several cycles if the move has been overly large and you have to defend the setup to scratch in a contracted volatility environment.
If you're more of a defined risk bent, throw on some wings: the February 18th 440/450/610/620 iron condor is paying 1.90 on buying power effect of 8.10, 23.5% ROC at max, 11.7% ROC at 50% max.
Naturally, these are just preliminary pricing and strikes. You'll want to adjust strikes as necessary, since the underlying is likely to move somewhat running into earnings.
Exchange-Traded Funds Screened for Implied Volatility Rank >50% and 30-Day >35% and Ordered by Implied Volatility Rank:
ARKF (84/52) (Cathie Woods' Fintech Innovation)
XBI (83/43) (Biotech)
ARKG (79/59) (Cathie Woods' Genomic Revolution)
KWEB (60/51) (China Internet)
ARKK (59/44) (Cathie Woods' Innovation)
URA (41/59) (Uranium)
A lot of Cathie Woods' stuff in there ... . I like to reserve these for the monthlies, since the weeklies aren't all that liquid in some of these. Unfortunately, the February 18th monthly is a little short in duration for my tastes (33 days until expiry) and March a bit long, so will probably hand sit on deploying buying power in this area until the March monthly's duration shortens -- it's currently 61 days, and I like to keep things +/- a week or so of 45 days.
One underlying that doesn't really have a 52-week valid implied volatility rank is BITO (1/68), since it hasn't been around for 52 weeks yet. However, that "1" indicates that its implied is low within the range its established since inception, and I'd naturally prefer it to be higher even though its 30-day outranks all of 30-days I've got in my little list, so I'm keeping an eye on it, having just exited a BITO short strangle on Friday.
Broad Market Exchange-Traded Funds Ordered by Implied Volatility Rank:
XLK (46/27)
QQQ (43/25)
EFA (35/17)
IWM (36/26)
DIA (24/18)
SPY (23/19)
I've moved XLK from my exchange-traded fund grid to my broad market grid, since it enjoys a close correlation with SPY (.87 90-day) and an even closer correlation with QQQ. XLK is about half the size of QQQ, so if you like to layer on, it's a little more nimble for that purpose. I've been selling premium in small caps (IWM) in the weeklies to bide my time while monthly setups come in or have to be managed, but may consider sticking some of my pickle into QQQ next week given the fact that its rank implies that it's more "expanded" (if that makes any sense). I'd probably use the March 4th expiry, where the QQQ 16-delta 342/408 is paying 5.69 on buying power of 48.03, 11.8% ROC at max, 5.9% at 50% max. Naturally, the market may look entirely different from an implied volatility standpoint coming off a long holiday weekend, so I always have a second look at whether doing that is worthwhile once the market opens.

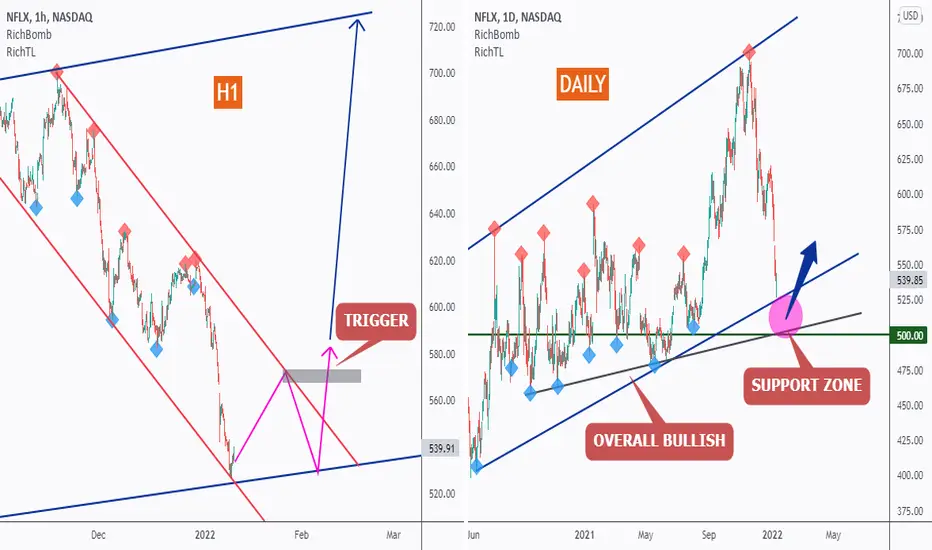
NETFLIX - My Trading Plan in a picture!Hello everyone, if you like the idea, do not forget to support with a like and follow.
on DAILY: right
NFLX is overall bullish trading inside the blue channel and is now approaching the lower trendlines and 500.0 support, so we will be looking for trend-following buy setups.
on H1: left
NFLX is forming a channel in red but the upper trendline is not valid yet, so we are waiting for a new swing high to form around it to consider it our trigger swing. (projection in purple)
Trigger => Waiting for that swing to form and then buy after a momentum candle close above it (gray zone)
Meanwhile, until the buy is activated, NFLX would be overall bearish can still trade lower till the lower the 500 support.
Good luck!
All Strategies Are Good; If Managed Properly!
~Rich
Potential for small bounce, but still BearishNetflix is down 22% from its high in November. There is a lot of downward momentum/pressure in this move and market structure is broken. Price has returned to the most recent Supply Zone, we've entered my "buy" zone, and sellers are ready to take a break--for now. I think a small bounce could happen from this level, but I'm expecting bearish momentum to carry the price deeper into the Supply Zone. I certainly wouldn't short here, but given all the negative energy, I'm not interested in NFLX until I see bullish divergence.
----------------------------------------------------------------
These are my personal views and not financial advice. Please do your own research before investing.
I'd love to hear your thoughts, ideas and feedback. Feel free to Comment and I'll try and get back to you quickly.
If you appreciated this analysis, consider Liking or Following . Thanks!

Netflix - wave 4 Looks like price is in an impulse channel, and the impulse misses the last wave 5. Meanwhile, price started the consolidation in the wave 4. It may take time...

What's up with Netflix $NFLXFor this analysis we are looking at the daily timeframe.
NFLX is in a nice uptrend, but currently we are seeing a retracement, which is the chance to buy a nice stock at a smaller price.
Netflix recently broke the upper resistance of an ascending triangle formation, which is a bullish sign. The break was followed by a fastly reached ATH from which the price dropped to the 550$ mark, which is 1. supported by a weekly trendline (TL) and 2. the upper resistance (now support) of the previously broken triangle pattern, which suggests that rn could be a good time to enter a long position, right? But before spending your hard earned money right away, have a look at the $NFLX earnings (January 27th). $NFLX lately tends to fail analyst expectations on earning reports (and $NFLX tends to perform better in Q1-Q3), the rather small drops after failing those kind of reports (as long as the expectations aren't missed drastically) tend to be corrected after a couple weeks, but this drop in price could give you a chance to buy a second position.
Idea: enter a long position during the next week (since we need confirmation that our supports are stable), your TP could be at the previous ATH (21% gain if you decide to enter where I will enter (you can see the trade entry on my chart))
As always: no financial advice

Rectangle Pattern!A rectangle occurs when the price is moving between horizontal support and resistance levels.
The pattern indicates there is no trend, as the price moves up and down between support and resistance.
The rectangle ends when there is a breakout, and the price moves out of the rectangle.
Some traders like to trade the rectangles, buying near the bottom and selling or shorting near the top, while others prefer to wait for breakouts. (Investopedia)
Double Top Scenario:
Correction Wave Scenario:
Conclusion:
NFLX will go down to 575-580 in the next 10 trading days or sooner!
Best,
Moshkelgosha
DISCLAIMER
I’m not a certified financial planner/advisor, a certified financial analyst, an economist, a CPA, an accountant, or a lawyer. I’m not a finance professional through formal education. The contents on this site are for informational purposes only and do not constitute financial, accounting, or legal advice. I can’t promise that the information shared on my posts is appropriate for you or anyone else. By using this site, you agree to hold me harmless from any ramifications, financial or otherwise, that occur to you as a result of acting on information found on this site.

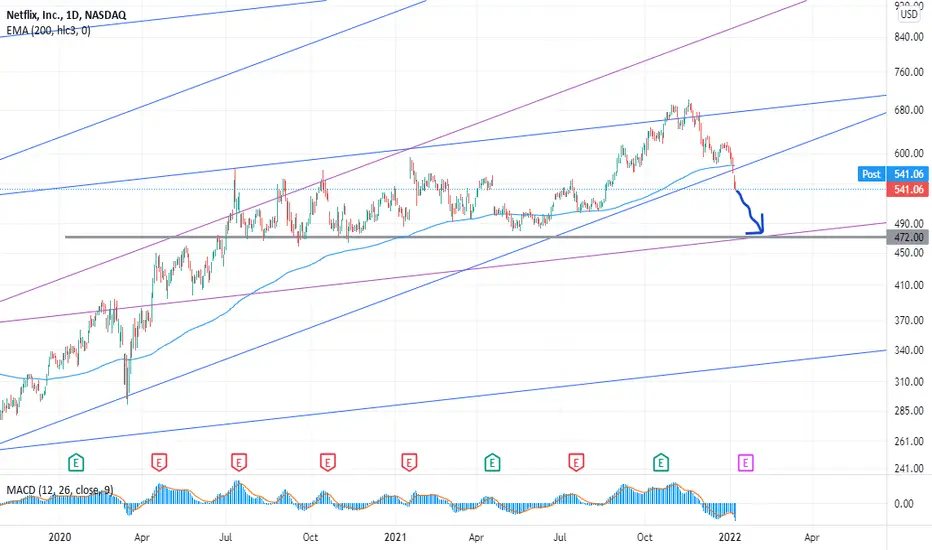
NFLX Support, then ShortNFLX
H&S forming or has formed depending on your point of view. I think we can see a bounce or BTFD! Especially because we are currently on the 200ma. This is not mandatory if the market really shows more panic and weakness we will get no bounce. Again playing the odds. Tomorrow is crucial to see support kick in, and can even squeeze a quick 9-10% return before going short.
Current Market Environment:
- Fed is going to reduce the balance sheet
- Hike in interest rates,
- EPS is slowing,
- Overall economic GDP is decelerating.

NFLXMultiple bounce from a monthly support, and now looking for a reversal. Long on breakout from the center of the channel with volume.
