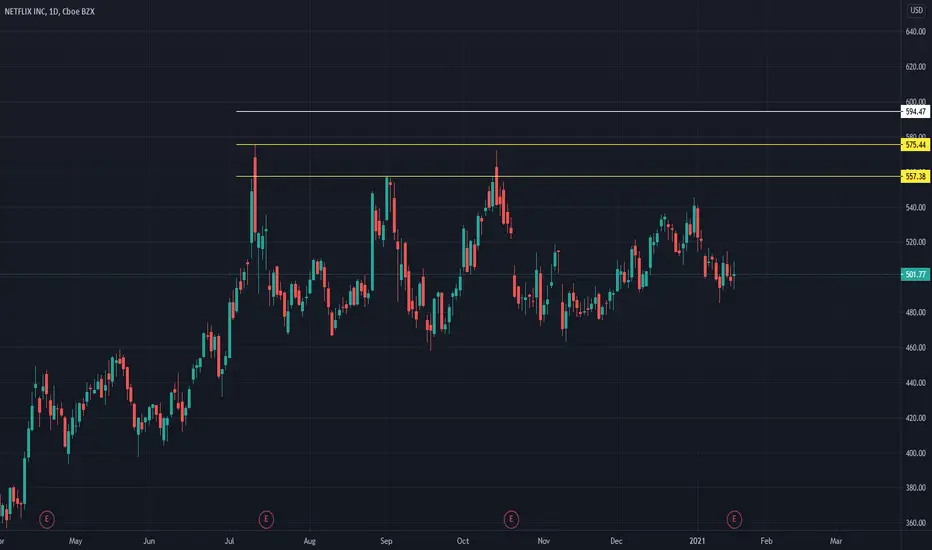
NFLX in a channel; good swing trade setupHello my fellow traders and devoted padawans. One of my followers asked me to analyze NFLX, so here it is. Although NFLX is a great stock it is going to have fierce competition from Disney+ so if you are a long term investor, keep that in sight. But we are here to talk about what's happening right now on the chart. As you can see, NFLX has been rangebound for quite sometime now. This can be seen as a healthy consolidation before a push up but it also means we can take advantage of the swings within the channel to make an extra buck while we wait for a move up (if that happens). I am not in NFLX but after looking at the chart I may jump in for a quick swing trade here and there if the opportunity presents itself.
CHANNEL
So let's talk about how you can take advantage of the channel, which in my opinion is one of the easiest "patterns" (not really a pattern but you get it) to trade because it is in a defined range. Now if you look at the chart you will see that the channel has different levels of support and resistance. That is fine because channels can have sub-channels, which is perfectly normal. The issue with sub-channels is that it may be difficult to know whether the price will move to the support/resistance of the outer channels or if it is going to stay contained within the inner channels. That is why we need other indicators to give us clear signals, a specific one in this case: the Stochastic oscillator.
STOCHASTIC TO THE RESCUE
The Stochastic is a very good oscillator to use in rangebound markets because when combined with other metrics, patterns, and indicators, it can give us clear buy and sell signals. Here I am using it in combination with the channels support and resistance only because that is enough for our scenario.
Sell signal
In this chart I made it very easy for you to see that when the price moves up to the resistance (any of them) and the Stoch is in overbought conditions (above 80 or close to it if we are lenient, which works for our scenario) and crossed bearish (blue line below red) the price fell. That crossover of the Stoch lines would be your sell signal (look at the lines and circles).
Buy signal
Likewise, when the price touches the support (any of the support levels) and Stochastic is in oversold conditions (below 20 or around 20) and the Stochastic lines cross bullish (blue over red) the price moves up. That bullish crossover would be your buy signal.
No trading zone
If there are crossovers of the Stohastic but the price is not reacting to support or resistance, hold off and wait for a better buy/sell signal. Don't overtrade.
MOVING AVERAGES
Finally, you can see that the 14,21, and 50 emas are forming a big ema confluence, which is normal and expected in rangebound markets. You can also see that they become resistance and support to the price, depending on where the price is. If the price is squeezed between support/resistance and the emas, it may be safe to wait for a break above or below the emas even if the Stoch is giving a buy signal and price is on support/resistance. Look at previous price action and use your diligence.
CONCLUSION
This pattern is very easy to trade if you are discipline and don't overtrade but it is not going to last forever so you need to monitor that the price stays within the channel and that other indicators don't start showing bullish or bearish sentiment, which could signal the pattern is about to be broken. In this chart I didn't add other indicators because they are supporting the rangebound move, but on your own chart it is worth adding other indicators to help you identify if/when the pattern is broken and the stock starts trending up or down.
Another long analysis my dear chart warriors but this is a lesson you will like to take with you for other trades. It is easy and simple and carries minimal risks because you can exit as soon as the pattern is broken.
Share the love:
If you get anything out of this TA, please like the chart so it moves up and others can benefit from my work. A simple click on the like button goes a long ways.
Follow for more:
I have an outstanding winning rate (check my other charts). If you want the best entry/exits just follow me, you won't regret. Thanks a lot!
***The ideas shared here are my opinion, not financial advise to place trades. Please do your own research before buying/selling stocks***
NFLX

As i said earning reports is greatIt can go higher a little much after all because, it is broke resistance.

NFLXNFLX is up 61 AH after reporting 8.5 million net new subscribers in its fourth quarter vs 2.2M reported in previous quarter. Netflix tops 200 million subscribers for the first time.
If NFLX can pull back in the morning and backtest the 557 level that can be a good entry to go long. Or you can wait for NFLX to break its previous ATH of 575 to go long.

AMZN 3120: Long into Earnings (NFLX replay) Target 3500Bulls may finally be rewarded on Feb 4, if the market holds.
AMZN has a very similar setup to NFLX, consolidated in a long triangle for months waiting for direction.
3100 is strong support, PCS 3100/3050 would be one way of participating in the earning move. Or 3100/3090 whatever the risk tolerance is.
Upside butterfly of 3300/3400/3500 also a good lotto. Nothing is guaranteed though.
Incrementally, AMZN is likely to see better comp than NFLX as all the small retailers have been wiped out and its cloud business is likely doing good in this anything digital conversion.
My other meg cap favor is GOOGL, youtube is killing it.
Good luck and mind your risk! Obviously, I am just a newbie talking loud myself and it is not any sort of advice as with all my charts.

$NFLX 500: Exploded to 565; Could AMZN follow the same path? Having missed the explosive earning move, I want to reflect if the chart had provided us with some clues but I missed.
Yes. The clues are:
1. A long rectangle box since July as the stock was being accumulated? The longer the rectangle, the larger the move, once breaking out the box.
2. A 3D Squeeze was fired and served as the launchpad for the explosive move post earnings (500 to 565) or 2X expected move.
3. STOCH/RSI is not overbought and somewhat in favor of buys.
Fundamentally, NFLX is benefiting from its pricing power as well as the Covid factor. There would be happy co-exist among the streamers still.
The message here is to pay CLOSE attention to stocks with long accumulation patterns and coupled with a squeeze (esp. the 3D).
AMZN is in a similar TA pattern so will pay close attention before earnings on Feb4.

Buy Netflix ahead of earnings tonightNetflix looks good for a buy in this accumulation pattern ahead of its earnings tonight. Accumulation periods are where price trades sideways as big institutions look to gather up shares whilst aiming not to move price too much before the explosion comes. I think thats what we have been witnessing in Netflix over the past number of weeks.
I'm not an expect in fundamentals, TA is my thing, but I think Netflix is a great buy in the middle of a pandemic while everyone is watching it in winter months. Personally I think the content of Netflix has just got better and better. Subscription fees are incredibly low and there is still room for further big earnings per share from Netflix over the coming years. I wouldn't be surprised to see a big spike up tonight to surpass all time highs.
Stop loss at the low of the flag in case we have some bearish news

FAANG RALLY SCHEDULED FOR EARNINGSVery bullish setup on FAANG which has basically gone sideways for 6 months.


NFLX Daily with 4 MA's and MACDI spent a few hours on this chart. Not because it was so confusing, but because my newborn son kept distracting me. So I was determined to get this done. Then the more I looked at it, the more I started to like it.
Here is what I am watching:
1) Target price of $530-$575 if it can hold the bottom trendline
2) The biggest concern right now is the moving averages appear to be flipping down. At the ellipse the EMA 15 30 and 50 have all come together.
3) What will this sector as a whole do this coming week?
4) $575 top resistance.
I doubt I enter Tuesday, but this is now on my watchlist for the next few weeks. I am still deciding. Trade your plan!
ONE FINAL THING. I know I haven't interacted with many on here, but I am a big fan of moving averages. And I especially love them when they line up perfectly on trend lines like the bottom. 200MA is always a good place to start.
$NFLX


NFLX 500: Earnings Play 550/500/450 Butterfly?NFLX is so old that it trades like FB chop and chop. Its offering is less attractive now given all the options out there. It is no longer a monopoly.
Not seeing a huge move in cards based on fundamental and technical.
Stock mainly in distribution. Premium sellers likely win. To hedge, will do a Put Butterfly 50 wide, centered around 500.
If the premium rich enough would also consider selling 500 Iron condor, 50 wide.

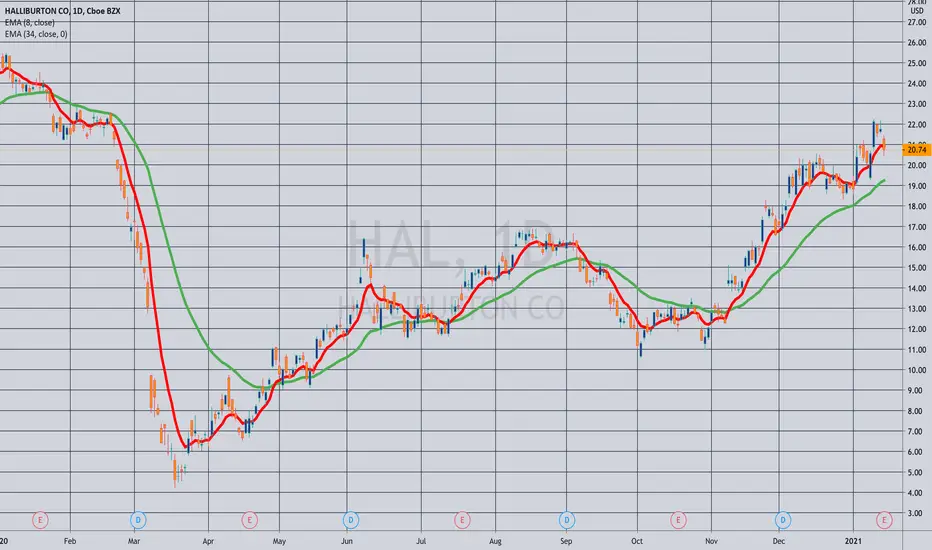
THE WEEK AHEAD: HAL, NFLX, AA, UAL EARNINGS; EWZ, XLE, SLV, IWMHIGHLY LIQUID OPTIONS SINGLE NAME EARNINGS (LISTED CHRONOLOGICALLY IN ORDER OF ANNOUNCEMENT AND SCREENED FOR >50% 30-DAY IMPLIED):
HAL (13/61/13.9%),* Tuesday, before market open
NFLX (25/50/11.3%), Tuesday, after market close
AA (18/69/15.9%), Wednesday, after market close
UAL (13/64/14.8%), Wednesday, after market close
From a bang for your buck perspective: AA ranks first, UAL, second, followed by NFLX, and HAL.
I already have a covered strangle on in UAL and don't anticipate putting on more single name risk in the IRA (which is my primary focus running into retirement), but will naturally post a play should I get into one.
EXCHANGE-TRADED FUNDS WITH >35% 30-DAY AND RANKED BY THE PERCENTAGE THE FEBRUARY AT-THE-MONEY SHORT STRADDLE IS PAYING AS A FUNCTION OF STOCK PRICE:
EWZ (18/45/10.3%)
XLE (23/42/9.7%)
SLV (25/42/9.4%)
GDX (12/38/9.2%)
XBI (18/37/8.7%)
KRE (16/36/8.7%)
EWW (15/36/7.5%)
I'm already in everything here but for KRE and EWW (the lowest bangs for your buck on the list) and the February monthly is a bit short in duration here for me (34 days) and March a tad long (62 days), so I may not do much this week in these, although going out to March with another rung in my GDX, SLV, and XBI positions isn't out of the question.
BROAD MARKET RANKED BY 30-DAY IMPLIED:
IWM (24/32/6.8%)
QQQ (22/30/6.4%)
SPY (16/24/4.8%)
DIA (13/23/4.6%)
EFA (14/20/3.8%)
In spite of the fact that IWM and/or RUT have the higher 30-day, I may look at adding a July (181 days) rung to the SPY short put ladder I have on in the IRA, targeting the strike paying at least 1% of the strike price in credit (which would currently be something like the 240), and do the kind of "opportunistic rolling" I've been doing with shorter duration rungs. (See Post Below). Although most frown upon going out this far in time, it's a way to deploy otherwise underutilized buying power that will earn something >0% while I work shorter duration setups or wait for a higher implied volatility environment and/or greater weakness. Additionally, my goals for the IRA are somewhat modest from a return on capital standpoint: I'm not looking to hit homers or be an incredibly attentive investor, opting for a once a week or even a once a month schedule of looking at things, making adjustments as appropriate, and/or taking off stuff approaching worthless that doesn't merit hanging onto due to the amount of time left in the contract.
* -- The first metric is the implied volatility rank or percentile (i.e., where the 30-day is relative to where it's been over the last 52 weeks); the second, thirty day implied; and the third, the percentage the at-the-money short straddle in the February monthly is paying as a function of stock price.

Yesterday I said very good to buyi'm saying this again. It is still good for the buy. Because it is going to in uptrend channel again. And earnings will support this stock for break the supply zone.

How much punishment (esp. >Dec29) cn Big Tech Robinhooders take?Painful underperformance (especially since three days before the new year from Dec 29) vs. the Nasdaq IXIC and the Dow DJI for those previously enamored with the Big Tech counters such as Amazon AMZN, Microsoft MSFT, Facebook FB, Netflix NFLX, and even Apple AAPL; with the possible exception of Alphabet Inc GOOG.


Nflx is the buy right nowearnings will be beaten because of the covid restrictions. And very close to the strong supports, like 200 day ma and supply zone.

Trimming NFLX here #stocksAlong with others in big tech like amzn, adbe, msft, and facebook, netflix has lagged the sp500 since May. The divergence has widened in the recent weeks enough to make me cut my position in half. We are still above the yearly moving average and above the range (rectangle) lows but most of the gains from the position put on in late November have evaporated and I don't want to see this position turn into a loser. Not sure what the reason for the divergence from the overall market is (maybe its yields- higher rates could lead to lower p/e ratios, maybe its competition) but price is telling me the only story that matters.


NFLX price would rise again!Hi every one
NETFLIX INC
because of the pandemic Netflix stocks has increase greatly and it seems that this trend would still continue!
so you can see a symmetrical triangle which means (AB=BC) and the trend is upwards so the price will increase accordingly!
Traders, if you liked this idea or have your opinion on it, write in the comments, We will be glad.
Things can change...
The markets are always changing and even with all these signals, the market changes tend to be strong and fast!!
Thank you for seeing idea .
Have a nice day and Good luck.

