📺 NFLX (12/29)-(12/15) Trade Plan 📺 Trade Safe. Remember to set SL's, leaning on bullish above 515's.
Long Holding Above 517.80's
🔸 Conservative 523-524
🔸 PT 526-527
🔸 Ideal PT 530-532
Short Breaking Below 515.35
🔸 Conservative PT 513.30-512.11
🔸 PT 510-511
🔸 PT 507.54-507
🔸 Ideal PT 504.75-500.12
Nflxshort


NFLX Long/Short?NFLX been having the same pattern for a long while now. But let the market pick the direction before entering a trade.
Bullish over 509, PT 520-525
Bearish under 491, PT 478.43-470
Still stuck in that channel wait for a break of the purple trendline for long, grey trendline for short. Also its tricky with vaccine and stim news. Who cares about NFLX now?!

Netflix Inc. analysis📈NFLX LONG D1
🛒BUY above = 494.30
🎯Target1 = 503.70
🎯Target2 = 509.50
🎯Target2 = 518.95
🛑Trailing Stop loss = 479
❌Cancel trade = 479
🙈Recommended risk = 1-2%
#NFLX #NFLXLONG #BUYNFLX
📉NFLX SHORT D1
🛒SELL BELOW = 479
🎯Target1 = 467.85
🎯Target2 = 460.95
🎯Target3 =
🛑Trailing Stop loss = 494.95
❌Cancel trade = 494.95
🙈Recommended risk = 3-5%
#NFLXSHORT #NFLXSELL

$NFLX - do or dieNASDAQ:NFLX very week after earning. It is currently in a downtrend channel finding some support. It is do or die time for $NFLX. I would be be leaning more bullish than bearish on it. If it breaks resistance, I am long.

NFLX - Targets $482 (-15%) on subscriber growth missNetflix misses on Subscriber growth number. 2.20 million vs. 3.57 million expected.
If you ask me the expectation was too high and set to disappoint.
The chart is already forming a double top and creating short them resistance to the upside.
Last time when NFLX missed subscriber growth numbers and had a Quarterly decline was Q2 2019. On these results the stock traded down -15% before going higher into Q3 2019.
We will see a similar decline on this subscriber miss. I might to try to make a move up to catch the SMA with the gap down AH before it continues to trade lower by the end of the week.
RSI will curve down with 5 straight days of selling. Hoping for some buyers will show up next 2 days to build some downside resistance day after tomorrow.
Targets $482 – 15% from previous highs. could go much lower.
Already down in AH.
NASDAQ:NFLX Always trades down after ER before moving up.
Chart looks like a coloring class. Still new at this.
Do follow and comment below for your targets on NFLX for this week.

NFLX going down. Wave 3 downtrend?With likely weaker than predicted earnings and past performance through earnings I see NFLX dropping. Once it consolidates there might be an opportunity for a brief scalp.


Short netflix NFLX is over bought and borke the bullish trend line for now it's in a trading range but expected to fall in the next few days

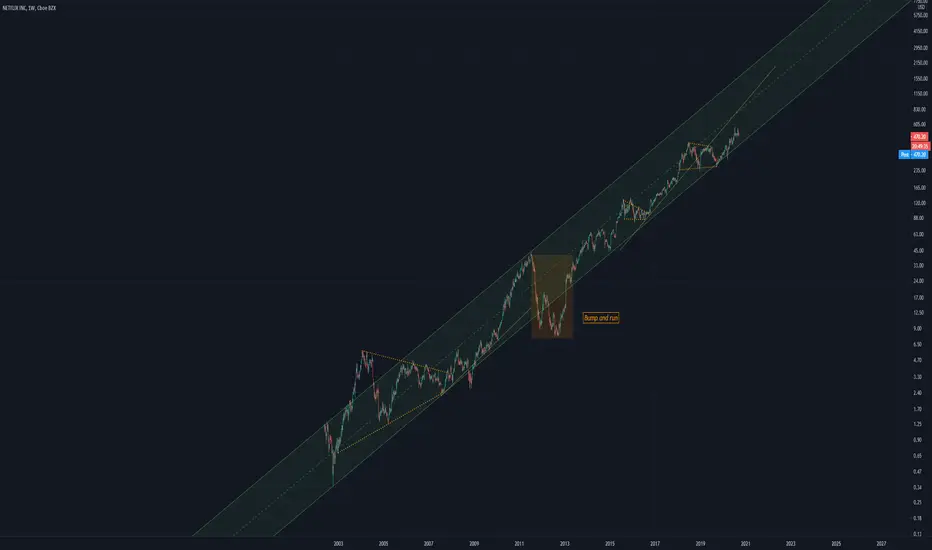
Born within a Bubble NFLXBorn during the tech bubble in 01
It makes sense that active users of Netflix would increase during quarantine
Hence I am labelling this a buy
Long term channel intact

NFLX:Massive move incoming?Last idea didnt go as planned lol, so lets give it another go.Netflix on longer timeframes looks very very bearish,with descending triangle,indicators screaming downside and election fears,im expecting it to go to 430-400 in a month-months and a half. Very risky play,basing this purely on indicators and elections.Let me know your thoughts on this one,as always happy trading and stay green!

Bear View on Netflix with Sell Zone and TargetsWhat i think will happen on the bearish view for Netflix


Evening Star and Bearish Engulfing $NFLXTwo bearish patterns appearing for $NFLX last week. The weekly shooting star should have this name challenging 426 next week.

Possible Netflix ShortIn this particular setup for some reason I see Netflix falling for a little. The possible short setup is forming.


Netflix Compression. (NFLX)🤔 Two patterns taking place as we hit major level of Resistance.
Bull Pennant or Inverse Head And Shoulders.
Price is being compresses in the green pennant formation.
Safest bet is to play the pennant breakouts to the up or the down / avoid the noise for now.
Once the break happens, next you will look to play those positions towards the green horizontal support and Resistance levels to test for trend continuation.
Cheers! 🍺
🥇MLT | MAJOR LEAGUE TRADER


NFLX Bearish Head + Shoulders + Potential Bearish Bat PatternPOTENTIAL bearish Head and Shoulders forming, as well as confluence with rejection off 1.618 fib extension + Bearish bat pattern. If the break of (B) confirms the star alignment, looking to enter short into the red zone, add on a reversal pattern confirmation, then add again on the trend line crack looking towards .318 and .682 retracement (green) for profit targets.
