Gold at a Crossroads: $100 Drop Ahead or New All-Time High?Gold is now sitting at a critical decision zone near the $3300 level — a key bank-level area. If we see a daily candle close below this level, I anticipate a minimum drop of 1,000 pips, with the first major support around the $3220–$3200 range. The $3200 level is extremely significant, and I’ll discuss its importance more in future updates if necessary.
On the flip side, if buyers step in and we get a daily close above $3300, I still believe it’s too early to jump into longs. The selling pressure remains quite obvious, and we’ve already seen multiple failed attempts to push beyond this level toward the $3500 all-time high. That tells me the orders at this level might be exhausted.
Personally, I’ll only consider a long position if we get at least a clean 4-hour candle close above $3350.
It’s going to be an exciting week ahead with high-impact data releases including ADP, Core PCE, the Federal Funds Rate — and most importantly, Friday’s NFP.
📌 Stay tuned for updates throughout the week!
Disclaimer: This is not financial advice. Just my personal opinion!!!
Nfp

GBPUSD: Sellers Are Taking ControlWelcome back to the Weekly Forex Forecast for the week of July 28 - Aug 1st
In this video, we will analyze the following FX market:
GBPUSD
GBP is weak vs USD. GU is heading lower with a bit of steam.
The Monthly and the Weekly are still bullish, but the Daily and 4H indicate weakness. I would not entertain longs until I see a bullish BOS.
Look for the CISD on the 4H in the beginning of the week, confirming sells are the way to go.
Enjoy!
May profits be upon you.
Leave any questions or comments in the comment section.
I appreciate any feedback from my viewers!
Like and/or subscribe if you want more accurate analysis.
Thank you so much!
Disclaimer:
I do not provide personal investment advice and I am not a qualified licensed investment advisor.
All information found here, including any ideas, opinions, views, predictions, forecasts, commentaries, suggestions, expressed or implied herein, are for informational, entertainment or educational purposes only and should not be construed as personal investment advice. While the information provided is believed to be accurate, it may include errors or inaccuracies.
I will not and cannot be held liable for any actions you take as a result of anything you read here.
Conduct your own due diligence, or consult a licensed financial advisor or broker before making any and all investment decisions. Any investments, trades, speculations, or decisions made on the basis of any information found on this channel, expressed or implied herein, are committed at your own risk, financial or otherwise.

XAUUSD (GOLD): Wait For The BOS! FOMC and NFP Looms!In this Weekly Market Forecast, we will analyze the Gold (XAUUSD) for the week of July 28 - June 1st.
Gold is in the middle of a consolidation. Bas time to look for new entries!
FOMC on Wednesday and NFP on Friday. Potential news drivers to move price in a decisive direction!
Wait for a break of structure (BOS) either direction before entering a new trade.
Be mindful that the Monthly is bullish, and the Weekly is neutral.
The Daily is bearish, with 3 days of data indicating so. I am leaning towards this bias, as the draws on liquidity are near and obvious.
Enjoy!
May profits be upon you.
Leave any questions or comments in the comment section.
I appreciate any feedback from my viewers!
Like and/or subscribe if you want more accurate analysis.
Thank you so much!
Disclaimer:
I do not provide personal investment advice and I am not a qualified licensed investment advisor.
All information found here, including any ideas, opinions, views, predictions, forecasts, commentaries, suggestions, expressed or implied herein, are for informational, entertainment or educational purposes only and should not be construed as personal investment advice. While the information provided is believed to be accurate, it may include errors or inaccuracies.
I will not and cannot be held liable for any actions you take as a result of anything you read here.
Conduct your own due diligence, or consult a licensed financial advisor or broker before making any and all investment decisions. Any investments, trades, speculations, or decisions made on the basis of any information found on this channel, expressed or implied herein, are committed at your own risk, financial or otherwise.

Markets face a PACKED schedule this weekThe tariff truce between the U.S. and several major trading partners is set to expire on August 1 . A deal with Japan has already been reached, but talks with the EU, Canada, and Mexico remain active.
In monetary policy, the Federal Reserve is widely expected to hold rates steady at 4.5% during its midweek meeting .
Across the border, the Bank of Canada is also expected to leave its interest rate unchanged at 2.75% . After cutting rates twice earlier this year, the BoC is seen as entering a wait-and-see phase.
In Asia, the Bank of Japan will announce its decision on Wednesday . While the BoJ isn’t expected to hike this month, recent U.S.–Japan trade progress has opened the door for policy tightening later this year.
Finally, the week concludes with the U.S. Non-Farm Payrolls report on Friday. Economists expect job gains of around 110,000 in July, down from 147,000 in June.
NAS100 - How will the stock market react to the FOMC meeting?!The index is trading above the EMA200 and EMA50 on the four-hour timeframe and is trading in its ascending channel. The target for this move will be the ceiling of the channel, but if it corrects towards the indicated support area, you can buy Nasdaq with better reward-risk.
As signs of easing global trade tensions begin to emerge, the Federal Open Market Committee (FOMC) is scheduled to meet this week. Analysts widely expect the Fed to hold interest rates steady for a fifth consecutive time. This anticipated decision comes as the U.S. President continues to push for rate cuts, persistently pressuring the Fed to adopt a more accommodative monetary stance.
So far, the Federal Reserve has kept its benchmark rate within a range of 4.25% to 4.5%. While some officials project two cuts by the end of the year, markets are waiting for the Fed’s patience to run out. According to the CME Group’s FedWatch tool, investors have priced in a 62% chance of a rate cut in the September meeting. By then, the Fed will have access to the July and August employment reports—key indicators of whether the labor market is weakening or remains resilient.
The upcoming week marks the peak of Q2 earnings season, with 37% of S&P 500 companies reporting results, including four major tech firms. In parallel, the August 1st tariff deadline for the EU and other countries is approaching, while legal challenges over existing tariffs remain ongoing.
According to a report by The Wall Street Journal, many large U.S. corporations have so far absorbed the bulk of tariff-related costs without passing them on to consumers. This strategy aims to maintain market share and avoid drawing criticism from President Trump. However, the question remains—how long can this continue?
Examples from the report include:
• General Motors paid over $1 billion in tariffs in Q2 alone without announcing any price hikes.
• Nike expects a $1 billion hit from tariffs this fiscal year and is planning price increases.
• Hasbro is working on a combination of price hikes and cost cuts to offset $60 million in tariff impacts.
• Walmart has made slight pricing adjustments (e.g., bananas rising from $0.50 to $0.54) and managed pressure through inventory reductions.
This week is shaping up to be one of the busiest on the economic calendar in recent months. A flood of key data on growth, inflation, and employment, alongside three major interest rate decisions, has markets on high alert.
On Tuesday, attention will turn to two significant reports: the Job Openings and Labor Turnover Survey (JOLTS) and the U.S. Consumer Confidence Index for July. These metrics will offer a clearer view of labor market dynamics and household sentiment heading into critical monetary policy decisions.
The most anticipated day is Wednesday. That day brings the ADP private payrolls report, the first estimate of Q2 GDP, and pending home sales data. Additionally, both the Bank of Canada and the Federal Reserve will announce rate decisions—events with the potential to simultaneously steer global market trajectories.
On Thursday, the July Personal Consumption Expenditures (PCE) price index will be released—a key inflation gauge closely monitored by the Fed. Weekly jobless claims data will also be published that day.
The week concludes Friday with two heavyweight economic indicators: July’s Non-Farm Payrolls (NFP) report, a crucial input for Fed policy decisions, and the ISM Manufacturing PMI, which offers insights into the health of the real economy.
Some economists argue that a September rate cut may be premature, and even suggest that no rate changes might occur in 2025. Analysts expect Fed Chair Jerome Powell to reiterate a data-dependent stance, consistent with previous meetings.
Still, beyond political dynamics, the July meeting holds independent significance.The Fed’s internal policy tone is gradually leaning more dovish, and subtle signals of this shift may emerge in the final statement. Given that only one meeting remains before September, if policymakers are leaning toward a rate cut then, it’s critical that the groundwork for such communication be laid now.
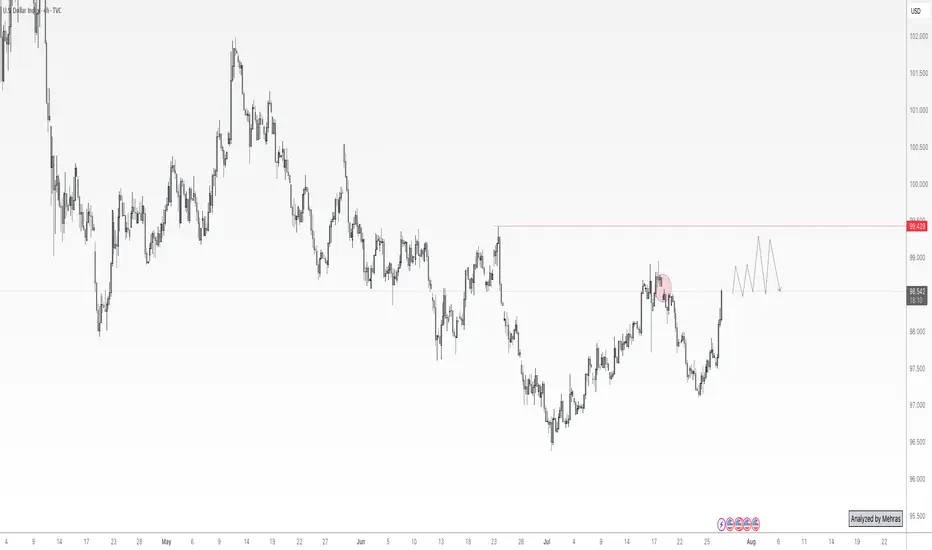
DXY at Its Most Critical Level of 2025 — Will the 100 Bank LevelThe Dollar Index (DXY), just like several other majors, is approaching a very important level. We’re now near the 100 mark, which is not only a psychological level — but also a key institutional (bank) level.
There’s also a gap zone left behind that price is about to fill. I believe the index will stay in a range over the next 1–2 days as it waits for critical data later this week — especially Wednesday’s announcements and Friday’s NFP report, which could set the tone for what’s next.
Based on current market sentiment, Trump’s remarks, Powell’s upcoming speech, and broader macro factors, I believe DXY has the potential to break above 100 and move toward 102–104, if that level is broken cleanly.
Let’s also not forget — price bounced from a monthly demand block near 96, and we’re seeing weak support across majors like EUR and Gold. That adds confluence for potential dollar strength.
📌 What do you think — is dollar strength just around the corner?
🔁 This analysis will be updated whenever necessary.
Disclaimer: This is not financial advice. Just my personal opinion.
Tariffs, Trade Deals, & Central Bank Watch: Key Week in MarketsCME_MINI:NQ1! CME_MINI:ES1! CME_MINI:MNQ1! COMEX:GC1! CME_MINI:MES1! NYMEX:CL1!
This is a significant week in terms of macroeconomic headlines, key data releases, central bank decisions, and major trade policy developments. We get numbers for growth, inflation and decision and insights into monetary policy. Combining this with ongoing trade policy developments, we have a key week which may shape how the rest of the year unfolds.
Below is a consolidated summary of the latest trade negotiations, scheduled economic releases, and policy outlooks.
US - EU Trade Deal:
• US–EU Tariffs: The US will impose a 15% tariff on most EU goods, including cars, semiconductors, and pharmaceuticals, but retain a 50% tariff on steel and aluminium with a new quota system.
• Exemptions: Zero-for-zero tariffs agreed for agriculture, aircraft parts, and chemicals; aircraft exports are temporarily exempt.
• EU Commitments: The EU will invest $600 billion in the US and purchase $750 billion in US energy, mainly LNG.
• Agriculture: The EU will lower tariffs on many US agricultural goods, though not comprehensively.
• Political Reactions: EU leaders are mixed, Germany and the Netherlands praised the deal, France called it unbalanced, and Hungary viewed it unfavorably.
• The deal is not final until it is ratified by all EU national parliaments and the EU Parliament.
China Talks: US and China expected to extend their trade truce by 90 days. US-China meeting expected in Stockholm on Monday and Tuesday. Trump to freeze export controls to secure a deal. A group of US executives will visit China for trade discussions, organized by the US-China Business Council.
South Korea Trade Talks: Korea proposes a shipbuilding partnership with the US and is preparing a trade package.
UK–US Relations: PM Starmer and Trump to meet in Scotland to discuss the UK–US trade deal implementation, Middle East ceasefire, and pressure on Russia.
Thus far, the US has announced trade deals with the UK, Vietnam, Philippines, Indonesia, Japan and The EU. Trade delegations are working to finalize deals with China, Mexico, Canada
Key Economic Data Releases:
Monday: Treasury refunding financing estimates.
Supply: 2-Year and 5-Year Note Auction, 3 & 6-Month Bill Auction
Tuesday: US Advance Goods Trade Balance, Wholesale Inventories Advance, CB Consumer Confidence, JOLTS Job Opening (Jun), Atlanta Fed GDPNow, Australian CPI Q2
Supply: 7-Year Note Auction
Wednesday: German GDP Q2, EUR GDP Q2, US ADP Non-farm Employment, US GDP Q2, Crude Oil Inventories, Chinese Manufacturing PMI
Canada: BoC Interest Rate Decision, Rate Statement, Monterey Policy Report, BoC Press Conference
US: Fed Interest Rate Decision,FOMC Statement, Fed Press Conference.
Japan: BoJ Interest Rate Decision, Monetary Policy Statement
Thursday: EU Unemployment (Jun), US PCE & Core PCE Price Index (Jun)
Japan: BoJ Press Conference
Friday: EU CPI, US NFP, Unemployment Rate, Average Hourly Earnings, ISM Manufacturing PMI, Michigan 1-Year & 5-Year Inflation Expectations.
It is also a busy earnings week. See here for a complete earnings schedule .
Markets are interpreting trade deals as positive news thus far. The dollar is strengthening.
As we previously mentioned, we anticipate no rate cuts this year as economic data proves to be resilient and inflation largely under control. WSJ also posted an article stating that most tariffs costs are being absorbed by companies due to weaker pricing power. We previously wrote about this on our blog: “ In our analysis, the inflation impact of tariffs may not show up until Q4 2025 or early 2026, as tariff threats are mostly used as a lever to negotiate deals. While effective tariff rates have increased, as Trump reshapes how tariffs are viewed, cost pass-through to consumers will be limited in Q3 2025, as companies’ front-loaded inventory helps mitigate the risks of increased tariff exposure.
So, what we have is an interesting development shaping up where, while inflation may rise and remain sticky, it is yet to be seen whether slowing consumer spending will weaken enough to the point where companies must start offering discounts, which would nullify the tariff risk to the end consumer and result in companies absorbing all tariffs. This scenario will see reduced earnings margins leading into the last quarter and early 2026. However, it will materially reduce risks of higher inflation.”
In our view, the US dollar has a higher probability to rally in the short-term i.e., Q3 as markets re-align FX rate differentials. Bond yields stabilize, Equities continue pushing higher, while Gold retraces as previously mentioned. This in our view, is what investors and participants refer to as the Goldilocks scenario. If this plays out as expected we anticipate continued strength with AI, tech, energy and defense sectors outperforming into mid- 2026.
Institutional View: Morgan Stanley
Morgan Stanley also sees no rate cuts in 2025, despite market pricing for two 25 bps cuts. They forecast more aggressive cuts in 2026 due to:
• Tariff-related inflation emerging before labor market deterioration
• Slowing US growth, as fiscal support fades
• Impact of tighter immigration policy and global trade realignment
That said, MS continues to cite longer-term risks to the dollar, including:
• Twin deficits (fiscal + current account)
• Ongoing debate around USD’s safe haven status
• USD hedging activity picking up by international investors
• Strained credibility of the Fed due to tension between Fed Chair and the US Administration
How Fed policy evolves in Q4 2025 and Q1 2026 will depend heavily on the incoming Fed Chair nominee, who is expected to replace Jerome Powell in May 2026. This nomination could significantly influence future policy direction around growth and inflation targets.

XAUUSD - Gold is in for a big week?!Gold is trading below the EMA200 and EMA50 on the 4-hour timeframe and near the bottom of its medium-term ascending channel (breakout or no break is yet fully confirmed). A correction towards demand levels would provide us with a better risk-reward buying position, and if it rises, we could consider shorting it in supply levels.
In the past week, gold experienced two distinct phases in its price movement: a strong upward trend in the first half that stalled at key resistance levels, leading the market into a more cautious mode. The latest surveys reveal a clear division among gold analysts—some foresee a bearish outlook, while others prefer to remain neutral and wait for further signals. Meanwhile, retail traders remain optimistic about gold’s short-term trajectory and emphasize the continuation of its upward trend.
Analysts at Commerzbank believe the gold market is currently directionless and searching for a clear trend. In their view, recent news around potential trade agreements has weakened demand for gold as a safe-haven asset. They have adopted a neutral stance in the short term, stating that gold prices are near their upper limit with limited room for further gains at the moment.
Conversely, some experts are confident in the continuation of gold’s bullish trend. Rich Checkan, President and CEO of Asset Strategies International, declared: “Gold is in an uptrend. Today’s pullback is setting the stage for next week’s rally. If the Federal Open Market Committee (FOMC) meets expectations and holds rates steady, both gold and silver will keep climbing. And if the Fed exceeds expectations by cutting rates, we’ll see an even stronger surge in both metals. Either way, the direction is upward.”
At the same time, other analysts remain cautious about the trend’s sustainability. Mark Leibovit, editor of VR Metals/Resource Letter, warned that the U.S. dollar may be forming a bottom, which could exert downward pressure on gold and calls for increased caution from investors.
Despite continued political pressure from President Trump, the Federal Reserve is not expected to lower interest rates at the upcoming meeting. Central bankers have stated that they want to observe the economic effects of tariffs before making any adjustments. Although some Fed officials are moving away from the “wait and see” approach, analysts still believe the Fed will leave rates unchanged this week—though markets are closely watching for any signals suggesting that rate cuts could begin as early as September.
Meanwhile, China’s gold consumption in the first half of 2025 declined, though the drop was less severe than in previous years. The primary reason was increased demand for gold as a safe-haven investment, which partially offset reduced jewelry purchases due to high prices.
According to data from the China Gold Association, a government-affiliated body, gold consumption fell by 3.54% year-over-year in the first half of the year to 505,205 tons. In comparison, Q1 saw a 5.96% annual decline, and the same period in 2024 recorded a 5.61% drop.
The association stated that growing geopolitical tensions and ongoing economic uncertainty have strengthened gold’s role as a store of value and safe asset, prompting a significant rise in private investment in bars and coins.
Gold bar and coin purchases—a key indicator of safe-haven demand—surged by 23.7% to 264,242 tons, accounting for 52% of total consumption and overtaking jewelry as the largest consumption segment. Meanwhile, gold jewelry demand fell by 26% to 199,826 tons, reflecting weakened consumer interest due to high prices.
Still, the association noted that lighter jewelry products with unique designs and higher value-added features remain popular. Additionally, official data from the People’s Bank of China (PBOC) showed that the central bank increased its gold reserves in June for the eighth consecutive month.
On the supply side, domestic gold production fell by 0.31% year-over-year to 179,083 tons in the first half of the year, while output from imported sources rose by 2.29% to 76,678 tons. Altogether, China’s total gold production grew by 0.44%, reaching 252,761 tons.

Bitcoin - Will Bitcoin continue its upward trend?!Bitcoin is above the EMA50 and EMA200 on the four-hour timeframe and is in its medium-term ascending channel. Bitcoin’s current upward momentum has the potential to reach its previous ATH. If it corrects, you can look for Bitcoin buying opportunities from the identified support area, which is also at the intersection of the bottom of the ascending channel.
If this support is lost, the decline will continue to around $113,000, where you can again buy Bitcoin with a better risk-reward ratio.
It should be noted that there is a possibility of heavy fluctuations and shadows due to the movement of whales in the market, and capital management will be more important in the cryptocurrency market. If the downward trend continues, we can buy within the demand range.
Last week, a group of U.S. senators released an initial draft of a new legislative proposal aimed at creating a clearer regulatory framework for the digital asset industry in the United States. The proposal builds on the recently passed CLARITY Act in the House of Representatives and focuses on strengthening market structure, enhancing consumer protection, and expanding regulatory oversight.
According to the senators, the bill addresses key areas such as banking, disclosure requirements, securities classification, and measures to combat illicit financial activity.Senator Lummis, in highlighting the proposal, stressed the urgent need for legal clarity to support the growth of this emerging industry within the U.S. The legislation aims to facilitate the integration of digital assets into banking services and would allow financial holding companies to provide services based on such assets.
The draft also includes measures aimed at preventing illegal financial activities, such as improving regulatory standards and boosting inter-agency cooperation to identify and block misuse of digital assets.
In addition, the senators have issued a “Request for Information” (RFI) to support the legislative process and have invited the public to share their opinions on more than 35 related topics, encouraging broader engagement in shaping the bill.
Meanwhile, in Asia, Japan-based firm Metaplanet announced that it has added 780 BTC worth $93 million to its digital holdings. This acquisition brings the company’s total Bitcoin reserves to 17,132 BTC, valued at roughly $2 billion. Metaplanet is fast becoming one of the largest institutional Bitcoin treasuries in the region—potentially serving as a model for other firms across Asia.
At the same time, publicly traded U.S. companies have significantly ramped up their Bitcoin holdings. By the end of Q2 2025, these companies had accumulated nearly 900,000 BTC, marking a 35% increase over the previous quarter. This surge, driven primarily by firms such as MicroStrategy, has sent demand for Bitcoin soaring.
Some analysts believe that the $1.5 trillion in free cash flow held by companies within the S&P 500 index could spark a new wave of institutional Bitcoin buying.
Looking ahead, the upcoming week is packed with critical U.S. economic data. Alongside the Non-Farm Payroll (NFP) employment report and inflation metrics via the Personal Consumption Expenditures (PCE) index, the initial estimate for Gross Domestic Product (GDP) and various other indicators will be released—potentially offering a clearer picture of where the U.S. economy is heading.
The Federal Reserve remains primarily focused on inflation and labor market dynamics. June CPI data indicated signs of inflationary pressure caused by tariffs. If Thursday’s PCE report—particularly its core reading—confirms a similar trend, the Fed may decide against a rate cut in September. As a result, financial markets have priced in only about a 65% chance of a rate cut at that meeting.

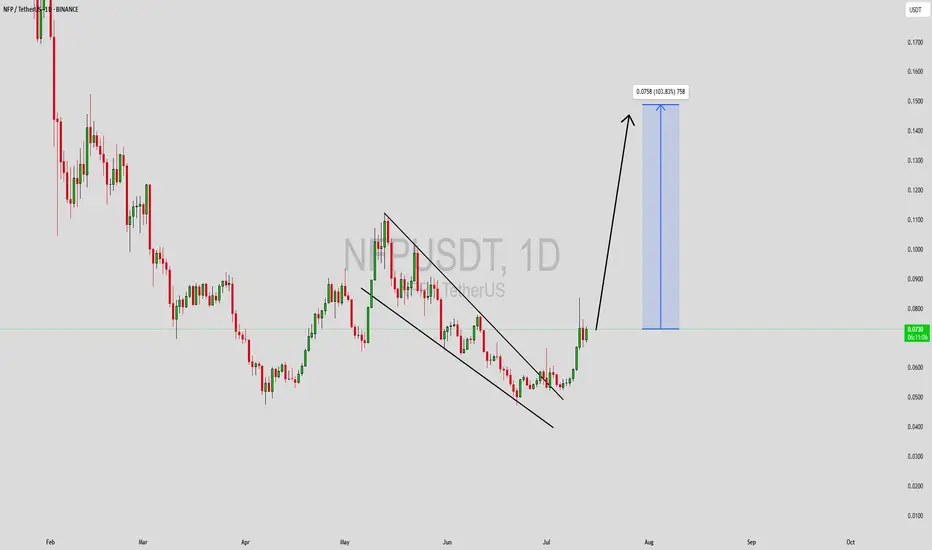
NFPUSDT Forming Descending ChannelNFPUSDT is starting to attract significant attention as it shows signs of reversing its downward trend with a promising technical setup. This crypto pair has recently broken out of a descending channel, indicating that selling pressure might be subsiding while buyers are stepping in. The price structure suggests a clear path for a potential bullish continuation, and the projected target hints at a strong gain of around 90% to 100%+. Technical traders are closely watching this level for a confirmed breakout and a sustained rally.
The volume on NFPUSDT remains good, showing that liquidity is healthy and there’s active participation from traders and investors. This is a critical factor in validating the breakout — when volume aligns with price action, the odds of a strong move increase. Many crypto traders rely on these confirmation signals to enter early positions, capturing the momentum as it picks up. With the market sentiment slowly shifting, NFPUSDT could see an influx of new interest in the coming weeks.
Investors are increasingly taking interest in this project, not just from a technical perspective but also due to its fundamentals and community engagement. As the crypto market looks for solid setups in a sea of volatility, pairs like NFPUSDT stand out for their clear patterns and realistic upside potential. Keep an eye on support levels holding firm and whether the breakout candle closes above resistance with strength.
✅ Show your support by hitting the like button and
✅ Leaving a comment below! (What is You opinion about this Coin)
Your feedback and engagement keep me inspired to share more insightful market analysis with you!
NFP Bears gathering their troops? or will the Bulls stampede...The past 9 days have been quite interesting for the EUR/USD which has been relentless. Price has been rising like a helium balloon let loose at the park...
Bulls have clearly been in control, not only the past 9 days but since the beginning of the year with the exception of the strong pullback in April & May only to bounce for another 700 pip run.
I am totally USD bearish across the board as I have been mentioning in my analysis videos for the past few months but like all macro moves, we always have pullbacks along the way and that is why I have been shorting the EUR/USD back from 1.1500+ - 1.1700+
I've given this a lot of room to breathe, more than usual but considering the following technical setup, I'm willing to give the Bears some leeway and potentially show me they'll come through.
•Rising Broadening pattern (Where two trendlines start close together only to divergence and expand) - This is a bearish pattern.
•Negative Divergence on the MACD, Linear Regression & the RSI.
•Price has made a run to the yearly R3 pivot level. (Rare extension)
•Last daily candle is a hanging man candlestick (Reversal candle)
•Weekly chart has the EUR/USD at the upper band of a polynomial regression channel which calculates for price extremities in the market.
There are a few more setups as well but it's too much to describe here and I'd have to show it in a video (Which I plan to do over the weekend)
With all of that said... It could all fail lol but seriously speaking... You just can't ask for a better probabilistic setup so whatever happens during NFP... happens.
Aside from the technical aspect... I know yearly R2 around 1.1600 was a hotspot for shorts because divergence was at the early stages and taking a short there wouldn't have been a bad idea but we know institutions are in play as well, so above 1.1600 could have been a huge area to run stop losses and margin calls before a potential reversal.
250 pips would be enough to run a large pool of stops and liquidation.
IF price is going to reverse here during NFP, I believe late longs and breakout/pullback traders are going to try and buy at the trendline at 1.1660ish but it wont hold and trap them on the other side of the trade.
Under that, I can see us pulling back towards 1.1200ish...
If the Bears give up and price continues to climb... the original macro target may very well be under way which was 1.2000 - 1.2200 (Based on a Monthly and 3-Month chart analysis)
As of this writing the EUR/USD is pretty much completely flat which is expected before the NFP fireworks ahead of July 4th.
We'll see what happens tomorrow morning! buckle up!
As always, Good luck and Trade Safe! See you post NFP.

THE KOG REPORT - Update & NFP analysis End of day update from us here at KOG:
We managed to get the move into the red box we wanted which should have been a enough for the day. However, the levels were so clean during NY that we managed to get another decent trade into the Excalibur target to complete the day.
With NFP tomorrow and a US holiday on Friday, we're going to share our levels and view but due to unforeseen circumstances, I won't be around for the rest of the week to see it through.
We've added the updated red boxes, the key levels and the potential move if they break. So far, we've had a good week, so these levels are simply for reference and unless there is a clean set up, our traders will stay away until Monday.
Red boxes:
Break above 3350 for 3355, 3362, 3373, 3375 and 3390 in extension of the move
Break below 3335 for 3320, 3316, 3310. 3306, 3298 and 3285 in extension of the move
The week so far:
KOG’s bias for the week:
Bullish above 3250 with targets above 3278✅, 3285✅, 3297✅ and above that 3306✅
Bearish below 3250 with targets below 3240, 3232, 3220 and below that 3212
RED BOX TARGETS:
Break above 3275 for 3279✅, 3285✅, 3289✅ and 3306✅ in extension of the move
Break below 3260 for 3255, 3251, 3240 and 3235 in extension of the move
As always, trade safe.
KOG

EUR/USD: A Perfect Storm for BullsThis is a high-conviction long setup based on a powerful combination of macroeconomic divergence and a confirmed multi-year technical breakout.
The Non-Farm Payrolls report has now been released, and the resulting price dip has created what I believe is an ideal entry opportunity to align with the dominant bullish trend.
The Fundamental Why 📰
NFP Aftermath: Yesterday's NFP report was a mixed bag that ultimately reinforces the case for Fed rate cuts. The headline number beat expectations, causing an initial USD rally and a dip in EUR/USD. However, the underlying details like wage growth were soft. Crucially, the market continues to price in a 96% probability of a Fed rate cut by September, a figure that was unchanged by the data. The core driver of USD weakness—a dovish Fed—remains firmly intact.
Resilient EUR 🇪🇺: In contrast, the ECB has signaled it is at or near the end of its easing cycle. Economic data from core Eurozone countries is stabilizing, providing the Euro with relative strength.
Risk-On Sentiment 💹: The broader market remains in a "risk-on" mood, which is typically negative for the safe-haven USD. Gold is soaring and equities are near all-time highs, confirming the anti-dollar flow.
The Technical Picture 📊
The Secular Breakout 🚀: The most significant event is the breakout of a decade-long downtrend resistance line. This is a major structural shift. The pair has also achieved a monthly and quarterly close above the critical 1.1500 handle, turning a historic resistance level into a new support floor.
The Impulsive Uptrend 🌊: On the 4-hour chart, the price is in a clear ascending channel. The post-NFP dip represents a healthy correction within this uptrend, bringing price back toward key support.
Key Levels 🔑:
Support Zone: The dip has brought price directly into the key support confluence between 1.1700 and 1.1760, making this an ideal area to enter long.
Resistance Zone: Major resistance still sits at 1.1900, making it a prudent take-profit target.
Strategy & Risk Management 🧠
The stronger-than-expected NFP headline has provided the exact pullback this strategy was designed for. The dip presents a prime opportunity to buy into the dominant uptrend at a more favorable price. Instead of chasing the market, we are now positioned to enter on a technically sound correction.
Good luck, and trade safe!
Trade Parameters ✅
Pair: EUR/USD
Direction: Long / Buy 🟢
Entry Type: Limit Order
Entry Price: 1.1745
Stop-Loss: 1.1685 (60 pips) 🔴
Take-Profit: 1.1895 (150 pips) 🎯
Risk/Reward Ratio: 2.5 : 1

Gold Setup for July 3th: Don’t Get Caught in the Liquidity Net🌙 Good evening, sniper — lock in, load up, and let’s dance with Thursday’s chaos 💣
🌍 Macro & Geopolitical Pulse
Thursday’s setup is not for amateurs:
🔸 Non-Farm Employment Change
🔸 Unemployment Rate
🔸 Initial Jobless Claims
🔸 ISM Services PMI
🔸 Factory Orders
Add to that:
• A Fed still talking tough on rates
• Geopolitical flare-ups in the Black Sea and Middle East
• Gold trading deep into premium…
💡 This is where markets hunt weak hands, then flip direction without mercy.
We don’t chase candles. We wait for exhaustion. Then we execute.
🎯 Bias Snapshot (D1 → H4 → H1)
• Daily closed bullish but deep into old CHoCH + OB
• H4 printed HHs, but structure now presses into stacked supply
• H1 shows momentum fading — RSI divergence + weakening push
📌 Core bias: Still bullish — but every pip above 3360 is loaded with risk.
If 3380 fails to break cleanly, expect rejection.
If it breaks — the market likely wants full liquidity above 3400.
🗺️ Battlefield Zones
🟢 Buy Zone #1 – 3310 to 3320
The sniper’s discount pullback: Fibo 38.2%, M30 OB, EMA 50, and clean imbalance.
Wait for news spike + bullish confirmation to go long.
🟢 Buy Zone #2 – 3285 to 3295
The deep reaction zone.
Fibo 61.8% + OB + gap. Enter only on violent wick and rejection — but RR is exceptional.
🟡 Flip Zone – 3334 to 3340
This is where momentum flips:
• Hold above = continuation toward premium
• Break below = bearish reversal unlocked
No entries here — this is your compass, not your trigger.
🔴 Sell Zone #1 – 3357 to 3366
Classic CHoCH retest. H1/H4 OB with layered liquidity.
If price rejects here on post-news spike — short it back toward the flip.
🔴 Sell Zone #2 – 3387 to 3395
Top-of-range sweep.
If gold blows through zone 1, this becomes liquidity trap central.
Wait for rejection wick + bearish PA confirmation.
🔴 Sell Zone #3 – 3410 to 3420
The final premium kill zone.
This is where the market finishes stop-hunting every breakout buyer.
Fibo extension 1.272–1.618 hits here. If we wick this zone and stall — sniper short back to 3380–3366.
⚔️ Execution Blueprint
Wait for news to trigger the chaos — early entries are a donation.
Short 3357–3366 on exhaustion → target flip zone.
If price overextends into 3387–3395, get ready for the reversal play.
Extreme spike to 3410–3420? That’s your killshot short — ride it back down.
If price retraces into 3310–3320, it’s your safe sniper long.
Panic into 3285–3295? Deep long entry, only with confirmation.
Watch the flip zone (3334–3340) — above = bullish bias holds; below = bears back in control.
🎯 No guesswork. No hope. Just precision. Wait, confirm, and strike.
💬 Let’s stay sharp tomorrow — market will offer clean setups, but patience and clarity are key.
If this plan helped, drop a comment or share your thoughts below.
👉 Follow GoldFxMinds for daily sniper-entry plans crafted with precision.
Smash that🚀🚀🚀 if this plan sharpened your edge.
📝 You already know — we don’t guess, we execute. 🦅
Good night, snipers 💛
⚠️ Disclosure
I’m part of TradeNation’s Influencer Program and use their TradingView charts for analysis & educational content.


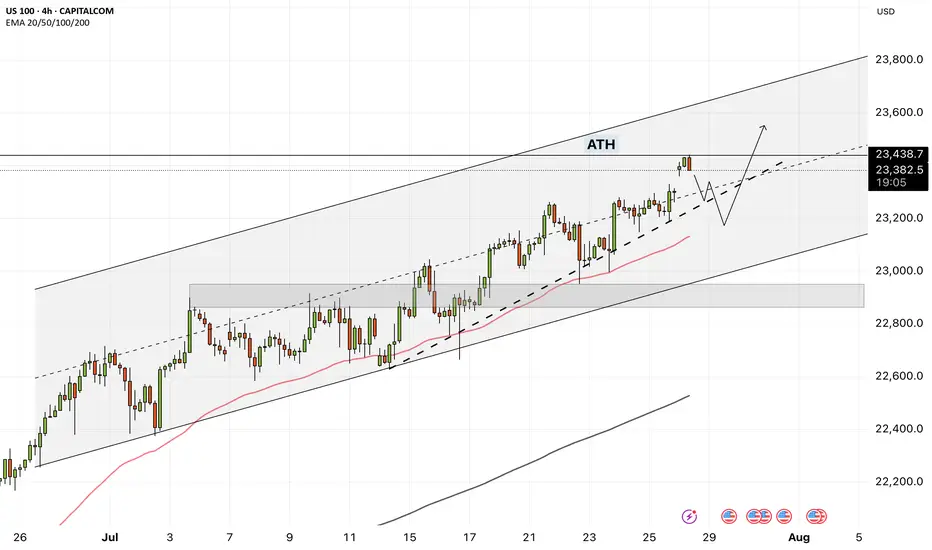
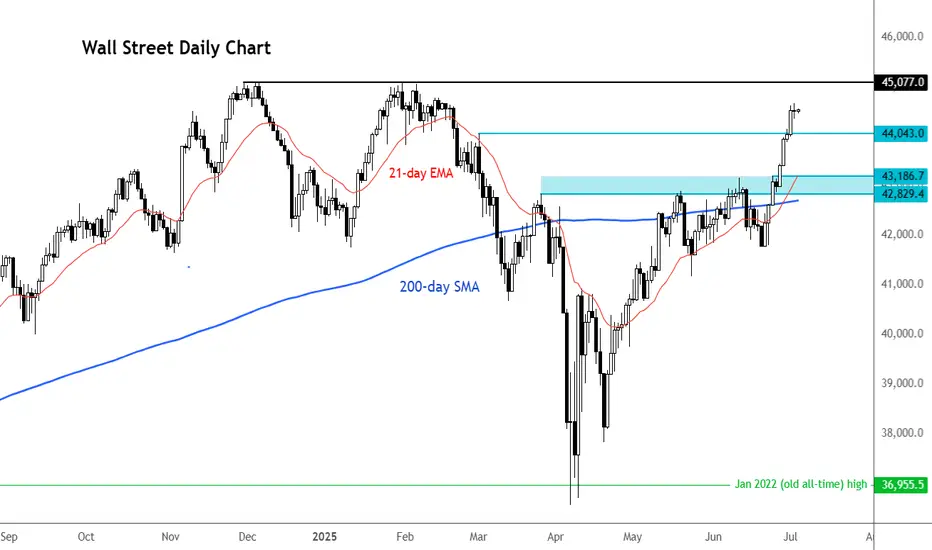
Can Dow hit new highs?While the likes of the S&P 500 and Nasdaq 100 are already record highs, the Dow has not achieved that target yet. It continues to make higher highs and higher lows, and the momentum seems to be getting stronger. Soon, it may even flirt with fresh all-time highs, as investors ride the tailwinds of a robust rally that kicked off in early April. There have been a few catalysts behind this rally. First, it was Trump hitting pause on reciprocal tariffs; then, a wave of optimism washed over markets following a sudden de-escalation in the Middle East. The bulls took charge, and markets haven’t looked back since. But with 4 July celebrations on the doorstep and Wall Street due to close at 1pm NY time, today’s shortened session has a singular focus: the all-important US non-farm payrolls report. Will we have enough time to see the Dow march to new highs? The key levels are marked on the chart.
By Fawad Razaqzada, market analyst with FOREX.com
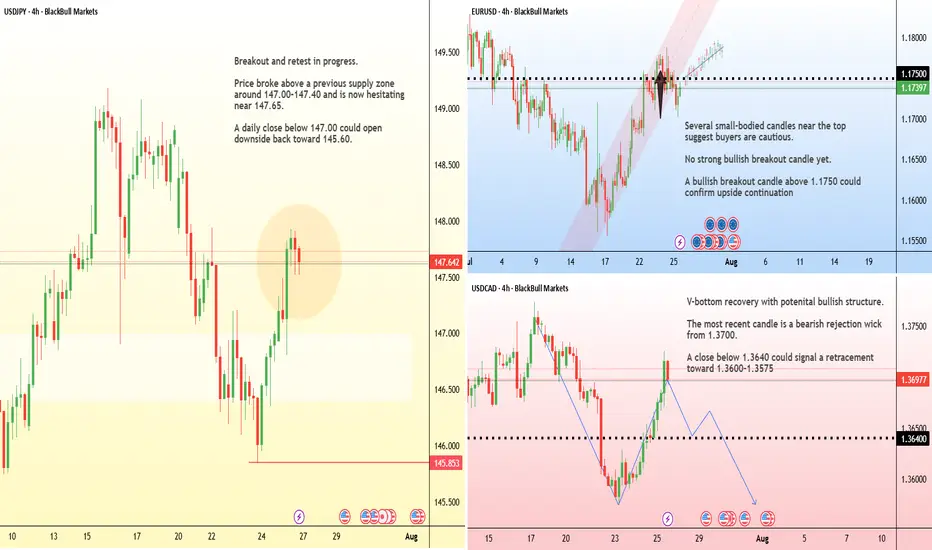
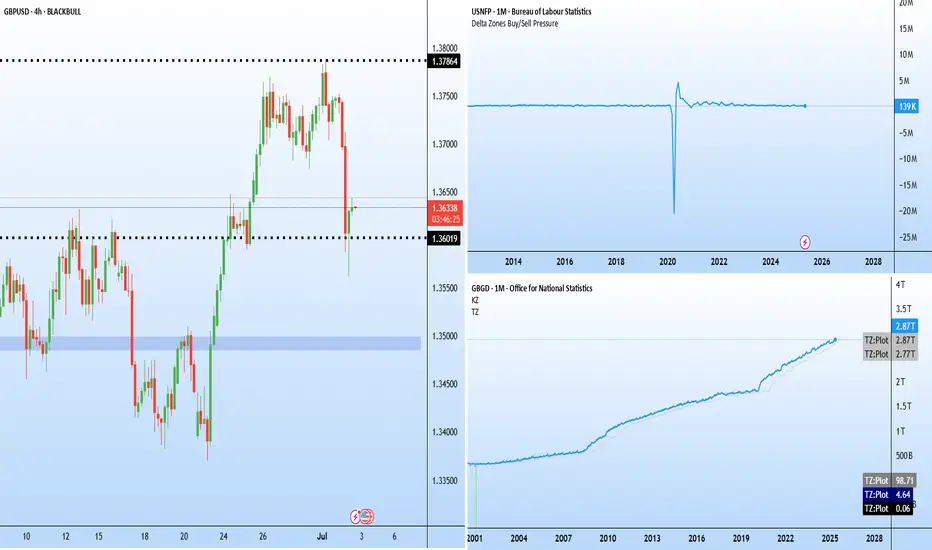
Jobs vs politics: GBPUSD caught in crossfire Two major stories are developing on either side of the Atlantic.
ADP reported a 33 k fall in June private payrolls (consensus +95 k). It is the third straight miss and sets the tone for Thursday’s early Non-Farm Payroll (NFP) release, brought forward because of the 4 July holiday.
In the UK, speculation is growing around the position of Chancellor Rachel Reeves after an emotional appearance in Parliament. Prime Minister Keir Starmer declined to confirm whether she would remain in the role, sparking questions over the government’s fiscal direction.
The political uncertainty helped accelerate the sell-off in GBPUSD, which has fallen sharply from recent highs near 1.38. The latest candles show a long lower wick around 1.3600, indicating that buyers are attempting to defend the area. If this support fails to hold, the next downside target lies near 1.3485–1.3500, which acted as a base for the late-June rally.
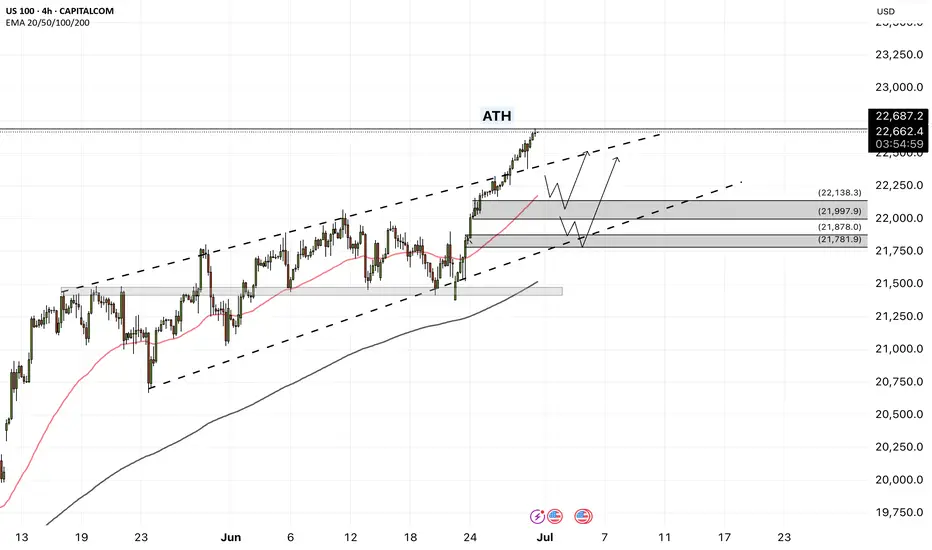
NAS100 - The stock market is breaking the ceiling!The index is above the EMA200 and EMA50 on the four-hour timeframe and is trading in its medium-term channels. If it does not increase and corrects towards different zone, it is possible to buy the index near the reward.
Following a strong rally in U.S.equities, the S&P 500 and Nasdaq indices both achieved new all-time highs on Friday. It marks the first time since February that the S&P 500 has surpassed its previous peak, while the Nasdaq entered fresh price territory for the first time since December.
Despite ongoing market focus on economic data and the Federal Reserve’s interest rate policy path, the simultaneous surge in both indices reflects a renewed appetite for risk in the stock market—an appetite that has been accelerating since mid-April, especially in tech stocks.
In contrast, the Russell 2000 index, which tracks small-cap U.S. companies, still remains significantly below its prior high. To return to its October levels, it would need to rise over 13.5%. However, Friday’s 1.7% gain suggests capital is beginning to flow more broadly into underrepresented sectors.
Analysts argue that a strong breakout in the Russell 2000 could signal a broader rotation toward increased risk-taking—possibly driven by optimism over future rate cuts, easing inflation, and improved business conditions in the second half of the year.
Now that the S&P 500 has reached new highs and the Nasdaq has joined in, attention turns to the Russell 2000. If it begins to accelerate upward, markets could enter a new phase of sustained bullish momentum.
Following a week focused on gauging U.S. consumer spending strength, the upcoming holiday-shortened week (due to Independence Day) will shift attention to key employment and economic activity data.
On Tuesday, markets await the ISM Manufacturing PMI and the JOLTS job openings report. Wednesday will spotlight the ADP private employment report, and Thursday—one day earlier than usual due to the holiday—will see the release of several crucial figures, including the Non-Farm Payrolls (NFP), weekly jobless claims, and the ISM Services Index.
Currently, investor reaction to Donald Trump’s tariff commentary has been minimal. Market participants largely believe that any new tariffs would have limited inflationary effects and that significant retaliation from trade partners is unlikely.
Friday’s PCE report painted a complex picture of the U.S. economy. On one hand, inflation remains above ideal levels; on the other, household spending is showing signs of fatigue—a combination that presents challenges for policymakers.
Inflation-adjusted personal consumption fell by 0.3%, marking the first decline since the start of the year and indicating a gradual erosion of domestic demand. While wages continue to rise, their impact has been offset by declining overall income and reduced government support. To maintain their lifestyle, households have dipped into their savings, driving the personal savings rate down to 4.5%—its lowest level this year.
On the inflation front, the core PCE price index—the Fed’s preferred inflation gauge—rose 2.7% year-over-year, slightly above expectations. Monthly inflation also increased by 0.2%. Although these figures appear somewhat restrained, they remain above the Fed’s 2% target, with persistent price pressures in services—particularly non-housing services—still evident.
Altogether, the data suggest the U.S. economy faces a troubling divergence: weakening household income and consumption could slow growth, while sticky inflation in the services sector—especially under a potential Trump tariff scenario—could limit the Federal Reserve’s ability to cut interest rates.
ETH HIT THE LIKE TO MANIFEST THISETH/USD is teasing the breakout zone again... 👀
Are we finally ready for liftoff, or is it another fakeout? 🚀🔄
The chart’s looking spicy, and the energy feels right. 🌌
Hit that like to manifest the pump — we’re in this together. 💎🙏
Let’s speak green candles into existence! 📈✨
#ETH #Ethereum #CryptoVibes #ManifestMoneyMoves #ETHUSD #ToTheMoon"

GOLD → Correction to 3275FX:XAUUSD and medium-term outlook: Friday's strong unemployment data strengthened the dollar and triggered a sell-off in gold. Money is temporarily flowing out of the metal and into currencies and the stock market...
Technically, gold is still in a bullish phase on the global timeframe. Logically, the situation is more reminiscent of a countertrend correction of the zone of interest before continuing growth.
Despite the rise in the DXY after Friday's news, the dollar is still under pressure from Trump, who is pushing for an early interest rate cut. This move could significantly shake the market (dollar down, gold up)
Locally, on the hourly XAUUSD timeframe, we can clearly see how the price is breaking out of the uptrend, thereby triggering a downward impulse.
Resistance levels: 3325, 3343
Support levels: 3303, 3275
The liquidity level of 3300 could act as a magnet for the price, from which a correction to the resistance of the range of 3325 could form (liquidity hunt), but due to the change in the fundamental background, gold may continue its correction to 3275 (support zone) before a possible continuation of growth.
Best regards, R. Linda!

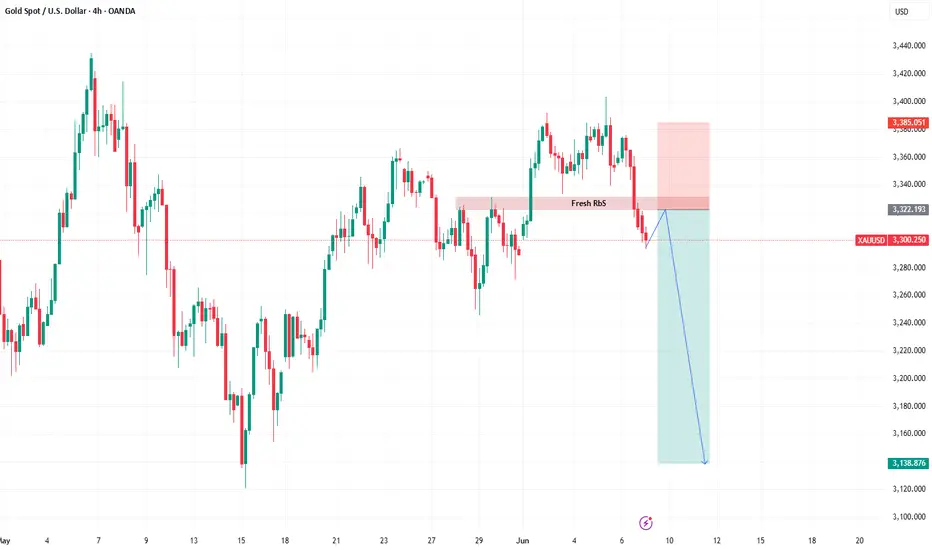
XAUUSD after NFPBased on chart
Price already break the RbS area
So for now the plan is to wait the price to retest the RbS area then drop
GBP/USD Is This the Last Dip Before 1.37?🔹 1. Price Action & Technical Structure (Weekly & Daily Charts)
Price has broken above the ascending channel highlighted on the weekly chart.
The 1.3545 area is currently acting as dynamic resistance — a weekly close above it is crucial to confirm a breakout.
Below, we find a bullish order block (demand zone) around 1.3340 – 1.3280, aligning with the 0.5 Fibonacci level.
RSI is neutral, showing no bearish divergence at the moment.
🔹 2. COT Report (Commitment of Traders)
USD Index:
Non-commercial traders: +823 new longs, +363 new shorts → Neutral to bullish positioning.
Commercials remain net short, indicating short-term USD strength potential.
EUR FX (inverse proxy for USD):
Significant reduction in speculative long positions → Less bullish pressure on the Euro, favoring USD strength.
🔹 3. Sentiment
67% of retail traders are short GBP/USD vs. 33% long.
This is a bullish contrarian signal, suggesting potential continuation toward the 1.36–1.37 zone.
🔹 4. Seasonality
Historically, June tends to be bearish for GBP/USD over the past 5–10 years.
However, the first 10 days of the month often start with bullish momentum before correcting in the second half.
🔹 5. Economic Calendar
Today: Construction PMI (GBP), ECB Press Conference (EUR), Unemployment Claims (USD).
Tomorrow: High potential volatility across all USD pairs.
Watch out — upcoming macro data may strongly impact breakout confirmation.
🔹 6. Operational Outlook
Primary Bias: Neutral/Bullish with potential for a technical pullback.
📍 Key Levels:
Resistance: 1.3545 – 1.3593 (Supply zone + 0.0 fib)
Support: 1.3340 – 1.3280 (OB + 0.5/0.618 fib)
🧠 Scenario 1 – Bullish Continuation:
Retest of 1.3340 → long targeting 1.3590 / 1.3680
Confirmation on daily close above 1.3550
🔻 Scenario 2 – Bearish Retracement:
Rejection below 1.3550 + USD macro strength → drop toward 1.3280
If that breaks → extended move to 1.3170 / 1.3150

THE KOG REPORT - NFPQuick one today as we haven't had much time to put together the report.
Instead, the red box levels are shared below and the extreme red boxes are on the chart.
We have key level 3365 which needs to break as shown and key level 3345 which needs to break downside.
RED BOX TARGETS
Break above 3365 for 3366, 337, 3385, 3390, 3406 and 3420 in extension of the move
Break below 3350 for 3345, 3336, 3329, 3320, 3310 and 3298 in extension of the move
As always, trade safe.
KOG
