Markets eye US, Canada job reports, US dollar steadiesThe Canadian dollar has taken a break after an impressive three-day rally, in which the currency climbed about 2%. In the European session, USD/CAD is trading at 1.4148, up 0.39%. On Thursday, the Canadian dollar touched 140.26, its strongest level since December.
The hottest financial news is understandably the wave of selling in the equity markets, but there are some key economic releases today as well. The US and Canada will both release the March employment report later today.
The US releases nonfarm payrolls, with the markets projecting a gain of 135 thousand, after a gain of 151 thousand in February. This would point to the US labor market cooling at a gradual pace, which suits the Federal Reserve just fine. The Fed will also be keeping a watchful eye on wage growth, which is expected to tick lower to 3.9% y/y from 4.0%. The unemployment rate is expected to hold at 4.1%.
The employment landscape is uncertain, with the DOGE layoffs and newly-announced tariffs expected to dampen wage growth in the coming months. Canada's employment is expected to improve slightly to 12 thousand, after a negligible gain of 1.1 thousand in February. Unemployment has been stubbornly high and is expected to inch up to 6.7% from 6.6%.
US President Donald Trump's tariff bombshell on Wednesday did not impose new tariffs on Canada, but trade tensions continue to escalate between the two allies. Canada said it would mirror the US stance and impose a 25% tariff on all vehicles imported from the US that do not comply with the US-Canada-Mexico-Canada free trade deal. The US has promised to respond to any new tariffs against the US, which could mean a tit-for-tat exchange of tariffs between Canada and the US.
USD/CAD has pushed above resistance at 1.4088 and 141.26. The next resistance line is 1.4170
1.4044 and 1.4006 are the next support levels
Nfp

Markets eye US, Canada job reports, US dollar steadiesThe Canadian dollar has taken a break after an impressive three-day rally, in which the currency climbed about 2%. In the European session, USD/CAD is trading at 1.4148, up 0.39%. On Thursday, the Canadian dollar touched 140.26, its strongest level since December.
The hottest financial news is understandably the wave of selling in the equity markets, but there are some key economic releases today as well. The US and Canada will both release the March employment report later today.
The US releases nonfarm payrolls, with the markets projecting a gain of 135 thousand, after a gain of 151 thousand in February. This would point to the US labor market cooling at a gradual pace, which suits the Federal Reserve just fine. The Fed will also be keeping a watchful eye on wage growth, which is expected to tick lower to 3.9% y/y from 4.0%. The unemployment rate is expected to hold at 4.1%.
The employment landscape is uncertain, with the DOGE layoffs and newly-announced tariffs expected to dampen wage growth in the coming months.
Canada's employment is expected to improve slightly to 12 thousand, after a negligible gain of 1.1 thousand in February. Unemployment has been stubbornly high and is expected to inch up to 6.7% from 6.6%.
US President Donald Trump's tariff bombshell on Wednesday did not impose new tariffs on Canada, but trade tensions continue to escalate between the two allies. Canada said it would mirror the US stance and impose a 25% tariff on all vehicles imported from the US that do not comply with the US-Canada-Mexico-Canada free trade deal. The US has promised to respond to any new tariffs against the US, which could mean a tit-for-tat exchange of tariffs between Canada and the US.
USD/CAD has pushed above resistance at 1.4088 and 141.26. The next resistance line is 1.4170
1.4044 and 1.4006 are the next support levels

NFP + tariffs = market chaos? In addition to tariff rumors, reports, and retaliations, this week’s Nonfarm Payrolls (NFP) could add even more volatility to markets.
Gold continues to hit record-high after record-high (best quarterly performance since 1986), could be the most important asset to watch.
The market consensus expects the US economy to have added 128,000 jobs in March, down from February’s 151,000.
Danske Bank is more cautious, perhaps responding to Consumer confidence deteriorating to its lowest level since 2013, projecting just 110,000.
Trading Economics is even more bearish, forecasting an increase of only 80,000 jobs. What do they know that others don’t? If they're right, markets may not be priced for it.

Surging yen hits 5-month high, wage data mixedThe Japanese yen has started the week with strong gains. In the European session, USD/JPY is trading at 147.07, down 0.766 on the day. Earlier, the yen strengthened to 146.72, its best level since Oct. 4, 2024.
Japan's wage data for January was mixed. Base pay for Japanese workers jumped by 3.1% y/y but more importantly, inflation-adjusted real wages declined by 1.8%. This follows two consecutive months of gains and signals that inflation has outpaced growth.
The wage report was released just days before the end of annual wage negotiations at Japan's largest companies. The largest labor union in Japan is demanding large wage hike of 6% and the Bank of Japan wants to see a strong rise in wages in order to keep inflation sustainable at the 2% level.
The BoJ has urged companies and workers to reach a deal that significantly raises wages. The central back meets next week and is widely expected to keep interest rates unchanged. Still, the Bank has signaled it plans to continue raising rates during the year.
In the US, nonfarm payrolls rose to 151 thousand in February, up from a downwardly revised 125 thousand in January but shy of the market estimate of 160 thousand. The unemployment rate rose to 4.1% from 4%. Wage growth eased to 0.3% m/m from a revised 0.4% in January, in line with expectations. Annualized, wages ticked higher to 4%, up from a revised 3.9% in January but below the market estimate of 4.1%.
The employment report was decent but the threat of US tariffs continues to cloud the economic outlook. If trade tensions escalate, the Federal Reserve may have to adjust its rate path, depending on how tariffs affect inflation and growth.
USD/JPY has pushed below support at 147.26 and is testing support t 147.26. Next is support at 1.46.48
148.51 and 148.98 are the next resistance lines

Will the stock market turn positive again?!The index is trading below the EMA200 and EMA50 on the four-hour timeframe and is trading in its descending channel. If the index moves down towards the specified demand zone, we can look for further buying opportunities in Nasdaq. A break of the resistance range and the channel ceiling will also cause the Nasdaq to continue its short-term upward trend.
In February 2025, the U.S. labor market grew at a slower pace than anticipated. According to published data, non-farm employment increased by 151,000 jobs in January, while expectations were set at 160,000.This indicates that while job growth continues, its momentum has been weaker than projected.
The unemployment rate rose to 4.1% in February, slightly above the expected 4%. Meanwhile, labor force participation declined by 0.2 percentage points to 62.4%. Average hourly earnings increased by 0.3% during the month, aligning with forecasts. On an annual basis, wage growth reached 4%, slightly below the estimated 4.1%.
Among various sectors, the highest job gains were recorded in healthcare (52,000 jobs), finance (21,000 jobs), and local government (20,000 jobs). Employment also rose in construction, transportation, social assistance, and manufacturing.
Conversely, some industries experienced job losses. The hospitality sector shed 16,000 jobs, retail lost 6,000, and the federal government reduced employment by 10,000 positions. Additionally, temporary jobs declined by 12,000, signaling a potential slowdown in economic growth.
Overall, the report suggests that while the U.S. labor market remains stable, certain indicators, such as rising unemployment and a decline in full-time jobs, may point to a deceleration in economic expansion. Following the report’s release, the U.S. dollar weakened slightly, but the market reaction was muted due to prior concerns over a more significant decline.
Hassett, the White House economic advisor, stated that future reports are likely to show further reductions in government employment. He emphasized the administration’s plan to cut government jobs and spending while boosting employment in the manufacturing sector. He also confirmed that tariffs are inevitable, arguing that such measures will support the expected 3% to 4% economic growth. Hassett expressed doubt that President Trump would grant exemptions for steel tariffs.
As investors try to adjust to Trump’s evolving trade policies, the U.S. Consumer Price Index (CPI) report for February is set to be released on Wednesday. Given the recent Personal Consumption Expenditures (PCE) index data from January, it is possible that CPI could be entering a new downward trend.
The Federal Reserve’s battle against inflation remains challenging, and the recent rise in price pressures has undoubtedly been frustrating for policymakers. However, signs indicate that U.S. inflation may be shifting course, with expectations of a decline in the coming months.
One major uncertainty remains: tariffs. Trump’s decision to impose a 25% tariff on Canadian and Mexican imports and a 20% increase on Chinese goods, along with additional sector-specific and retaliatory tariffs still under discussion, could undermine the Fed’s efforts to bring inflation down to 2%.
In January, the overall CPI climbed to 3%, marking its highest level since June 2024. Core inflation also reached 3.3%. However, February’s data is expected to ease months of concern about inflationary resurgence, with projections indicating a decline in overall CPI to 2.9% and core inflation to 3.1%. Monthly estimates for both indices stand at 0.3%.
Later in the week, Thursday’s Producer Price Index (PPI) for February will provide further insights into inflationary pressures, while on Friday, investors will closely monitor the University of Michigan’s preliminary consumer sentiment survey for March. Last month’s survey raised alarms, as consumer inflation expectations climbed to their highest level in 30 years.

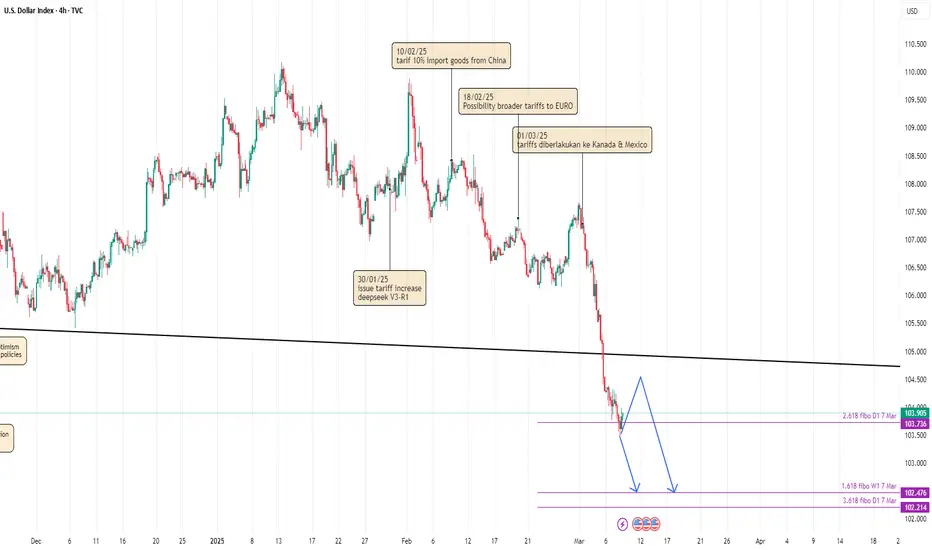
DOLLAR GAINS BUYER AMID NFP BAD DATA??Dollar seems on hold in it's 2.618 fibonacci support after NFP data released. Will it go higher next week?
I see dollar still waiting next data release. I mention JOLTS Job Opening & CPI which both of them crucial in current context of US macro-economy. Strong job opening & CPI means investor and retail trader must be no worries about US macro-economic despite concern about trade war. Otherwise, weak job opening & CPI means labor market and inflation continue cooling down. It will push THE FED to give clear path about their plan for future Interest Rate.
So, dollar could make sideways movement (or even gain buyer) but overall still in bearish momentum. Dollar still driven by concern of trade war and if job opening comes weaker than expected, it could gives more power to seller.
Nasdaq 100 drops below 20K after NFP, but could it rebound?The Nasdaq and S&P 500 were testing their weekly lows after what has been a bruising last few session. But with both indices testing their respective key support areas, could we see a recovery from around the current levels, especially in light of a weaker US jobs report?
Keep an eye on the area around 20,000 on the Nasdaq, where the Trump rally commenced back in November. It is a key psychological area for the market. Can we see a bounce, or will the selling continue as we head deeper into the US session?
At the time of writing, the index was below this level, but the session is not over yet. In any case, a confirmed reversal on the lower time frames should be observed by traders looking to potentially buy this dip. For example, if the index recovers to go bac above yesterday's low of 20180, that would be a bullish sign in my view. But right now it is looking quite bleak.
By Fawad Razaqzada, market analyst with FOREX.com

THE KOG REPORT - NFPTHE KOG REPORT – NFP
This is our view for NFP, please do your own research and analysis to make an informed decision on the markets. It is not recommended you try to trade the event if you have less than 6 months trading experience and have a trusted risk strategy in place. The markets are extremely volatile, and these events can cause aggressive swings in price.
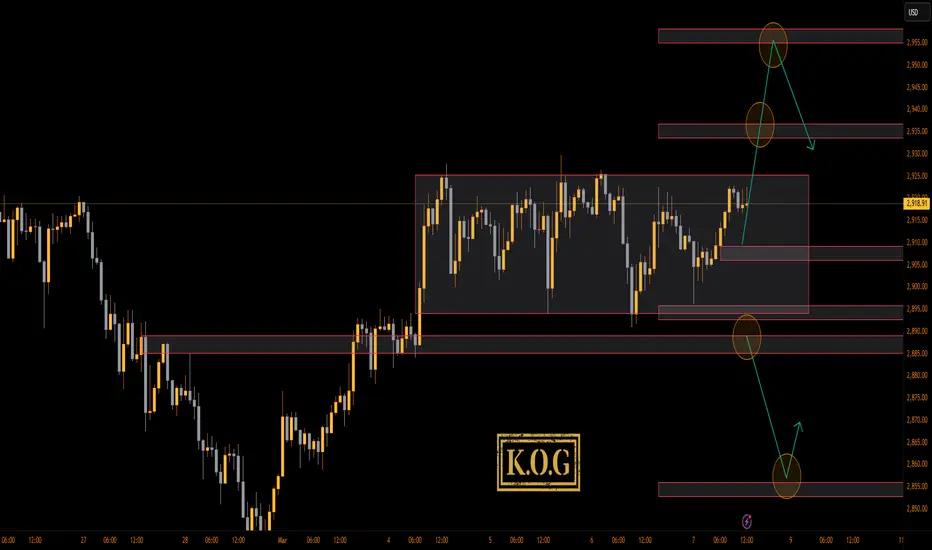
Firstly, we would suggest traders stay away from this NFP altogether, the markets are very delicate and moving to extreme levels not only on Gold but most forex pairs. For that reason we’ll keep it simple and look at the key levels together with the structure formed.
We have the higher resistance level here which is the previous order region 2930-35 which looks to be a potential region price may want to attack if they want to continue this move upside, above that is the extension of the move around 2945-55. Price needs to stay below this level, If we can reject and not break above these levels, an opportunity to see the market correct may be available back down in attempt to break 2900 level.
On the flip, if they push price downside, we’ll wait, the range needs to be broken, price should want to retest the flip and then continue the move, that’s when we can start using the red boxes to target those lower levels and potentially look for the swing low from the circled hotspot.
As above, keep it simple, the trade comes after the event and most accounts are blown during these events due to traders using large lots on small accounts attempting to capture the volume driven candles. Unless you’re already in and protected, the swing in the opposite direction can cause huge problems to less experienced traders.
RED BOXES:
Break above 2930 for 2934, 2940, 2944 and 2955 in extension of the move
Break below 2910 for 2903, 2895, 2890 and 2879 in extension of the move
Please do support us by hitting the like button, leaving a comment, and giving us a follow. We’ve been doing this for a long time now providing traders with in-depth free analysis on Gold, so your likes and comments are very much appreciated.
As always, trade safe.
KOG
GOLD: First Red DayHello traders and welcome back to my channel, as always, don't forget to leave me a like and a comment to support my work, I don't share too much because I constantly try to select best market's template with a great potential of success.
I strongly believe in quality above quantity!
If you have been following me since a while, you should remember that any of my analysis are not a forecast, I'm not interested in understanding and/or predicting what the market is going to do. Why?
Because guessing is literally 50/50 and is not part of my job.
Now, let's talk about GOLD.
I really like the current template and how the new month started, and to me, we can have a great opportunity to see a weekly pump and dump scenario setting up today with NFP or keep moving some more day into the new week.
To understand better the logic behind, let's analyse the market more deeply.
I didn't show in this chart the previous week, but you can have easily a look by yourself and you will realise that it started breaking down in a full week of down move, main reason today I would like to be looking for a short setup (if a short setup will be identified)
Monday, opening range of the week and the month, it was a clear pumping day, triggering long traders in the market and closing out of balance. The market now may be in place and other time frames are potentially involved in the market.
Tuesday, GOLD proceeded pumping higher, especially during the London session, triggering for the second time long traders in the market, and again closing out of balance.
Wednesday it kinda tap the weekly high, but most of all I can see the market consolidating. To me, it's a first sign of potential volume trap up high.
Thursday, the previous daily low was triggered, stopping eventually traders long from Wednesday, which they were trying to keep buying up high, and closing the day as a first red day, which potential can be a sell signal.
Today, Friday, the market is still inside the consolidation, and NFP can be very interesting in terms of completing this pattern, and I will be willing to take a sell high opportunity after the news.
Thesis:
- My main thesis is currently short, is a common weekly template of pump and dump if setup correctly
But obviously, I'm not here trying to predict, this is only the setup I'm looking for.
Yes, the market can keep going higher, in fact, I cannot exclude a scenario of breakout, pullback, continuation, on top of Monday high, which is the opening range of the week.
How do I know which direction is the market taking?
I don't know, until I will see a setup, either a pump and dump (and I will be lookingto short the dump and the weakness of the market).
Either if I can see a dump and pump, I would be willing to buy the strength on the frontside of the pump during NY session.
For better undressing, I will be sharing the intraday perspective during the NY session.
Gianni

EUR/USD keeps rolling after ECB rate cutThe euro has posted strong gains on Friday after taking a pause a day earlier. EUR/USD is trading at 1.0858 in the European session, up 0.69% on the day. It's been a remarkable week for the euro, which has soared 4.7% against the US dollar.
The ECB lowered rates by 25 basis points on Thursday in a widely-expected decision. This brings the deposit rate to 2.5%, its lowest level since Dec. 2022. The central bank has been aggressive in its easing cycle, slashing rates by 185 basis points in just nine months.
The rate reduction was no surprise and is being described as the "last easy cut". Inflation is running at a 2.4% clip, above the ECB's 2% target but low enough to deliver rate hikes in order to boost the flagging economy. What's next for the ECB is a tricky question, especially with economic and political developments moving at a dizzying pace.
First, the new Trump administration hasn't wasted any time in imposing (and in some cases, suspending) tariffs, which has chilled investor sentiment and sent equity markets tumbling. The US hasn't applied tariffs to the European Union although it has threatened to do so. The EU would surely retaliate and a trade war between the two giant economies will damage growth and raise inflation in the eurozone.
Second, Trump is showing growing impatience with Ukraine and has suspended military aid. Germany has responded by easing its fiscal spending rules and has proposed a massive spending scheme for defense and infrastructure. This has sent German bond yields and the euro soaring.
ECB President Lagarde said after the ECB meeting that the situation was changing "dramatically" by the day and the ECB would need to be "extremely vigilant" and "agile". She reiterated that future rate decisions would be based on the data.
The US wraps up the week with the February employment report. Nonfarm payrolls sank to 143 thousand in January from 256 thousand a month earlier. The market estimate for February stands at 160 thousand. A surprise in either direction from nonfarm payrolls would likely have a significant impact on the direction of the US dollar.
EUR/USD has pushed above resistance at 1.0801 and 1.0837 and is putting pressure on resistance at 1.0889. Above, there is resistance at 1.0925
1.0749 and 1.0713 are the next support lines

BTC at a Crossroads: Key Levels & Market Triggers Ahead of NFPWelcome back, guys! I'm Skeptic, and let's dive into today's BTC analysis.
Daily Time Frame Overview
As previously mentioned in past analyses, the 85K level , followed by the 80-82K range , has been a crucial support zone for BTC. So far, price has reacted well to this level, showing strong buying pressure. Additionally, BTC has reached the Pivot Point 4 weekly level , meaning we could expect either a range-bound movement or a potential price rebound. However, the market remains highly volatile due to external factors—mainly Trump's recent actions.
On Sunday , Trump’s tweet triggered a market pump, only to be reversed the following day after his tariff war statements. Given this unpredictability, if you’re looking to buy BTC for a long-term hold, here are two key triggers to consider:
Trigger 1 : Wait for daily candle closure above 90,700 before entering, with a stop-loss below 80,645.37 (~12-13% SL size).
Trigger 2: A breakout above 106,378.17 could be another entry point, with a stop-loss below 90,555.54 (~15% SL size).
💡 Risk Management Tip: In case of a stop-loss hit, limit losses to a max of 5% of your capital to preserve long-term profitability.
4H Time Frame - Futures & Short-Term Setups
Currently, the market lacks direction and is dominated by FOMO trading. Why? Because of high-impact events happening tomorrow, which include:
📊 NFP (Non-Farm Payroll) Data Release🎤 Trump & Powell’s Speeches
These could create significant volatility, making any positions riskier than usual. If you’re looking to trade BTC futures, consider these setups:
Long Trigger: Above 92,200, but for a safer entry, you can wait for confirmation at 94,628.59 or even 98,600 to ride the uptrend confidently.
Short Trigger: Due to the PRZ (Potential Reversal Zone) around 85K and 82K, I personally won’t short here. However, if you must, you could enter a short below 88,213.36, but only if volume confirms the move and RSI enters oversold territory.
🔔 Final Thoughts:
BTC remains highly volatile due to fundamental catalysts.
If you’re unsure, staying out of the market is also a position.
Drop a comment if you want me to analyze a specific coin or forex pair next!
Let’s grow together, not alone. Help me help you! ❤️

Gold LQ HUNT INCOMING!Still keeping an eye out for a possible liquidity hunt in the short term towards a new ATH at $1,963. Pending LQ sitting at $2,955.
But overall, we're bearish in the mid term so will adapt & also keep an eye out for market structure shifting to bearish. Current market structure is very choppy so I know we a lot of buyers & sellers are getting liquidated around this zone.

US Nonfarm Payroll Report: Market InsightsUS Nonfarm Payroll Report: Market Insights
Navigating the complex waves of the financial markets requires an astute understanding of various economic indicators. Among them, the nonfarm payroll report stands out as a pivotal monthly metric that can significantly sway financial markets. This article demystifies the intricacies of this influential report, walking through what to know before trading it.
Nonfarm Payroll Definition
The nonfarm payroll (NFP) is a key economic barometer that tallies the number of employed individuals in the US, excluding the agricultural sector. Besides the farm workers, government, private household, and nonprofit organisation workers are not included.
This nonfarm payroll, meaning the workforce in industries like manufacturing, services, construction, and goods, reflects the health of corporate America and, by extension, the US economy. It’s one of the components of the Employment Situation report released on the first Friday of every month by the US Bureau of Labor Statistics. Nonfarm employment change data is released along with unemployment rate and average hourly earnings data.
Given its encompassing nature, the NFP and its importance to economic vitality makes it a beacon for investors and traders, who see the data as a projection of economic trends and an influencer of the Federal Reserve's monetary policy. Fluctuations in NFP numbers can cause significant movements in currency, bond, and stock markets.
The Nonfarm Payroll Report and Market Volatility
The release of NFP figures is a major event on the economic calendar, often triggering heightened market volatility. As nonfarm payroll news hits the wires, traders and investors brace for potential rapid swings in asset prices, particularly in the forex market. The immediate aftermath can see significant fluctuations in currency pairs with the US dollar. The anticipation and reaction to the nonfarm payroll in forex markets exemplify the weight this report carries.
Impact of NFP on USD Pairs
The nonfarm payroll report has a profound influence on USD pairs. When the NFP data is released, traders immediately compare the figures to market expectations, leading to price adjustments based on how well the actual data aligns with analyst forecasts. The broader trend of NFP data is also important, but it generally takes a backseat compared to actual vs expected figures.
For example, if the report indicates stronger-than-expected job growth, the US dollar typically strengthens, especially against currencies like the euro, yen, and pound. A robust employment outlook suggests economic health, potentially raising expectations for tighter monetary policy from the Federal Reserve.
On the flip side, if the NFP numbers fall short of expectations, the US dollar may weaken, particularly if the data points to economic slowdown or stagnation. In such cases, currencies like the euro or Japanese yen might rise against the dollar, as traders speculate that the Federal Reserve could delay interest rate hikes or even consider easing measures to boost the economy.
The NFP report also reverberates through other major currency markets. For instance, currencies in economies closely tied to US trade and investment—such as the Canadian dollar or Mexican peso—may experience volatility as changes in US employment data often reflect shifts in economic demand for their goods and services.
The Role of Employment Rates and Wages in Market Sentiment
Within the US nonfarm payroll release, two key indicators—unemployment rates and average hourly earnings (month-on-month)—are pivotal in influencing market sentiment.
Unemployment Rates
The unemployment rate measures the percentage of the labour force actively seeking employment but currently without a job. A falling unemployment rate generally signals that more people are finding work, a positive indicator for economic growth.
As a result, equities may rally, and the US dollar often strengthens, particularly if the data beats expectations. Traders interpret lower unemployment as a sign of economic resilience, which could influence the Federal Reserve to maintain or tighten monetary policy, further boosting the dollar.
Conversely, a rising unemployment rate may signal economic weakness, spurring concerns over reduced consumer spending and slowing economic activity. This could lead investors to shift towards so-called safer assets like bonds or gold.
In the forex market, a rising unemployment rate tends to weaken the US dollar as it lowers expectations for interest rate hikes and prompts speculation about potential stimulus or rate cuts by the Federal Reserve, further pressuring the dollar and encouraging risk-off sentiment.
Average Hourly Earnings
Alongside unemployment, average hourly earnings (m/m) is another key metric that traders closely monitor. This indicator tracks changes in wages from one month to the next and offers insight into inflationary trends.
When average hourly earnings rise, it can indicate that workers have more disposable income, which can increase consumer spending. Higher wages often fuel concerns about inflation, prompting markets to anticipate interest rate hikes to combat potential overheating in the economy. This expectation typically strengthens the US dollar.
However, if average hourly earnings come in below expectations or show signs of stagnation, markets may interpret this as a sign of weaker inflationary pressures. In such cases, traders may anticipate a more dovish stance from the Federal Reserve, potentially delaying or even reversing interest rate hikes. This can weigh on the US dollar and boost equities.
Execution Tactics for the Nonfarm Payroll Report Release
On the day the NFP data is released, specific execution tactics tailored to the NFP's unique market footprint can add substantial value. Due to the potential for rapid price movements, traders narrow their focus to liquid markets, like EUR/USD, USD/JPY, and GBP/USD, to facilitate quick entries and exits. They’ll typically trade on the 1m, 2m, 5m, or 15m charts and often require platforms built with speed in mind.
Nonfarm payroll trading involves comparing the actual data against market expectations. The outcomes can typically be categorised as follows, with each scenario influencing forex markets differently:
- As Expected: Currency values may experience minimal immediate impact if the report aligns with analyst forecasts, as the anticipated news is already priced into the market.
- Better than Expected: A robust report can boost the US dollar, as higher employment rates suggest economic strength, potentially leading to rising interest rates.
- Worse than Expected: Conversely, weak employment figures can devalue the US dollar, reflecting economic concerns and pressuring policymakers towards accommodative measures.
Given the volatility, many traders prefer limit orders to manage slippage, potentially ensuring they enter the market at predetermined points. Lastly, spreads can widen substantially, inadvertently triggering a stop loss. Some traders choose to set a wider stop loss than normal for this reason.
Traders usually monitor not just the headline number but also revisions of previous reports and associated metrics, such as unemployment rate and wage growth, which can influence market sentiment. High-speed news feeds and an economic calendar containing nonfarm payroll dates are employed to access the numbers in real-time, enabling immediate analysis.
Analysing Unemployment and Wage Growth Numbers Together with NFP
When trading around the nonfarm payroll release, it's essential to look beyond the headline number and integrate unemployment and wage growth data into your analysis. The NFP number alone can drive initial market reactions, but combining it with unemployment and wage growth figures provides a more nuanced view of the economy’s direction.
Traders start by comparing the trends across these three metrics. For example, if the NFP report shows strong job creation but unemployment remains stubbornly high, this could indicate that the economy is absorbing a larger labour force, potentially due to discouraged workers returning to job-seeking. This dynamic might lead to a more muted market response, as the overall labour market picture is mixed.
On the other hand, rising average hourly earnings alongside strong US nonfarm payrolls often signals not just employment growth but increasing inflationary pressure. If wages grow faster than expected, especially when paired with a low unemployment rate, it could indicate that labour shortages are driving up pay, raising inflation risks and making Federal Reserve action more likely. In this scenario, traders might anticipate a stronger US dollar, as higher interest rates become more probable.
To streamline your analysis during nonfarm payrolls, consider the following approach:
- Aligning Expectations: Traders compare actual numbers for NFP, unemployment, and wage growth with analyst forecasts. If NFP and wages grow but the unemployment rate falls, the market is likely to favour USD strength, while mixed results can trigger choppier price action as traders digest the implications.
- Gauging Momentum: Looking at the broader trend can provide further insight. If unemployment has been trending down and wages are steadily increasing (i.e. an expanding economy), the overall market sentiment may remain bullish even if NFP slightly underperforms. Conversely, if there’s a rising unemployment rate despite decent NFP growth, it could signal that the economy is slowing down.
- Assessing Policy Impact: It’s good to know how the Federal Reserve might interpret the combined data. For instance, moderate NFP growth with stagnant wage numbers may not trigger immediate policy shifts, allowing for more accommodative conditions in the near term. However, strong wage growth and low unemployment alongside robust NFP numbers are more likely to prompt a hawkish response.
Trading the NFP: A Strategy
Traders often consider analytical nonfarm payroll predictions to calibrate their strategies. However, an approach to take advantage of whichever direction the market takes uses an OCO (One Cancels the Other) order. This order straddles the current price range just before the report is released. Such a strategy prepares the trader for movement in either direction, as the NFP release can generate a significant breakout from the prevailing range.
According to theory, the strategy unfolds:
- An OCO order is placed with one order above the current price range and another below it. This setup positions the trader to catch the initial surge regardless of its direction.
- Stop losses might be set on the opposite side of the pre-report range to potentially manage risk.
- Profit targets might be established within a four-hour window post-release, aiming for a favourable risk/reward ratio, such as 1:3.
- Alternatively, a trailing stop may be utilised, adjusting above or below newly formed swing points to protect potential returns as a trend develops.
Such strategies allow traders to potentially capitalise on the new trend direction ushered in by the NFP data.
Risk Management When Trading NFP
Trading the NFP report often brings heightened volatility, making risk management crucial for protecting capital during these market swings. Below are some key risk management practices often employed when trading the NFP:
- Awareness of Spreads: Spreads can widen substantially during NFP releases. This can trigger even wide stop losses; tight stop losses can suffer extreme slippage, where the stop loss execution price differs substantially from the desired price.
- Conservative Position Sizing: Some traders take smaller positions when entering pre- and post-NFP release. The increased volatility when the report is released can lead to slippage and greater-than-anticipated losses as a consequence. Likewise, post-release conditions can also be unpredictable if data is mixed.
- Avoiding Overtrading: Aim to be selective with trades to avoid chasing price swings in a highly reactive market. It might be preferable to wait for a clear direction to emerge before entering a trade.
Comparative Analysis with Other Economic Indicators
The NFP report serves as a primary mover in the forex market, but its full value is best understood in concert with other economic indicators. Investors compare its findings with the Consumer Confidence Index for insights into spending trends, as employment health can influence consumer optimism and spending behaviours.
Likewise, juxtaposing NFP data against the Gross Domestic Product (GDP) figures provides a more complete narrative of the economic cycle since higher employment typically signals increased production and economic growth. Additionally, assessing the Consumer Price Index (CPI) and Producer Price Index (PPI) alongside NFP numbers can offer insight into inflationary pressures; strong employment data may point to higher inflation, a significant factor in central bank policy decisions.
The Bottom Line
In closing, learning how to trade nonfarm payroll data today may sharpen your market acumen and create exciting trading opportunities in the future. For those ready to apply these insights when NFP data is released, opening an FXOpen account provides access to over 700 markets, high-speed trade execution, tight spreads from 0.0 pips, and low commissions from $1.50. Happy trading!
FAQ
What Is NFP and How Does It Work?
The NFP meaning refers to the nonfarm payroll report, data that measures the number of jobs added in the US economy, excluding the agricultural sector. Released on the first Friday of every month by the US Bureau of Labor Statistics, the NFP is a key indicator of economic health, affecting currency, bond, and stock markets.
How Does Nonfarm Payroll Affect the Stock Market?
NFP data can drive stock market volatility. Strong job growth signals economic strength, often boosting equities. Conversely, weak NFP figures may indicate a slowing economy, leading to stock market declines as investors anticipate weaker corporate earnings.
What Happens When NFP Increases?
An NFP increase suggests robust job growth, typically strengthening the US dollar and stock markets, as investors expect economic expansion and potentially tighter monetary policy from the Federal Reserve.
Why Is Nonfarm Payroll So Important?
An NFP report is crucial because it reflects the overall health of the US labour market and economy. Traders and investors use the data to gauge economic trends, determine Federal Reserve actions, and understand where markets are headed.
Trade on TradingView with FXOpen. Consider opening an account and access over 700 markets with tight spreads from 0.0 pips and low commissions from $1.50 per lot.
This article represents the opinion of the Companies operating under the FXOpen brand only. It is not to be construed as an offer, solicitation, or recommendation with respect to products and services provided by the Companies operating under the FXOpen brand, nor is it to be considered financial advice.

EURUSD 3-7 Mar 2025 W10 - Weekly Analysis- EU Rate - US NFP WeekThis is my Weekly analysis on EURUSD for 3-7 Mar 2025 W10 based on Smart Money Concept (SMC) which includes the following:
Market Sentiment
Weekly Chart Analysis
Daily Chart Analysis
4H Chart Analysis
Economic Events for the Week
Market Sentiment
The EUR/USD pair faces a slightly bearish bias this week, driven by key economic events, geopolitical risks, and trade uncertainties.
Key Events to Watch:
🔹 ECB Interest Rate Decision (March 6) – Markets expect a 25 bps rate cut to 2.50%. A dovish ECB could pressure the euro, while any hints of a pause may provide support.
🔹 U.S. Non-Farm Payrolls (March 7) – Forecast at +133K jobs, with unemployment steady at 4.0%. Weak data could weigh on the USD, while stronger payrolls and wage growth may boost it.
🔹 Trump’s Tariffs & Trade War Risks – New U.S. tariffs on Mexico, Canada, and China take effect March 4, with potential auto tariffs on Europe looming. These policies favor the dollar by driving risk-off sentiment.
🔹 Geopolitical Tensions – U.S.-Ukraine relations deteriorated after a public Oval Office clash between Trump and Zelenskiy. Further instability could impact investor confidence and increase safe-haven demand for the USD.
Trading Strategy:
✅ Bearish Scenario: A dovish ECB, strong U.S. NFP, and escalating trade risks could push EUR/USD down.
✅ Bullish Scenario: If the ECB signals a rate-cut pause and U.S. jobs data disappoint, EUR/USD may test 1.055–1.06 .
Overall, the fundamental backdrop leans in favor of the USD, but volatility is expected, especially around the ECB and NFP releases. Traders should stay alert to geopolitical developments and tariff announcements that may shift sentiment.
Weekly Chart Analysis
1️⃣
🔹Swing Bearish
🔹Internal Bearish (Pullback Phase)
🔹In Swing Discount
🔹Swing Continuation Phase (Pro Swing + Pro Internal)
2️⃣
🔹INT structure continuing bearish with iBOS following the Bearish Swing. (End of 2023 till end of 2024 was a pullback phase after the first bearish iBOS)
3️⃣
🔹After the bearish iBOS we expect a pullback, price tapped into Monthly Demand and the liquidity below Nov 2022 which is above the weekly demand formed with the initiation of the bearish iBOS pullback phase.
🔹Price made a bullish CHoCH which indicated that the liquidity was enough as per previous weeks analysis to initiate a pullback phase for the bearish iBOS.
🔹Price pulled back after the Bullish CHoCH to the Weekly Demand formed and showed reaction after volatile week.
🔹With the previous week Bearish close, weekly is consolidating between 1.05xx and 1.02xx
🔹Still the recent Bullish Fractal and Demand holding but failed to break the high (1.0533) so there is a probability to target the low 1.0285/10 and could extend to continue the Bearish INT Structure with iBOS.
Daily Chart Analysis
1️⃣
🔹Swing Bearish
🔹INT Bearish
🔹Swing Continuation Phase (Pro Swing + Pro Internal)
2️⃣
🔹Following the Bearish Swing BOS, INT Structure continuing bearish tapping the weekly demand zone.
3️⃣
🔹After the failure to close below the Weak INT Low, price continued bullish sweeping the liquidity above Dec 30 and mitigating a Daily supply zone within the INT Structure Premium Zone.
🔹With the mitigation of the Daily supply, price created a Bearish CHoCH signaling the end of the Pullback Phase of the INT structure and the start of the Bearish move targeting the Weak INT Low.
🔹Price failed for the 2nd time to close below the Weak INT Low after mitigating the Daily Demand formed from the failure to close below the Weak INT Low which triggered aggressive Bullish reaction and mitigating the Daily Supply Zone formed from the recent Bearish CHoCH.
🔹After Supply mitigation, price continued Bearish following the Bearish INT Structure continuation phase.
🔹With the Weekly is consolidating the Daily consolidation range showing that we are failing to continue Bullish and with the recent Bearish CHoCH we are back to the Bearish INT Structure continuation and we may target the Weak INT Low (At least 1.0285).
🔹Price could pullback to the recent Daily Supply before continuing down.
🔹Expectation is set to Bearish with cautious of the Liq. built above 1.05333 and the range we are in.
4H Chart Analysis
1️⃣
🔹Swing Bullish (Reached Swing Extreme Demand)
🔹INT Bearish (Adjusted my INT structure to align with the previous Bullish move)
🔹Complex Swing INT Structure
2️⃣
🔹As the Swing is Bullish, expectations were set to continue Bullish targeting the Weak Swing High and create a Bullish BOS after the Deep Pullback to the Swing Demand.
🔹During the Swing Bullish Continuation after the Deep Pullback, INT Structure kept holding Bullish to fulfill the Bullish continuation phase.
🔹With price reaching the Swing Extreme Premium zone and the expectation of breaking the Weak Swing High, price failed 2 times and with the 3rd attempt it created a Bearish iBOS. This indicated that the Swing INT structure is Complex and the Daily/Weekly TFs are still in play.
3️⃣
🔹After the Bearish iBOS, we expect PB, there is no clear POI for price to initiate PB except the Liq. at 1.03730 which was swept on Friday and 1.03173 before mitigating the last clear 4H Demand.
🔹With the recent Bearish iBOS, the PB could start at anytime. The Liq. swept from 1.0373 could provide that PB otherwise we will continue Bearish till the clear 4H Demand (Which I doubt that it could provide the continuation) but with LTF shifting Bullish, we can follow that.
Economic Events for the Week

GOLD possible bearish continuationXAUUSD - Possible for a bearish continuation for next week, with NFP forecasted to be weaker. But watchout for some retrace / correction for intraday play.

EURUSD Technical Forecast on NFP 07.02.2025Overall Trend & Context:
The EURUSD pair is in an overall downtrend on the higher time frames and has recently been consolidating on the lower times.
Fundamental Considerations for the NFP:
Consensus Forecast (High Probability) - Most analysts forecast a gain in the 169K–170K range, which lines up with recent trends. A neutral result would suggest that the labor market is still solid.
Stronger-than-Expected Outcome (Medium Probability) - If the report comes in well above consensus (eg: above 190K jobs), it could reinforce expectations for a more hawkish stance by the Federal Reserve.
Weaker-than-Expected Outcome (Low Probability) - A result below expectations (eg: fewer than 135K jobs) might trigger a reassessment of the US economic outlook, we will need to watch the markets and prepare for dynamic shifts.
Technical Findings:
Weekly - Bearish and trading well below EMA's.
Daily - Bearish & showing signs of 25 EMA rejection. Previous distribution is holding price at bay.
4 Hour - Strong supply levels holding and trading below the 200 EMA.
1 Hour - Close to overbought levels and LTF distribution is holding.
Important Notes:
DXY is at a previous demand which proved to be a challenge to break through in the past.
GBPUSD & EURUSD can have variations in the short term correlation but the technicals both align, which reinforces our EURUSD narrative.
USDJPY technicals remain bullish on the long term however, the short term is in a downtrend and has reached a daily demand - we could potentially see a bullish reaction from here (based on DXY strength and the negative correlation with EURUSD)
Potential Scenarios & Probabilities:
If the lows at 1.03800 fail we may need to adjust our entry zones based on where liquidity and supply are found.
If price reaches the weaker supply level closer to the release of the NFP we can enter, however there is a chance we could get stuck in some drawdown if supply isn't strong enough to push through.
HIGH PROFILE NEWS RELEASES ARE DOUBLE EDGED IF YOU'RE NOT CAREFUL. YOU DO NOT NEED TO BASE YOUR ENTIRE TRADING CAREER ON IT. STAY OUT IF YOU'RE NOT COMFORTABLE TRADING NEWS.
AS TRADERS, YOUR PRIMARY JOB IS TO PROTECT YOUR CAPITAL - WITHOUT CAPITAL YOU CAN'T MAKE ANY MOVES.
Trade smart.
Hope you all make money if you're trading today!
Apex out!
OANDA:EURUSD FX:EURUSD FOREXCOM:EURUSD OANDA:USDJPY TVC:DXY OANDA:GBPUSD PEPPERSTONE:GBPUSD FX:USDJPY

News TradingLet’s talk about news trading in Forex . While news trading is extremely lucrative it’s one of the most risky things a trader can do and experience. News and data cause extreme volatility in the market and as we always say “volatility can be your friend or your enemy” . Let’s take a deeper dive into news trading, which news and data affect the TVC:DXY precious metals such as OANDA:XAUUSD and other dollar related currency pairs. We will also cover having the right mindset for trading the news.
1. Understanding News Trading in Forex
News trading is based on the idea that significant economic data releases and geopolitical events can cause sharp price fluctuations in forex markets. We as traders, aim to profit from these sudden price movements by positioning ourselves before or immediately after the news hits the market. However, due to market unpredictability, it requires a strategic plan, risk management, and quick decision making.
2. What to Do in News Trading
1. Know the Key Economic Events – Monitor economic calendars to stay updated on high-impact news releases.
The most influential events include:
Non-Farm Payrolls (NFP) – A report on U.S. job growth that heavily influences the U.S. dollar.
Consumer Price Index (CPI) – Measures inflation, impacting interest rate decisions and currency valuation.
Federal Open Market Committee (FOMC) Meetings – Determines U.S. monetary policy and interest rates, affecting global markets.
Gross Domestic Product (GDP) – A key indicator of economic growth, influencing currency strength.
Central Bank Statements – Speeches by Fed Chair or ECB President can create large market moves.
2. Use an Economic Calendar – Websites like Forex Factory, Investing.com, or DailyFX provide real-time updates on economic events.
3. Understand Market Expectations vs. Reality – Markets often price in expectations before the news is released. If actual data deviates significantly from forecasts, a strong price movement may occur.
4. Trade with a Plan – Whether you are trading pre-news or post-news, have clear entry and exit strategies, stop-loss levels, and a defined risk-to-reward ratio.
5. Monitor Market Sentiment – Pay attention to how traders are reacting. Sentiment can drive price action more than the actual data.
6. Focus on Major Currency Pairs – News trading is most effective with liquid pairs like FX:EURUSD , FX:GBPUSD , FX:USDJPY , and OANDA:USDCAD because they have tighter spreads and high volatility.
3. What NOT to Do in News Trading
1. Don’t Trade Without a Stop-Loss – Extreme volatility can cause sudden reversals. A stop-loss helps prevent catastrophic losses.
2. Avoid Overleveraging – Leverage magnifies profits but also increases risk. Many traders blow accounts due to excessive leverage.
3. Don’t Chase the Market – Prices may spike and reverse within seconds. Jumping in late can lead to losses.
4. Avoid Trading Without Understanding News Impact – Not all economic releases cause the same level of volatility. Study past reactions before trading.
5. Don’t Rely Solely on News Trading – Long-term success requires a balanced strategy incorporating technical analysis and risk management.
4. The Unpredictability of News Trading
News trading is highly unpredictable. Even when a report meets expectations, market reactions can be erratic due to:
Market Sentiment Shifts – Traders might focus on different aspects of a report than expected.
Pre-Pricing Effects – If a news event was anticipated, the market might have already moved, causing a ‘buy the rumor, sell the news’ reaction.
Liquidity Issues – Spreads widen during major news events, increasing trading costs and slippage.
Unexpected Statements or Revisions – Central banks or government agencies can make last-minute statements that shake the market.
5. How News Affects Forex, Gold, and the U.S. Dollar
1. U.S. Dollar (USD) – The USD reacts strongly to NFP, CPI, FOMC statements, and GDP reports. Strong economic data strengthens the dollar, while weak data weakens it.
2. Gold (XAU/USD) – Gold is an inflation hedge and a safe-haven asset. It often moves inversely to the USD and rises during economic uncertainty.
3. Stock Market & Risk Sentiment – Positive economic news can boost stocks, while negative reports may trigger risk aversion, benefiting safe-haven currencies like JPY and CHF.
6. The Right Mindset for News Trading
1. Accept That Volatility is a Double-Edged Sword – Big moves can mean big profits, but also big losses.
2. Control Emotions – Fear and greed can lead to impulsive decisions. Stick to your strategy.
3. Risk Management is Key – Never risk more than a small percentage of your capital on a single trade.
4. Adaptability – Be prepared to change your approach if market conditions shift unexpectedly.
5. Patience and Experience Matter – The best traders wait for the right setups rather than forcing trades.
Thank you for your support!
FxPocket

EUR/CAD Bullish Momentum Rising Channel Points to 1.5000 Target EUR/CAD is trading at approximately 1.4800. Your target price of 1.5000 indicates an anticipated upward movement of 200 pips, aligning with a bullish outlook within the context of a rising channel pattern.
Technical analysis on the daily chart suggests a bullish bias, as EUR/CAD continues to trade within an ascending channel pattern. This pattern is characterized by higher highs and higher lows, indicating sustained upward momentum. The pair is approaching the upper boundary of this channel, suggesting potential for further gains toward your target price.
On the 4-hour timeframe, EUR/CAD is trading within a rising channel as it approaches a confluence area. This consolidation pattern increases the likelihood of a bearish outcome, as traders can wait for the break and retest of the trendline support of the channel pattern to confirm a bearish entry.
In summary, the EUR/CAD pair is exhibiting bullish momentum within a rising channel pattern, with technical indicators supporting a potential move toward the 1.5000 target. Traders should monitor key support and resistance levels, as well as fundamental factors influencing the Euro and Canadian Dollar, to make informed trading decisions.

The S&P sell before the NFPWe are expecting a drop in the S&P later tonight based on what the charts are telling us.
1) The high of S&P is at 6118 and 6130.
2) There is a pattern to sell at the current level of 6080.
3) Yesterday's high to resist the trade.
4) H1 divergence present as well
The optimistic target is 5930 (1:3 risk to reward). We will monitor and post updates here as the trade moves.

Key Levels for EURUSDOn Friday, EURUSD bounced off 1,0400 following the news.
If the price rises again, the levels from the news event will act as important resistance.
A breakout above these levels would confirm further upside movement.
This week, the key news event is on Wednesday, when U.S. inflation data will be released.
There aren't any good trading opportunities at current price levels.

GBPUSD LONG: NFP MISSUS January non-farm payrolls +143K vs +170K expected. As a result, we expect the dollar to show some weakness going into the end-of-the-week trading. We are looking for GBPUSD longs as we can see based on the our, the technicals are in support of the fundamentals.

NFP LESS THAN EXPECTED. KEY LEVELS TO WATCHThe U.S. Non-farm Payrolls Changed By 143,000 In January, Compared With Expectations Of 175,000 And A Previous Value Of 256,000
KEY LEVELS.
We expect a rise in xauusd value to 2894 .
2869
2874
2883
2889
2894
2910
Alternative scenario
if 2860 is broken it may fall to 2855 and 2840 can act as a strong support.
the ultimate support for current scenario is 2833.
follow us for further updates boost us so that we can reach more people

A quick glance at what's happening after the NFP releaseLet's see how markets are performing right now after we received the US NFP number for January, which showed a significant decline from the previous reading. However, average hourly earnings improved and unemployment fell to 4%. Last time we saw a reading as low as 4% was back in June of 2024.
MARKETSCOM:DOLLARINDEX
MARKETSCOM:GOLD
FX_IDC:USDJPY
FX_IDC:USDCAD
74.2% of retail investor accounts lose money when trading CFDs with this provider. You should consider whether you understand how CFDs work and whether you can afford to take the high risk of losing your money. Past performance is not necessarily indicative of future results. The value of investments may fall as well as rise and the investor may not get back the amount initially invested. This content is not intended for nor applicable to residents of the UK. Cryptocurrency CFDs and spread bets are restricted in the UK for all retail clients.
