USDJPY - Yen will continue to strengthen?!The USDJPY currency pair is above the EMA200 and EMA50 in the 4H timeframe and is moving in its medium-term bullish channel. In case of correction due to the release of today's economic data, we can see the demand zone and buy in those two zones with the appropriate risk reward.
Yesterday, the Bank of Japan kept its interest rate unchanged at 0.25%, as expected. The Japanese government maintained its overall economic assessment for October, continuing to believe that the economy is recovering at a moderate pace. However, it downgraded its outlook on production, indicating that output might be facing challenges and may struggle to grow significantly.
Meanwhile, Japan’s Economy Minister, Akazawa, stated that currency movements are being closely monitored, and proposed policies from other parties will be reviewed. He also noted that a weaker yen could lead to a decrease in income and private consumption, particularly if wage growth is insufficient.
According to a recent Reuters survey of economists, 103 out of 111 economists expect the Federal Reserve to cut interest rates by 0.25% in November and December of this year, bringing the rate to a range of 4.25% to 4.5%. Additionally, 74 out of 96 surveyed economists predict that the Federal Reserve’s interest rate will drop to 3% to 3.25% or higher by the end of 2025.
A recent report from CIBC suggests that a 3% growth in U.S. GDP is unlikely to overheat the economy. CIBC believes that the U.S. economy can sustain growth at this rate while continuing its rate-cutting cycle.
The report shows that U.S. economic growth has reached 2.8%, slightly below analysts’ 3% expectation. Nonetheless, the details reflect a robust economic performance, with domestic consumption offsetting the negative effects of net trade.
CIBC analysts argue that 3% growth should be seen as a new measure of economic capacity rather than a sign of overheating. They point to improvements in productivity and cooling labor markets and inflation, asserting that
Nfp

Pre NFP Trade Analysis1st November
DXY: Stronger NFP, DXY bounce off 103.80 to trade up to 104.60. If 103.80 broken, could trade down to 103.45
NZDUSD: Sell 0.5925 SL 20 TP 60 (DXY Strength)
AUDUSD: Sell 0.6545 SL 25 TP 60 (DXY Strength)
GBPUSD: Sell 1.28 SL 40 TP 120 (DXY Strength)
EURUSD: Buy 1.0905 SL 25 TP 100 Hesitation at 1.0950 (DXY Weakness)
USDJPY: Sell 151.40 SL 40 TP 200 Hesitation at 150.55 (DXY Weakness)
USDCHF: Buy 0.8710 SL 20 TP 40 (DXY Strength)
USDCAD: Sell 1.3915 SL 15 TP 30 (DXY Weakness)
Gold: Needs to stay below 2760, break 2740 could trade down to 2708

Average Range Levels Short Market dumped really really harded and I participated in this move!
I entered at 1/3AWR- take first partial at ADR and final Take profit at AWR- I felt this move was coming since when price mooves like this before NFP it tends to do these types of moves.

NFP Data: Can it Sway Election? Just days before the U.S. heads to the polls, the last employment report before Election Day will offer a snapshot of hiring and unemployment, key factors in a race where the economy remains top of mind for voters.
Ordinarily, monthly jobs data provides a clearer gauge of economic conditions. However, analysts project that last month’s hiring figures could be skewed by multiple disruptions. Hurricanes Helene and Milton, alongside a prolonged strike by Boeing machinists, are expected to have temporarily trimmed employment by up to 100,000 jobs.
Gold could emerge as one of the most responsive assets. Following a surge to record highs, bullion slipped as some investors opted to lock in gains and pushed the RSI into oversold levels. Technically, XAU/USD is potentially still bullish.

XAUUSD - Areas with high potentialGold and silver still have room to grow, according to Max Layton, head of research at Commodity City. Leighton says the best bull markets for gold and silver usually occur when the US and European markets are weakening and China looks poised to grow.
Investors have flocked to gold this year as geopolitical factors, a changing economic landscape and persistent inflation concerns have fueled fears of volatility in other assets.
When there is too much euphoria, we must be careful of price correction!

Will the job data impair the US dollar gain?Macro theme:
- The dollar remained steady despite short-term volatility, reflecting mixed economic data. US Sep Retail Inventories and Oct Consumer Confidence exceeded forecasts, while Sep Job Openings fell short.
- Treasury yields reached multi-month highs early but declined following a strong seven-year auction.
- With the US job report—the last before the FOMC meeting—approaching, storms and strikes could complicate interpreting the data, introducing further uncertainty around the dollar’s direction.
Technical theme:
- DXY is consolidating in a small range at the top and looks stretched. This is vulnerable to a potential mean reversion. The price is trading away from both EMAs.
- If DXY extends its gain above the previous swing high at 104.60, the index may rise to 106.00 resistance.
- On the contrary, if DXY closes below 104.00 support, the index may decline to retest 103.45 support.
Analysis by: Dat Tong, Senior Financial Markets Strategist at Exness

XAU/USD: Final NFP before Election Americans continue to rank the economy as their top issue, and the final Non-Farm Payrolls (NFP) report before voting day, offers a crucial signal this coming Friday.
September saw a gain of 254,000 jobs, but forecasts point to a marked slowdown, with expectations hovering just above the 100,000 mark. The expected downturn stems from several factors, including back-to-back hurricanes disrupting the Southeast of the country.
For now, gold is trading below Friday’s close (but for how much longer?) as markets react to limited Israeli action against Iran. Tehran has indicated it won’t retaliate, easing geopolitical tension and potentially reducing demand for the haven asset.

NFP is strongI am expectint to reach new ATH soon. BTC and market must stay stable. This is bull flag breakout confirmed with beautiful retest of white MA. It is bullish.
NOT A FINANCIAL ADVICE
ALWAYS USE STOPLOSS AND MANAGE YOUR RISK
IF YOU HAVE ANY QUESTIONS PLEASE LET ME KNOW IN COMMENTS

XAUUSD2632 is clear breakout, green zone is clear for a pull back for sbr, for fomc tonigh. looking for short till 2582 to 2584. what you all think about this week let me know in the comment.

USD/JPY soars as rate hike hopes chilledThe yen has stabilized after massive losses last week. In the North American session, the USD/JPY is trading at 148.03 at the time of writing, up 0.45%.
The yen is coming off a spectacularly bad week with a 4.5% decline. This marked the yen’s worst week since 2020, during the covid pandemic. The sharp decline was driven by the political drama in Japan, which included the election of Shigeru Ishiba as the new prime minister. Ishiba has supported the Bank of Japan tightening policy in the past, but he has taken a U-turn on monetary policy since being elected prime minister.
Ishiba may have shifted his stance in order to avoid any divisive issues, such as raising interest rates, ahead of the snap election on October 27. The election will be followed by the next BoJ meeting on October 31, with the BoJ expected to maintain its policy settings.
On Wednesday, Ishiba met with BoJ Governor Ueda and said that Japan did not need to raise rates further. In a speech to parliament on Friday, Ishiba pledged to defeat deflation, a message which signaled a continuation of “Abenomics”, which advocates an accommodative policy. The yen slid 1.1% on Friday as expectations for a rate hike have evaporated.
Ishiba’s dovish stance and comments by BoJ officials that it the Bank will be extremely cautious before raising rates has dashed expectations for a near-term rate hike and made the Japanese currency less attractive to investors.
The US labor market surprised to the upside, as September nonfarm payrolls surged by 254 thousand, up from a revised 159 thousand in August and blowing past the market estimate of 140 thousand. This was the strongest job report in six months. The unemployment rate dipped lower to 4.1%, compared to 4.2% in August and below the market estimate of 4.2%. The markets have raised the odds of a 25-basis point cut at the Fed November meeting to 87%, compared to 65% one week ago.
USD/JPY tested support at 147.89 earlier. Below, there is support at 146.78
There is resistance at 149.86 and 150.97

THE KOG REPORT - NFP THE KOG REPORT – NFP
This is our view for NFP, please do your own research and analysis to make an informed decision on the markets. It is not recommended you try to trade the event if you have less than 6 months trading experience and have a trusted risk strategy in place. The markets are extremely volatile, and these events can cause aggressive swings in price.
Simple one for this NFP as we’re going to be more of the observer rather than the trader unless again, we get those extreme levels that we want.
Key level here is 2670 which was our bias level earlier in the week, that is also now a resistance being attempting to break open. For that reason, we will wait to see if it breaks and look higher at the levels of 2675 and then step by step upwards following the path. We’ll be looking at the extreme level of 2710-20 for the exhaustion and the RIP to attempt the short trade.
On the flip, downside risk on the break of 2650 key level should take us in to the order region 2630-35 where we may get a slight reaction in price, but potentially only for the scalp. Breaking this level opens the door and we won’t be looking to long again until we target 2600-10.
Please do support us by hitting the like button, leaving a comment, and giving us a follow. We’ve been doing this for a long time now providing traders with in-depth free analysis on Gold, so your likes and comments are very much appreciated.
As always, trade safe.
KOG

NFP signal Gold price sticks to modest gains near weekly top, bulls seem non-committed ahead of US NFP
Gold price (XAU/USD) struggles to capitalize on its modest intraday uptick and remains below the weekly top through the early part of the European session on Friday.
Gold now buy 2659
Support 2685

#Tesla Analysis : More Fall Ahead ? (READ THE CAPTION)By analyzing Tesla's weekly chart (logarithmic), we observe that after a correction down to $209, the price experienced renewed buying pressure and was able to climb back up to $265. Once the price reached this significant supply level again, it faced selling pressure and has, so far, corrected down to $240. I expect that if the weekly candle closes and stabilizes below $242, we may see further correction in this company's stock.
Please support me with your likes and comments to motivate me to share more analysis with you and share your opinion about the possible trend of this chart with me !
Best Regards , Arman Shaban

Areas prone to reaction in the EURUSD due to today's NFP newsConsidering the deep fall of the euro last week and the euro and pound reaching the support area, we can expect the reaction from these areas, and the news can turn this momentum around and have a quick retracement.

04.10.24 Morning ForecastPairs on Watch -
FX:EURNZD
FX:GBPJPY
FX:USDCAD
A short overview of the instruments I am looking at for today, multi-timeframe analysis down to what I will be looking at for an entry. Enjoy!

Gold 4H Pennant4H Bullish Pennant Pattern
Expecting NFP News to push Gold to new highs.
Fundamental & Technical Confluence.

NFP & Port Strikes: Why Jobs Matter This Week Nonfarm Payrolls (NFP) are projected to rise by 140,000 in September, matching August's pace and pushing the three-month average job gains to the weakest level since mid-2019. The NFP data is due this Friday.
At the same time, a major labor disruption is underway. Dockworkers at 14 key ports, handling roughly half of U.S. trade, have launched an indefinite strike. The walkout could disrupt trade and strain the economy ahead of the presidential election and the crucial holiday shopping season.
Chicago Fed President Austan Goolsbee expressed concern that a prolonged strike could worsen supply chain bottlenecks, exacerbate inflation, and alter expectations for the Federal Reserve's next move on interest rates.

EUR/USD Awaits NFP!The upcoming key EU inflation data could play a decisive role in the currency pair's movement. With the ECB signaling potential inflation stabilization at 2% by 2025, future monetary policy may be less aggressive. On the other hand, the Fed has kept the possibility of further rate cuts on hold, with the market anticipating up to 100-125 basis points of rate reductions over the next 12 months. This potential alignment between Fed and ECB policies could support EUR/USD, but the long-term economic strength of the US may limit the euro's upside.
The US dollar has shown a significant rebound, recovering ground due to rising US Treasury yields, pushing EUR/USD down towards the 1.1110 level.
The main resistance is set at 1.1214 (2024 high), followed by the 2023 peak at 1.1275. Should EUR/USD break these levels, a significant recovery may unfold. On the downside, immediate support is at 1.1113, followed by 1.1082.
In the short term, EUR/USD could move sideways between the identified support and resistance levels, with EU inflation data and the US Non-Farm Payrolls (NFP) report acting as catalysts for significant movements. If inflation data shows a marked decline or NFP data underperforms, EUR/USD may break above the 1.1214 resistance level.

THE KOG REPORTTHE KOG REPORT:
In last week’s KOG Report we wanted to short from the 2630-35 region into the lower levels, which worked but we only managed to get 2613 when we wanted 2610. Ideally, we wanted lower to then access the price action and look for the long, however, that long came early and we managed to capture the move both down and then up completing our bias target levels plus the extra pip capture into the highs to end the week.
A great week not only on gold but we completed 32 targets giving our traders a phenomenal pip capture across the markets. Nice, easy, clean trading!
So, what can we expect in the week ahead?
We've had some more geopolitical news over the weekend so there is a chance that we will see some opening gaps on the markets. We also have NFP this week, so towards the end of the week can expect the usual pre-event price action and ranging to form.
Now, due to us expecting these potential gaps, best practice is to let Monday early session do what it needs to do, instead plot the levels and look for the RIPs to capture the scalps, ideally on the red boxes.
We have the immediate levels above at 2665/7 resistance, which is a crucial level price needs to reject to continue the move downside! For that reason, we are giving a bias level of bearish below 2670 provisionally with an extension of the move into 2675 which is the flip. If we attack these levels, and get the reaction we need, we feel these levels will represent opportunities to short into the lower levels 2650-55 and below that 2630-35.
If broken above, we get that flip and we’ll be looking to target that 2701 level and above that we have 2707, which is where we may get further opportunities to attempt the short again.
Important: There is an extension of this downside move, and it’s below our bias level bullish above 2630-35. Oddly enough, we also have an Excalibur target sitting down there active! We will want to see how the market opens and what they do in the early session before we make up our minds on that move. NFP could through a spanner in the works for traders!
For now, we’ll stick with the above and as usual we’ll update traders through the week.
Look out for KOG’s bias of the day, KOG’s red boxes and the indicator levels which are published for the wider community.
KOG’s Bias for the week:
Bearish below 2670 with targets below 2650 and below that 2635
Bullish on break of 2675 with target above 2685 and above that 2701
RED BOXES:
2665 break above for 2672 / 2685 / 2701 / 2707
2650 break below for 2635 / 2624 / 2620
Please do support us by hitting the like button, leaving a comment, and giving us a follow. We’ve been doing this for a long time now providing traders with in-depth free analysis on Gold, so your likes and comments are very much appreciated.
As always, trade safe.
KOG

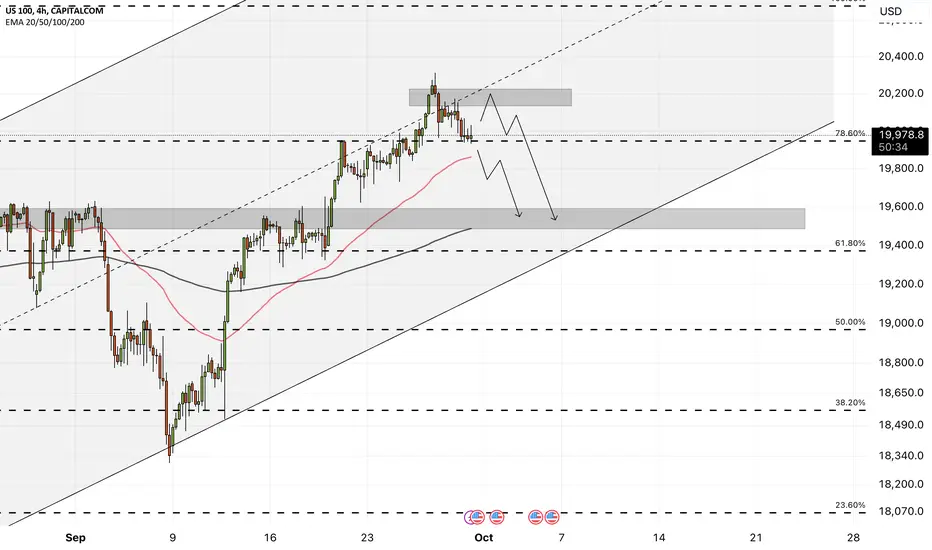
The stock market is waiting for the release of PMI and NFP!The index is above the EMA200 and EMA50 in the 4H timeframe and is trading in its ascending channel
If the index rises towards the supply zone, which is also at the intersection with the weekly pivot and the midline of the channel, you can look for sell positions in the Nasdaq index
A valid breakout of the downward drawn Fibonacci retracement will provide a downward path for the indicator to the specified support area and then the bottom of the ascending channel
NFP bullish or not?NFP is in sideways range if btc take momentum then it will take breakout & give good bullish momentum.
dont take entry now just wait for breakout or breakdown

Gold NFP potential corrections / retracement key levelsIf FED will not disappoints market with a 50bps market pricing in rate cut, then some key levels are plotted that is due for corrections / retracement.
Later all eyes will focus on Powell speech whether he will take an aggressive approach for November FOMC.

USD/JPY drops below 141, US CPI drops to 2.5%The Japanese yen has extended its gains on Wednesday. USD/JPY fell as low as 140.70, its lowest level this year, before paring much of the losses. In the North American session, USD/JPY is trading at 141.71 at the time of writing, down 0.52% on the day.
The hotly-anticipated US inflation report didn’t shake up the markets as it was pretty much as advertised. Headline CPI eased to 2.5% y/y in August, down from 2.9% in July and matching expectations. This was the fifth straight decline in headline inflation.
Monthly, CPI was unchanged at 0.2%, in line with the market estimate. Core CPI was unchanged at 3.2% y/y, matching the market estimate. Monthly, the core rate ticked up to 0.3%, up from the July gain of 0.2% and the market estimate of 0.2%.
The inflation report comes just one week before the Federal Reserve meeting on Sept. 18. Market rate cut odds have been swinging wildly as it remains unclear whether the Fed will cut by a modest 25 basis points or a jumbo 50-bps cut.
The odds of a 50-bps move surged to 59% after the soft nonfarm payroll report on Friday, but were down to 27% just prior to today’s inflation report and have fallen to 15% following the release, according to the CME’s FedWatch. This puts the likelihood of a 25-bps cut at 85%, although we’re likely to see the odds continue to shift in the days ahead.
The Bank of Japan meets on Sept. 20, two days after the Fed meeting. The BoJ is looking to continue tightening but will likely stay on the sidelines next week, as BoJ officials have ruled out a rate hike while the financial markets are unsteady. That could mean that the BoJ will push off a rate hike until December or January.
USD/JPY tested support at 141.54 earlier. Below, there is support at 140.79
There is resistance at 142.80 and 143.31
