For Alt HoldersIf You Are Holding Alt Coins and You Are In Loss At This Time Don't Panic and Sell Your Holdings In Loss Wait For The Mega Pump In BTC and Your alt Will Move With BTC Just Like LINA Pumped 50% in last 3 Days. If You Are At a Loss I Suggest you Buy More When the Coin recovers You Will Make a Profit And ALso Recover Loses. Happy Trading BY
Nft

OGN Bullish Flag PatternHello Traders
OGN is very bullish.
Good fundamentals and huge buy volumes in last few weeks made a good rally.
Also it had a good correction and right now price seems created a bullish flag pattern that could push the price to 1.09 - 1.19 $ per token.
Like, Follow and Share Please.
Stay Safe.
Thanks For Reading.
-RC

Apecoin update Watching $17Bounce from $11. We could be in a wave B retesting a high. if it breaks past $17 we could be in a 3 wave going to $20+. If not. We're coming back to $11.67 support

APECOIN IS ON STEROID TO THE NORTH.Apecoin has been on steroid since 18th of April. However, the momentum has been massive the past few hours.
This asset is currently resting around FIB23.6 level as support zone. I do believe that this rally may not be sustainable for long.
I am waiting to short this asset from my orange circle spot and I am looking forward to riding it down to where I feel the price is sustainable I.e $13.6 - 13.4 zone.
KINDLY: share your thoughts, comment, Criticise, FOLLOW AND LIKE.

Polydoge Long onlyPolydoge gaining huge demands and its simply goes to these goals if you have patience..buy now and hold it for next coming bull run and simply you make 50X from here sell half at 50X and hold the rest for moon till goes to shiba and doge level.. you cant belive chart ? Then just go to their twitter...metaverse.nft

$BLOCK ascending wedgeblockasset is moving inside an ascending wedge where at the end of it it will most likely try to exit the wedge by a breakout, which in my vision is going to be upwards.
for now im out of the market, will take decision in a month moreless

SPX: Macroeconomic 101It have been months since I have posted an update in TradingView, today I will be discussing 101 of macroeconomics which will help to understand the relationship between Monetary Policy, Cashflow and inflation without making it super complicated.
1- Cashflow:
Big money flow which interest go, as simple and as complicated as it seems. Instead of looking at currencies as purchasing items, we can look at them as exchanging items, for example when you try to buy an car, you are exchanging a car for x amount of USD, and when you are selling the car again, you are exchanging the car for X amount of money.
Big money usually will try to find the highest interest on the currencies they have while considering the risk of safety to get their cash back, when central bank decrease interest rates which mean keeping money in banks will get investors or cash holders less return on their money than before, that is why there will be sale of currencies and buying of commodities/stock/business/investments that is expected to provide a higher return than banks.
2- Monetary policy and Interest rates:
The purpose of interest rates changes are to control inflation rates, low interest rate promote more loans to be taken and less deposits with banks, low interest rate will make the market environment to be more creative in order to create income more than what the interest on loans are, this will help companies to grow and money to cycle in markets more than bonds and deposits. Hence, the less interest rate, the more likely spending increase which as a result prices will grow. This help central banks achieve their objectives or steady growth and maximising employments.
3- Inflation:
When the market get heated and purchasing power is strong, it is normal for the purpose of balancing supply and demand in the market for prices to increase, every sector will be impacted differently. When inflation increase to a level that effect normal average consumer, central banks need to encounter this inflation increase by trying to reduce market activities, this will be done by increasing interest rates, when interest rate increase, money will flow from risky investments to less risky once as they provide a higher interest, which as a result will reduce the activities across economies and will motivate less spendings, spendings will be exchanged with demand on currencies which will increase demand on USD (USD will increase), which in line will make bonds prices to drop (yields to increase). As we are also noticing that FED are trying to reduce QE in markets as to reduce risk of inflation.
When we factor in the current geopolitical matters, I will expect the SPX to continue moving sideways or downside, good opportunity for buying groceries at discounted prices for long term portfolio, I will be a gradual buyer as there is an element of uncertainty related to the countries decisions in regard to economics, globalisation and geopolitics.
Buying great companies at fair price is BETTER than buying cheap companies at great price.
Until next time,
AgentH

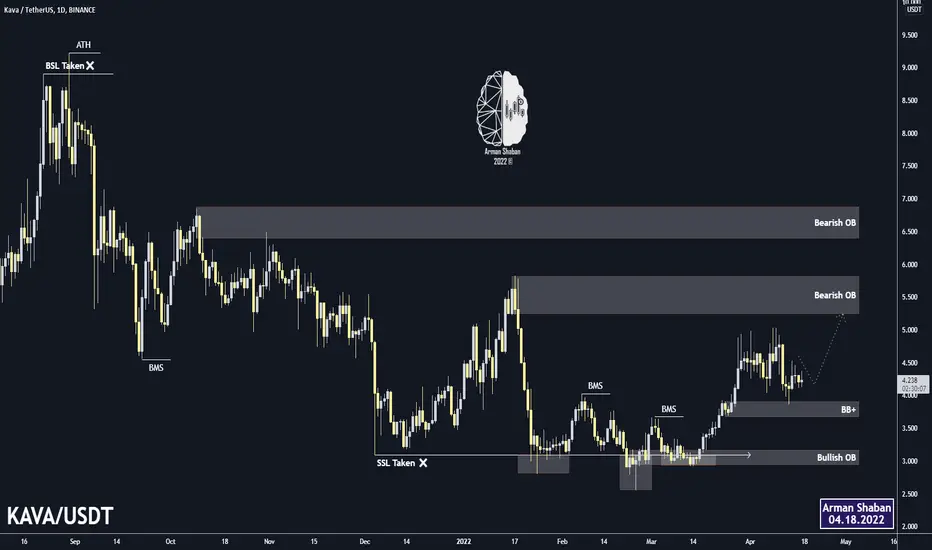
KAVA : Daily TA : 04.18.22 (IO)Technical analysis of #KAVA 's chart and its appealing ranges . Let's take a look at some of the high-potential cryptocurrencies in the market for investment, as you can see all the supports, resistances, targets, etc. are marked on the chart. Pay special attention to the specified levels that i mentioned in the chart . I think everything is obvious in the chart , but just in case if you had any questions pls feel free to ask .
Follow us for more analysis & Feel free to ask any questions you have, we are here to help.
⚠️ This Analysis will be updated ...
👤 Arman Shaban : @ArmanShabanTrading
📅 04.18.2022
⚠️(DYOR)
❤️ If you apperciate my work , Please like and comment , It Keeps me motivated to do better ❤️
Alice Hugh Market buying potentialAs we have recently seen the alt season few weeks back, and the market is currently making an support so if we can hot this level in comin g weeks hugh potential to go up wards

Bitcoin - BTC lacks a trend at the momentAfter reaching our price target of 40 000 USD, we predicted a temporary bottom for Bitcoin. We suggested that the price of BTCUSD might be setting itself for sideways price action. That has been the case for the past week. The prevailing trend in Bitcoin weakened even further, and volume declined. In the short term, we remain neutral on BTCUSD. However, in the medium term, we remain inclined towards the bearish scenario. Despite that, we decided not to set any price target for BTCUSD, mainly due to a lack of momentum within the prevailing trend. Although, we think Bitcoin is likely to drop to 35 000 USD (and possibly lower) if the general stock market continues lower (or if BTC sees more decoupling in the positive correlation between the two). We also see additional pressure for the higher price of BTC from the FED and higher interest rates.
Technical analysis - daily time frame
RSI is neutral. MACD is bearish, and Stochastic is bullish. Although, Stochastic oscillates in the bearish area. DM+ and DM- are bearish. Meanwhile, ADX declines, which suggests the prevailing trend is weakening. Overall, the daily time frame is neutral.
Illustration 1.01
The image shows the daily chart of BTCUSD and two simple moving averages. It can be observed that moving averages started to produce whipsaws shortly after BTCUSD started to trend sideways. In addition, the recent false breakout above the short-term resistance is also indicated.
Technical analysis - weekly time frame
RSI is bearish. MACD failed to continue higher and penetrate through 0 points into the bullish zone; instead, it started to flatten and reverse to the downside. Stochastic also reversed to the downside, which is bearish. DM+ and DM- indicate bearish conditions in the market. At the same time, ADX suggests the prevailing trend is very weak, which is reflected in the recent sideways moving price action. Overall, the weekly time frame is bearish but lacks momentum in trend.
Please feel free to express your ideas and thoughts in the comment section.
DISCLAIMER: This analysis is not intended to encourage any buying or selling of any particular securities. Furthermore, it should not serve as a basis for taking any trade action by an individual investor. Therefore, your own due diligence is highly advised before entering a trade.

EVERDOME AnalysisOverall, a very interesting metaverse project. Highly speculative, but could 100X in the future if it picks up steam. I believe it takes out liquidity below, near the .7 origin golden pocket Fibonacci level before bigger players start investing. Not investment advice, simply writing down my thoughts.

Solana may have a vood posotionNever follow my path but look at my idea . I do risk may kill you . But i perfer to die and risk at what i feel is good
Solana is in good location to rise . So a used 10k as you see . I xont know what will happen but i want to play .
This coin is going to be part of nft world . Follow the nft news and then choose your side.

CHF/JPY - ShortPotential expanding Diagonal implying impulse is towards the downside, currently retracing - ideal level to short w/ a clear invalidation level

Next stop for $zil #zilliqa is .097?Looking like continuation of a downward trend? If Zilliqa can not break here we are going down? Looks like .097? Then even lower to .04? NFA

Bitcoin 4H TA : 04.12.22 (Update)As you can see, last night the price broke the 40K level and entered the $ 39,000 channel, which is a very important range of the Bullish OrderBlock . One scenario is an uptrend from this range to $ 42,000, and the second scenario is to raise liquidity under strong support at $ 37,000 and then move on to $ 42,000.
Follow us for more analysis & Feel free to ask any questions you have, we are here to help.
⚠️ This Analysis will be updated ...
👤 Arman Shaban : @ArmanShabanTrading
📅 04.12.2022
⚠️(DYOR)
❤️ If you apperciate my work , Please like and comment , It Keeps me motivated to do better ❤️

ATOMUSDTinto bullish channel going to the down line of channel and dynamic and static resistance.it can come back from PRZ zone and its short target can be up line of range short channel.

NHCT Ready for Moon!?Hurricane NFT Market is a cross-chain NFT trading platform launched by HurricaneSwap. It is the first cross-chain NFT trading protocol based on Avalanche. It was born to solve NFT cross-chain transactions in different ecosystems, and is currently the only cross-chain transaction platform that has been implemented. It will support cross-chain NFT transactions on multiple chains such as Ethereum, BSC, Avalanche, Fantom and Polygon.
What can I do now? if you are interested NFTs, I think this project could be good for investment! but be careful cuz this is my opinion!
this is my Idea, I think it is the first Idea in tradingview! I hope this helps you.

Bitcoin 4H TA : 04.11.22 (Update)Examining the Bitcoin chart in the 4-hour timeframe, we see that after losing support at $ 42,700 the price hit all the bearish targets , respectively . Note that currently the support in the range of $ 40140 to $ 41400 is one of the most important price supports, and if this level can not maintain the price, we must wait for the price correction to $ 39000! This analysis will be updated.
Follow us for more analysis & Feel free to ask any questions you have, we are here to help.
⚠️ This Analysis will be updated ...
👤 Arman Shaban : @ArmanShabanTrading
📅 04.11.2022
⚠️(DYOR)
❤️ If you apperciate my work , Please like and comment , It Keeps me motivated to do better ❤️

SOLANA BuyHey Colleagues,
Today we came across SOLUSDT. We see a great opportunity for this coin to show some bullish candles in the coming period around 110 Level.
If you like ideas provided by our team you can show us your support by liking and commenting.
Yours Sincerely,
Tournesol Team
Disclamer:
We are not financial advisors. The content that we share on this website are for educational purposes and are our own personal opinions.

BITCOIN – CASH: Inside Bar PatternBITCOIN (BTCUSD) – CASH: Inside Bar Pattern
(WARNING NOTE ON CRYPTO CURRENCY: As Bitcoin and crypto currency doesn’t form perfectly clean signals most of the time, we will only annotate the clearest and well-pronounced signals that form at confluent areas on the charts. Therefore not all price action signals/patterns will be annotated or discussed. TRADING BITCOIN AND CRYPTO IS HIGH RISK, CONSIDER A REDUCED POSITION SIZE UNTIL YOU ARE FAMILIAR WITH THESE MARKETS).
Price Action: Price formed an Inside Bar Pattern right at the 42600 level, late last week.
Potential Trade Idea 1: For aggressive traders, we are considering selling on a breakdown below the current Inside Bar Pattern.
Potential Trade Idea 2: We are considering buying on a deeper retracement lower and after a price action signal on the daily or 4 hourly chart time frame, within the 34300 to 37550 support range (prior Event Zone).

NFTUSDT UPDATE WITH NEW STYLE >_-
NFTUSDT has broken a essential bearish trend and seems the correction wave (C) is done. Looking forward to see some good jumps ( if the btc doesn't resist! )

SAND - inside a triangle
SAND :
SAND :
The price is moving inside a triangle.
Crossing the trend line will determine the route ...

Origin Big Correction We are looking for a big correction on OGN. It's massive run up recently was unexpected and appears to be whales pumping and then unloading. The project is currently over extended and appears to be heading back towards the 20 and 50 MA's. We are looking for price to return to 47 and 41 cent region and 36 cents as the third level of market structure.
