SIGNIFICANT SUPPORT FOR NFT !!!-----------------------
-----------------------
The NFT currency has reached its most important support due to the recent sharp and significant market collapse. The above scenario is just a possibility and assumption and will be done if the bitcoin correction process is completed.
-----------------------
*Sl: daily candle closed under the 0.000001555
-----------------------
Nft

$BTC Bitcoin levelsBitcoin weekly is still respecting short term down trend resistance line. Approaching critical support $30,000 zone would be a good place to trade LONG anticipating demand uptick and bounce.
However, so long as BTC is unable to break the resistance line, sellers are in control and every rally is just another opportunity to sell/go short into.
I like the idea of $30K target to start going long, but other than that no trade for me here until on of the key levels is reached.

$SOL < $100 - Market Value <$30B PROVES MKTS NOT EFFICIENT
$WEN200!
Solana remains the fastest growing ecosystems with DEFI protocols, gaming and NFT. Current pricing pressure is exacerbated by leverage players. Platform revenue approximates $20.0 million for the last 3 months.

ANOTHER METAVERSE CONTENDER CONFIRMING A BREAKOUT!Evening folks or whatever time it is in your zone.
Chart above is Bluzelle (BLZ) and it looks primed for a breakout.
For confirmation we need to close the current weekly candle above the resistance, do that and we'll probably get a retest or S/R flip if you will before going further to the upside.
I strongly believe in this project coupled with the fact that its in the gaming sector of crypto along with their recent tweet a couple days ago saying they just joined the metaverse, I expect this to run hard.
$1 for the 3rd wave (green) and $2+ for the 5th wave(green) to complete the 3rd grandcycle impulse wave.
Let me hear your thoughts in the comments section.

BTCUSD - Extremely BullishWe made a high of around 65k on BTC in 2021. Since then BTC has been rangebound between 30000 and 60000. Although markets can turn around at 30000 levels once again. As a trader, I would like bitcoin to hit the liquidity pool at 18000 level. I've been waiting for it since the last fall, It didn't. Trapped many at fake highs above 62000. Markets are risky, And this ain't an investment advice of any sort.

LRC dip buy for big Gainz!!!I am looking to buy LRC @ .75 and hold for a big rip! If we dip buy before the GME announcement we could get a favorable entry price before a big pump, keep your eyes peeled!

GBPUSD AnalysisGBPUSD Analysis. Levels are listed. Zones are listed. Directional bias for GBPUSD is short.


Why BTC will reach 10kIn this video, I explain why BTC will eventually reach sub 20k levels.
BTC likes to drop 85% from all-time highs, we've seen this in 2013 and in 2017.
Adding to that, the current head and shoulder playing out measures a price target to 10k, which is exactly 85% from all-time highs.
Coincidence? I think not.
So what do we do now?
Work hard and save cash.
You don't want to exhaust your cash buying every little dip.
Share your ideas and let us know what you think.

Where is the #DAO # ENS on rocky ground ENS is on rocky ground...if this slide continues then goes to sub $10.00
While an exciting premised to bring web3 to the "world" by decentralised naming for wallets and websites. The recent twitter identity crusade may very well handicap the protocol plans at the individual level.

ALICE LongCoin: Alice
Type of signal : Spot
Entry Price : 9.5$-10.50$
Price now : 10.25$
Goals:
Tp1 10.90$
Tp2 11.35$
Tp3 12.10$
Tp4 13.53$
Long-Term
16.5$-18$-21$-24$-27$
SL Daily Candle under 8.40$

VEMPUSDT to the LONG vEmpire is the largest decentralized Metaverse & GameFi investor. Combat game set in ancient Rome within The Sandbox virtual world platform. NFT investors, virtual lands, civilized marketplaces with items like foodstuffs, weapons, animals atc..
Great time to buy at a discounted price, even before the expected pump.

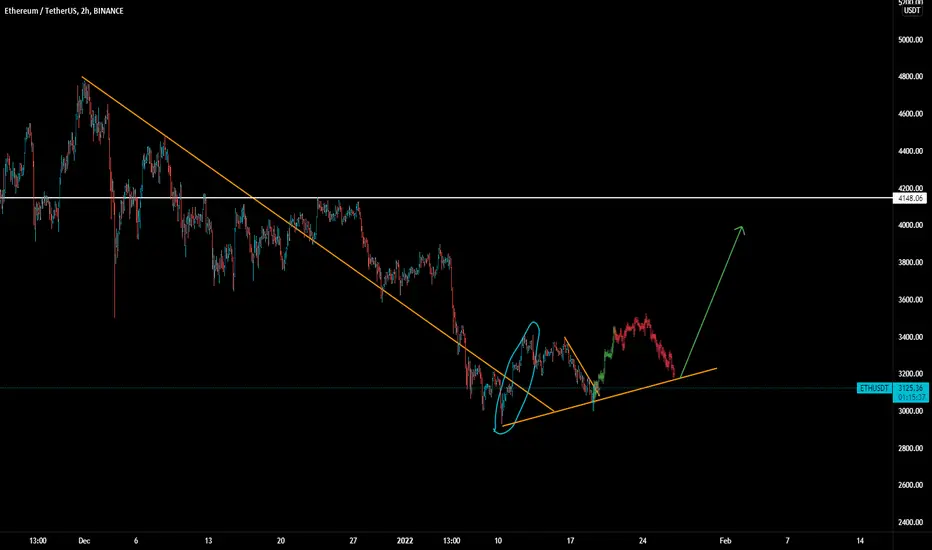
Ethereum FractalEthereum could be making the same play here as last week.
Double bottom on the trend line would most likely lead the price to a critical supply area at the 4100$ level.
SOLANA LongHey traders, in today's trading session we are monitoring SOLUSDT for a buying opportunity around 136 zone, once we will receive any bullish confirmation the trade will be executed.
Trade safe, Joe.

ENJIN COIN RE-ANALYSIS (GLOBAL TARGETS)In our last Enjin coin analysis, we talked about how the price could go up to $6 dollars.
Today we will be talking about higher targets in our re-analysis.
Visit the previous analysis for inights(will also be linked below)
As we can see, price action is in a large ascending channel, one which price has continuously respected on each touch
Currently in a larger degree ABC correction wave (wave 4 correction wave) we can see that price hasn't yet touched the 0.618 fib level of our wave AB, which should be the first step to determining which type of correction we're currently in.
Wait for price to come back down to the .618 region before making any buys, and wait for the touch of the channel support before going long.
If you agree leave a like and share your thoughts and views in the comments.
Feedback is always appreciated.

Chromia : Metaverse 2022 🎉Chromia is a project designed to combine the best of two worlds: the convenience and reliability of relational databases and the cryptography-based security of blockchain.
I believe that this gives the project strong fundamentals and a promising future.

Very bulliah chartAPENFT has been trap in an accumulation box with %60 chance of breaking to the upside.
you can take the trade with the stoploss below the yellow line

FTM/USDT Still 90% Potential from here..?#FTM/USDT
$FTM trading at $2.77
As per our Last $FTM chart.
Did 20% profit and after hit Stop Loss.
Now Let’s see this support hold or not.
But I will buy at this support level.
Best Entry:- $2.60-$2.70
Targets:- $3.12/$4/$5
Stop Loss:- Below White Dark Line.
$FTM dumped After Fakeout.
So That was Big Fake-out but we booked Profit at Top.
Support:- $2.60
Resistance:- $3.10

Cardano rallies ahead of SundaeSwap launchAfter providing the roadmap for 2022, the ADA (Cardano) token has increased in price quite impulsively. Its price surged to just over $1.60 on Tuesday from Sunday’s lows of $1.28, before retreating to $1.48.
The growth was stopped at $1.60, which intersects with the dynamic resistance line of the downtrend. Given that the crypto market is currently under pressure, there is a possibility of a retest of the support level, which is at around $ 1.10.
But most likely, we will see this level again, since it has repeatedly demonstrated stability. After the formation of the "Double Bottom" technical analysis figure, there is a possibility of recovery and growth to an important resistance level at $1.80. This level has also repeatedly prevented the price from going up, but against the background of positive events within the project, there may be a breakdown of resistance and a reversal of the downtrend.
2021 was an important year for Cardano demonstrating a performance of +691% and outperforming both Bitcoin and Ethereum with performances 75% and 453% respectively, according to CoinMarketCap. Analysts predict a strong 2022, supported by Cardano’s recent developments in decentralised finance, non-fungible tokens and the metaverse, as well as progress on scaling. Specifically, Cardano's price has surged ahead of the launch of an upcoming cryptocurrency exchange called SundaeSwap.
Moreover, Cardano-based NFTs are now entering the NFT space with projects like Clay Mates, Yummi Universe, Spacebudz, Pavia, and Cardano Kidz.

GME to $50 SupportUpdating monthly chart trade from before. We have hit the first monthly MA support. I think its inevitable we go lower to the lower MA for support which coincidentally aligns with the $50 resistance range that may now become support. Judging by the timeline it could be another year before any kind of MOASS, which is good for any long term holders. Good luck!

cardano ADA technical chart analysis how to time the market.1) Daily chart 12 month horizon chart
2) $1.10 major support line every time it bounce back upward since 12 months (entry zone )
3) $1.65 resistance if this channel breaks bullish
4) 100 day moving avg $1.65 breaks bullish sign
5) sloping resistance breaks $1.65 bullish sign
6) Exit zone $2.30 resistance
7) this chart is for educational purpose only not a financial advise.

Royalties, The Hidden Gold Mine in CryptoDecentraland (MANA) has recently added royalties payments to their wearables market -- it might seem like a small thing right now, but testing out economies in "for fun", low-risk products like avatars pave the way towards more serious applications like NFTs, copyright, and asset markets later on.
Right now, the crypto community is still unlearning the bad habits of Web 2, which is one-off NFT sales boosted by marketing and/or celebrity status in exchange for short-term gains. But that is not where the real money is -- the combined amount of the small business communities will outshine any of the current projects a 100x (literally) if they can get the ecosystem running correctly. The secret to crypto mainstream adoption is figuring out how partnership/distribution deals can be automated in a fair, clear way and the ones that figure it out will take the whole pie, imo.
More detailed post, here:
mirror.xyz
