Immutable X ETH gas fee solution!!As a project looking fookin tasty you can buy and forget :)
here you can check out: www.immutable.com
42.5 inventment it got before listing on market. It has nft market on it which have some agreement with play to earn games like: www.illuvium.io
godsunchained.com
In these games, players can sell their nfts on ethereum blockchain with out paying any fee.
Nft

META HERO (HERO) Hey fam.
If you are looking to buy into META HERO, have a quick look, for an hourly entry and also a small warning as for what to expect if the graph breaks down.
Personally, this Metaverse project looks insane.
NFTs are being minted.
CEX are being listed this quarter.
New Website.
and the list goes on and on and on.
I am not investing according to my overall portfolio, but yeah, this looks good in the short term and I think from looking at their website and roadmap, it will do very well/ will continue to do very well, from here.
That's all again, from your friendly Cafe on Glenferrie. LE CLEC.

$BBIG -- OMG plz make it stop.if we lose 2.80 on D/W/M timeframes, the downside isn't over. :( sorry friends.
It's a bummer that Ted couldn't muster any compelling PR to preserve shareholder value in the near term. oh well.
good luck, go with god.
psc
*there is no god

Talk on the street is ETHI'm not a big fan of ETH (right now) because it's fundamentals have been less than impressive with the ETH2.0 merge not expected until 2023 and gas prices being insane right now due to NFT demand causing such high transaction volume on the chain. With that being said there's been a lot of talk about it getting ready for a big move by some amazing traders and if we look at the dominance charts you can see why they are thinking this.

ZKIN - Worth taking a look at, potential NFT playNice reversal off this back test. I can see this running to 30+ in 2022 due to NFT hype. (MaximNFT is their subsidiery)
Budweiser just dropped their NFT, VISA purchases a cryptopunk. The mania hasn't even started yet ::EYES::

CUBE Somnium Space Cubes Price ActionHello friends, today you can review the technical analysis on the 4H linear scale chart for Somnium Space Cubes ( CUBEUSD ), an altcoin cryptocurrency.
#CryptoPickk noted in the chart:
1) The Somnium Space Cubes price has been in a triangle pattern since early November 2021. The price is approaching the apex of the triangle pattern.
2) There is also a rising broadening wedge pattern also noted with the red line forming within the triangle pattern.
3) The price has the potential to re-test the bottom of the trendline which meets the 0.236 Fibonacci Retracement level before a nice move upwards. Keep an eye on the $17-$18 range.
4) The RSI (relative strength index) has been supported by a bottom trendline and has potential to re-test it again. This is outlined with the red circle on the RSI chart.
5) The Stochastic RSI (Stoch RSI) is hovering in the overbought region but based on prior trends, it may complete a double top before going back down. However it has potential to go straight down as well, which would bring the price down accordingly.
6) The Volume is low, which may be the reason why a sizable move is coming soon.
7) If the price breaks up out of the triangle pattern, keep an eye on the re-test around the $21-$22 range (where the 0.618 Fib level is) before moving higher.
What are your opinions on this?
If you enjoy my ideas, feel free to like it and drop in a comment. I love reading your comments below.
Disclosure: This is just my opinion and not any type of financial advice. I enjoy charting and discussing technical analysis. Don't trade based on my advice. Do your own research! #cryptopickk

$MBOX goes to BINANCE #MBOX GOES TO BINANCE .... The game has farming, fighting and an NFT marketplace...more importantly, its rocketing north of 30% in a tepid crypto day...What's not to like?

MANA USDT 2H Here's how I would trade MANA / USDT 2H:
If the price breaks the upper line of the triangle - I recommend that you wait for a solid confirmation - then enter a long position.
Take profit ideas:
Entry point - approx 5.03$
TG1 - 5.2$
TG2 - 5.4$
TG3 - 5.6$
TG4 - 5.7$
TG5 - 6.4$
------------------
I keep it simple and clean!
Likes, comments, and follows are dearly appreciated.
Let me know what you think and which ones you would like for me to analyze next.
Trade safely!
------------------
About Decentraland:
"Decentraland (MANA) defines itself as a virtual reality platform powered by the Ethereum blockchain that allows users to create, experience, and monetize content and applications.
In this virtual world, users purchase plots of land that they can later navigate, build upon and monetize.
Decentraland was launched following a $24 million initial coin offering (ICO) that was conducted in 2017. The virtual world launched its closed beta in 2019 and opened to the public in February 2020. Since then, users have created a wide range of experiences on their parcels of LAND, including interactive games, sprawling 3D scenes and a variety of other interactive experiences.
Decentraland uses two tokens: MANA and LAND. MANA is an ERC-20 token that must be burned to acquire non-fungible ERC-721 LAND tokens. MANA tokens can also be used to pay for a range of avatars, wearables, names, and more on the Decentraland marketplace."
Source: Coinmarketcap.com

Dogs Of Elon is in the demand zoneDogs Of Elon is in the demand zone, we are pretty much oversold on the daily chart and we've had a drop very similar to Shiba.

Binance: CAKE-USDT Buy / Long D1Binance: CAKE-USDT Buy / Long D1
Entry: 14.2$
Stoploss: D1 close below 11.5$
Target: 26$ and hold longtern 40$
Pancakeswap is a diverse product set that turns Pancakeswap into a true DeFi station on the Binance Smart Chain ecosystem.
Trade: Trade and generate LP tokens to provide liquidity.
Farms: Yield Farming with an extremely large number of pools (the liquidity center of the BSC system).
Pools: Stake CAKE to receive CAKE or other tokens in the BSC system.
Predictions: A mechanism that predicts the rise and fall of asset pairs over a certain period of time.
Lottery: Lottery game on Pancakeswap.
Collectibles: Collect NFT items.
Team Battle: A program to participate in trading between groups and ranked based on trading volume.
IFO: Initial Farm Offering is the IDO Platform for new projects on the BSC system.

Binance: SUPER-USDT Buy / Long 1D
Binance: SUPER-USDT Buy / Long 1D
SUPER-USDT uptrend D1
Entry : 1.8$-1.85$
Stoploss: 1D close below 1.45$
Target : 2.7$
SuperFarm is a cross-chain DeFi protocol designed to bring utility to any token by turning it into an NFT farm with no code required. With an innovative suite of visual tools, any project can now deploy the world’s most exciting new farm with custom rules that incentivize the behaviors they value most. It’s easy to reward liquidity providers, incentivize longer stakes or even provide special access to your project’s services through NFTs with utility.
SuperFarm provides a simple set of building blocks that can empower any project to add new utility to their tokens and connect to mainstream products

₿ ANTUSDT 1D ₿ : 29.Nov.2021 (ANT)This is a Chart review and The possible trend of #ANTUSDT . Everything is Clear on the Chart , but just in case if you had any question , Please Ask ...
Follow our other analysis & Feel free to ask any questions you have, we are here to help.
⚠️ This Analysis will be updated ...
👤 Arman Shaban : @Ar_M_An_4
📅 29.Nov.2021
⚠️(DYOR)
❤️ To give us energy and motivation , please like and leave a comment. ❤️


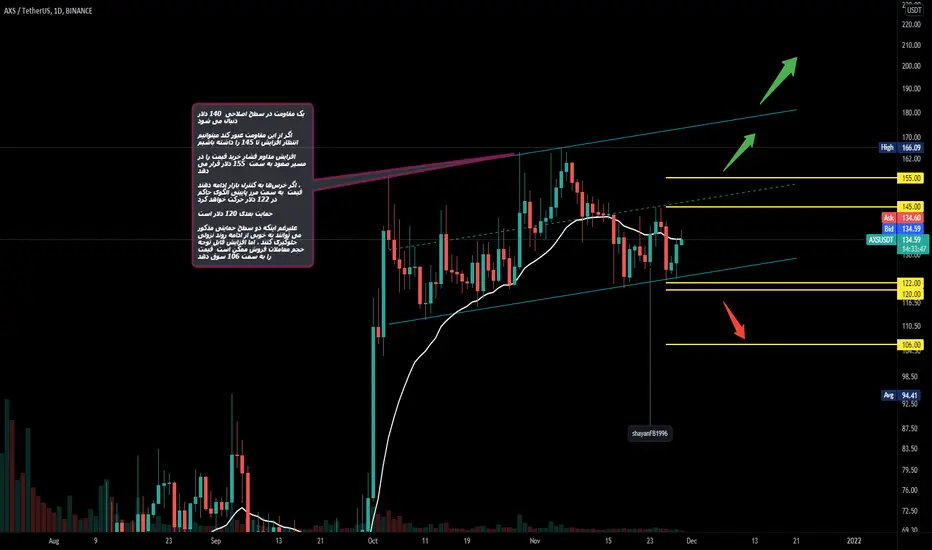
AXSUSDt 1DHi everyone
A resistance level of $ 140 is followed
If this resistance passes, we can expect an increase to 145
The steady rise in buying pressure puts the price on the path to $ 155
If the bears continue to control the market, the price will move to the lower limit of the prevailing pattern at $ 122
The next support is $ 120
Although these two support levels could well prevent a downward trend, a significant increase in sales volume may push the price towards 106
₿ MBOXUSDT 1D ₿ : 29.Nov.2021 (MBOX)This is a Chart review and The possible trend of #MBOXUSDT . Everything is Clear on the Chart , but just in case if you had any question , Please Ask ...
Follow our other analysis & Feel free to ask any questions you have, we are here to help.
⚠️ This Analysis will be updated ...
👤 Arman Shaban : @Ar_M_An_4
📅 29.Nov.2021
⚠️(DYOR)
❤️ To give us energy and motivation , please like and leave a comment. ❤️

NFT/USDT triangle Hello dear traders ! Apenft is fundamentally a huge project with exiting roadmap ! For technical analysis we can see how we bounced out of resistance and ready to finally break out and go the moon !

OMI SHORT-TERM LONG ECOMI NFTNot bad Gartley pattern, my target for short-term is definitely pink box, lets see how this goes

ECOMI OMI Possible bearish H&SAlthough bullish on the long term, i can see a possible formation of a head & shoulder formation , which if validated would take us to 0.0049 ish levels... let's see

🏂GEMHUNTING #2: The Crypto Prophecies: 200EMA/dynamic supportWelcome to the second episode of my #GEMHUNTING series where I look for micro-cap coins with both good looking chart & fundamentals.
The chart looks good. Although the price broke above horizonal resistance and did not manage to hold above this area, it came back down and entered the zone of strong support confluence. Major support (green) is also close, but has not been touched yet. It seems like the price may have formed an ascending wedge, but it's gonna take a while until we see a potential squeeze. The upper trendline of the formation is also over 300% away so that's good enough.
I went over their website, whitepaper and everything looks good. The game is being constantly developed, the devs are posting a lot of updates and interact with community. The game runs on Polygon(MATIC)
Current market cap: $13,960,588
Let's compare The Crypto Prophecies to a similar project with much bigger market cap:
"If The Crypto Prophecies had Axie Infinity's market cap of $8.7B, 1 TCP would be worth $107.32, an upside of 614x" // Source: coinperspective
Targets:
0.20
0.25
0.2754 (local level)
0.31
0.39
0.45
0.55
ATH+
-- if things go right possible long-term hodl with no specific targets --
-----------------------
About TCP:
The Crypto Prophecies is a decentralised peer-to-peer price prediction game that uses NFT characters called Crypto Prophets.
Place your wager and go head-to-head with other players to battle it out over the candles, predicting how each one will close. It’s a real-time points based game and it’s against the clock, so be quick with your predictions and watch out for your opponents magic spells!
Source: morioh

ENJ/BTC Long Metaverse NFT Gaming trendAs you can see it the chart, ENJ has a long side way of accumulation zone with btc pair. Last peak of ENJ/BTC is at Mar2019 and try to break resistance again at Apr2021 but both are fail.
Now, We have a first green weekly candle that can stand above resistance (5200 satoshi). (First time)!!!
Metaverse, Gamefi and NFT is a mega trend now and enjin team always focus to integrate all of them.Therefore, It is very interesting to watch out ENJ very very closely.
My theory of enjin movement is
1. Test resistance again by touching around 5200 satoshi and bounce to ATH ( Most likely)
2. Break second resistance (7000 satoshi) weekly green candle has to stand above second resistance(7000 satoshi).
3. Fail break out and back to accumulate zone again. If weekly candle is under 5000 satoshi, I may decide to cut loss.
Hope to get 3-5x like mana and sand did.

COCOS / USDT 2H - Bull Pennant pattern (UPDATED)UPDATE ON PREVIOUS CHART: I have updated my analysis on COCOS / USDT. This time I have set the entry point to approx 4.5$. I have also chosen a slightly bigger time frame - the 2H time frame - as I expect some bigger moves upwards. Currently, COCOS has a total market cap of 162m Dollars, which is why I expect an aggressive move upwards, IF the price should break out of pennant.
Lastly, I spot a double bottom formation within the triangle, which could further strengthen the notion that the price will continue its move to the upside.
Price has been consolidating, ultimately creating a bull pennant pattern. The bull pennant pattern will most likely continue the upside pattern. Also, note that the volume has been steaming off. We will see a significant increase in volume if a breakout should occur. COCOS has been performing like a beast. Will we eventually see a strong move upwards?
If the price breaks the upper line of the pennant - I recommend that you wait for a solid confirmation - then enter a long position.
Take profit ideas:
TG1 - 4.79$
TG2 - 5$
TG3 - 5.38$
TG4 - 5.75$
TG5 - 6.46$
TG6 - 10$
------------------
I keep it simple and clean!
Likes, comments, and follows are dearly appreciated.
Let me know what you think and which ones you would like for me to analyze next.
Trade safely!
------------------
About COCOS:
"Cocos-BCX is a public blockchain platform aiming to create a complete run-time environment for games with multi-game system compatibility, providing game developers a user-friendly platform for blockchain game development. In addition, Cocos-BCX aspires to bring users complete control and transparency over in-game virtual assets. It is building a development environment with gaming experience and game economics in mind. Game developers can easily migrate conventional games to the blockchain without the need to learn blockchain programming languages."
Source: Binance

NAS100 AnalysisNAS100 Analysis. Weekly and daily is short; monthly has a directional bias of short but candle is green. Zones are posted. FIB Extension shows you the levels we may reach when the ATH is broken.

COCOS / USDT 1H - Bull pennant, loading up strong move?COCOS / USDT 1H. Price has been consolidating, ultimately creating a bull pennant pattern. The bull pennant pattern will most likely continue the upside pattern. Also, note that the volume has been steaming off. We will see a significant increase in volume if a breakout should occur. COCOS has been performing like a beast. Will we eventually see a strong move upwards?
If the price breaks the upper line of the pennant - I recommend that you wait for a solid confirmation - then enter a long position.
Take profit ideas:
TG1 - 4$
TG2 - 4.7$
TG3 - 4.77$
TG4 - 5$
TG5 - 5.38$
TG6 - 5.75$
TG7 - 6.1$
TG8 - 6.5$
------------------
I keep it simple and clean!
Likes, comments, and follows are dearly appreciated.
Let me know what you think and which ones you would like for me to analyze next.
Trade safely!
------------------
About COCOS:
"Cocos-BCX is a public blockchain platform aiming to create a complete run-time environment for games with multi-game system compatibility, providing game developers a user-friendly platform for blockchain game development. In addition, Cocos-BCX aspires to bring users complete control and transparency over in-game virtual assets.It is building a development environment with gaming experience and game economics in mind. Game developers can easily migrate conventional games to the blockchain without the need to learn blockchain programming languages."
Source: Binance
