Potential Decline of Natural Gas Prices to $2.43–$2.74Brief Overview of Events and News Explaining the Potential Decline of Natural Gas Prices to $2.43–$2.74.
➖ Weather Forecast and Reduced Demand
On April 23, 2025, the U.S. National Weather Service forecasted milder-than-average weather across the U.S. for late spring and early summer 2025, particularly in key gas-consuming regions like the Northeast and Midwest.
Warmer weather reduces the demand for heating, a primary driver of natural gas consumption. This led to a 2.5% decline in Henry Hub natural gas futures, settling at $3.05 per MMBtu on April 24, 2025.
Source: Reuters
➖ High U.S. Natural Gas Inventories
The U.S. Energy Information Administration (EIA) reported on April 17, 2025, that natural gas inventories increased by 75 billion cubic feet (Bcf) for the week ending April 11, 2025, significantly exceeding the five-year average build of 50 Bcf. Total U.S. inventories are now 20% above the five-year average, indicating an oversupply that pressures prices downward.
Source: EIA, "Weekly Natural Gas Storage Report," April 17, 2025
➖ Weak Global LNG Demand
On April 22, 2025, Bloomberg reported a decline in demand for liquefied natural gas (LNG) in Asia, particularly in China, due to an economic slowdown and a shift to cheaper coal alternatives. China’s LNG imports in Q1 2025 dropped 10% year-over-year, reducing export opportunities for U.S. gas producers and adding pressure on domestic prices.
Source: Bloomberg, "China’s LNG Imports Fall as Coal Use Rises," April 22, 2025
Technical Analysis
Natural gas futures (NYMEX) are currently around $3.15 per MMBtu as of April 28, 2025, following a recent decline from a peak of approximately $4.90 in 2025.
Fibonacci retracement levels indicate correction targets at 38.2% ($2.74) and 50% ($2.43).
Fundamental factors, such as oversupply and reduced demand, support a bearish scenario that could drive prices to these levels in the near term.
Nearest Entry Point Target:
• $2.74
Growth Potential:
Long-term:
• $10
Screenshot:
Ng!1


NATGAS Expected Growth! BUY!
My dear followers,
This is my opinion on the NATGAS next move:
The asset is approaching an important pivot point 3.541
Bias - Bullish
Safe Stop Loss - 3.373
Technical Indicators: Supper Trend generates a clear long signal while Pivot Point HL is currently determining the overall Bullish trend of the market.
Goal - 3.834
About Used Indicators:
For more efficient signals, super-trend is used in combination with other indicators like Pivot Points.
Disclosure: I am part of Trade Nation's Influencer program and receive a monthly fee for using their TradingView charts in my analysis.
———————————
WISH YOU ALL LUCK

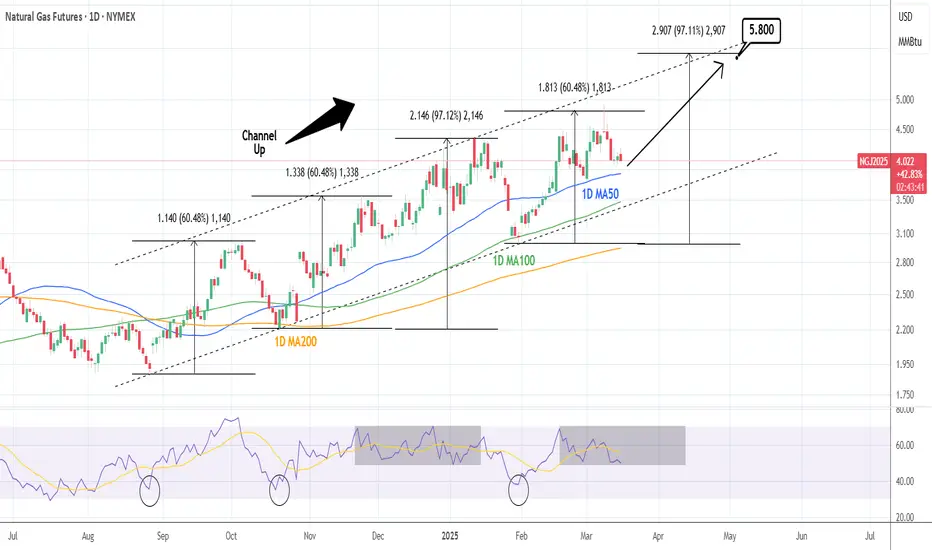
NATURAL GAS: One more technical push.Natural Gas is neutral on its 1D technical outlook (RSI = 49.489, MACD = 0.098, ADX = 23.222), which is the ideal buy opportunity inside its 8 month Channel Up, as long as the 1D MA100 holds. The last HH peaked at +97.12% before pulling back to the 1D MA100. The trade is long, TP = 5.800.
See how our prior idea has worked out:
## If you like our free content follow our profile to get more daily ideas. ##
## Comments and likes are greatly appreciated. ##
Natural Gas Shows Bullish PatternVANTAGE:NG Natural gas looks to be turning bullish after a projected five-wave impulse from the lows, followed by an ABC correction. It gave us a nice bullish setup formation by Elliott Wave theory, so more upside is in view, especially if breaks back above 4.0 bullish confirmation level, just watch out for short-term intraday pullbacks.


Natural gas long term projectionsOne of the most exciting assets around, who needs btc when you got NGAS,
Inverse HS, targets: 3.60$ / 5.60$
Mogalef weekly volatility bands seem to have been useful in the past predicting supports and resistances, top band matches the inverted HS target as well.

NatGAS is heating upA close above the white Center-Line projects higher prices to come.
There are 2 scenarios I see:
1. pull-back to the white CL, then up.
2. cross above the petrol CL, further and fast continuation to the north.
...oh, there's 3rd scenario:
3. price is getting punched back below the white Center-Line again. If that comes true, price has another chance to go south, with a target at the 1/4 line, or even way down to the L-MLH.

Copper breached the supportThe L-MLH is a most likely support.
This support is breached in Copper, and a fllow through would indicate way lower prices.
What I really like in this Chart is the tiny pullback to the L-MLH, since this is totally expected after a breach of it.
Arrows mark potential targets.

NG. - Long: bull flag breakout NG. has formed a bull flag with a falling parallel channel and is about to breakout. Bull flag is a continuation pattern so woith complete formation of bull flag, expected price target is 1230 which 24% profit from current price.
If we connect two highest points on a weekly point, they coincide with the same price target of 1230, completing formation of a bull flag.
Price is also above SMA200.
If price retraces back to lower parallel channel trendline, this would be a good add level as there is strong support zone in Weekly timeframe
Enter: Current Market Price
SL: 930
TP: 1230
R/R: 1:3.89

NG, prepping for a multi weekly gain come December 2023NG based on monthly data is registering very significant net buy volume at the current price range.
Seller's strength is certainly fading out based on thinning price volatility this past few days / weeks -- as shown on yellow price lines on chart.
NG is currently sitting at a strong major support at 2.0 to 2.5 area, a 1.0 FIB discount level -- this is where most buyers converge.
Initial trend shift has been spotted at the present price range.
Spotted at 2.50
TAYOR
Safeguard capital always.

Smart Money's Secret Signal - Commercials Loading Up on NattySmart Money's Secret Signal: Commercial Traders Are Loading Up on Natural Gas
The natural gas market is displaying compelling signals that suggest a potentially significant bullish trend change on the horizon. Through careful analysis of the Commitment of Traders (COT) report and several other key market indicators, we're seeing a convergence of bullish factors that warrant close attention from market participants.
Commercial Positioning at Multi-Year Extremes
Perhaps the most significant indicator is the current positioning of commercial traders, who are now more long than they've been in over three years. Commercial traders, often considered the "smart money" in commodity markets, tend to have the most comprehensive understanding of supply and demand dynamics. Their extreme long positioning is a powerful bullish signal that shouldn't be ignored.
Open Interest Analysis Confirms Bullish Outlook
Recent weeks have shown a notable increase in open interest concurrent with price declines. This relationship between price and open interest becomes particularly meaningful when we examine who's driving the increase of OI. In this case, the increase in open interest is primarily attributed to commercial traders building long positions – a highly bullish indication that suggests strong hands are accumulating positions at current price levels.
Contrarian Indicators Support the Bullish Case
Several contrarian indicators are aligning to support the bullish thesis:
-Investment advisor sentiment is currently very bearish, which historically has been a reliable contrarian indicator.
-Small speculators are showing extreme short positioning, and this group tends to be wrong at market extremes.
-Natural gas is undervalued when compared to historical relationships with gold and U.S. Treasuries.
Technical Confirmation Signals
The technical picture is adding weight to the bullish case:
-The Average Directional Index (ADX) has triggered a buy signal, dropping below 20 while commercials shifted to extreme long positioning.
-A bullish spread divergence has emerged between front-month and second-month contracts, implying immediate commercial demand for the front month, which is bullish.
-A major weekly bullish divergence has recently confirmed, suggesting potential for significantly higher prices.
Market Structure and Timing
While these indicators paint a compelling picture for higher natural gas prices, it's crucial to understand that this analysis doesn't necessarily call for immediate long positioning. Rather, it suggests that the market is fundamentally "setting up" for an upward move. Traders should wait for confirmation through a daily bullish trend change before considering positions.
The Power of COT Analysis in Trading
The Commitment of Traders report remains one of the most powerful yet underutilized tools in market analysis. Understanding how to interpret this data, particularly when combined with other technical and fundamental indicators, can provide traders with a significant edge in the markets. While many traders focus solely on price action or technical indicators, the COT report offers unique insights into the positioning of the market's most informed participants.
Ready to master the art of COT analysis and gain access to professional-grade market insights? Reach out to us today to take your trading to the next level.
Risk Disclaimer
IMPORTANT: The analysis provided in this article is for educational and informational purposes only and should not be construed as investment advice or a recommendation to buy or sell any security or derivative. Trading natural gas futures, options, or any other financial instruments involves substantial risk of loss and is not suitable for all investors. The market analysis presented here represents the opinion of the author based on the data available at the time of writing, but markets are dynamic and can change rapidly.
Past performance is not indicative of future results. The indicators and analysis techniques discussed in this article may not work in all market conditions and should not be relied upon as the sole basis for any investment decision. Before trading, you should carefully consider your investment objectives, level of experience, and risk appetite. You should only trade with money you can afford to lose.
It is strongly recommended that you conduct your own research and due diligence before making any investment decisions. You should also consult with a licensed financial advisor or broker regarding your specific situation. The author and the trading community mentioned may have positions in the securities discussed and may trade in these securities at any time.

Natural Gas is Ready For a Commercially Driven Bull MoveNatural gas is nicely setup for longs if we get a confirmed bullish trend change on the daily.
-Extreme commercial long positioning (most long they've been in the last 3 years) - bullish.
-Investment advisor sentiment very bearish - which is actually bullish.
-Undervalued vs gold & treasuries - bullish.
-ADX under 40 while commercials got extremely long - bullish.
-Bullish spread divergence between front month and next month out - bullish.
-Small specs at extreme in short positioning - bullish.
-True seasonal & some cycles are not supportive of going long, but these are the last things I look at. Enough indicators are supporting longs that I'm not going to worry about this.
-Bullish momentum divergence has triggered on some high timeframes, implying much higher prices are on the cards for Natty. There is also some smaller bullish weekly divergence currently setup (but not confirmed).
Have a good week.

NGAS cup and handle / inverse HSForming a bullish inverse HS, or a cup and handle. If the trend line is finally broken, PT 3.50$ and 4.20$ in the horizon, NGAS usually spikes around year end due to increasing storage

NATURAL GAS: Peak reversal. Strong sell signal.Natural Gas is about to turned neutral on its 1D technical outlook (RSI = 58.678, MACD = 0.175, ADX = 30.811), previously from an overbough state, as it made a standard LH rejection at the top of a year long Triangle pattern. The 1D RSI peaked like all prior LH, the 1D MACD is forming a Bearish Cross (again like all prior LH), so we have a prime sell signal in our hands. Common target on all was the 1.786 Fibonacci extension (TP = 2.165).
## If you like our free content follow our profile to get more daily ideas. ##
## Comments and likes are greatly appreciated. ##

Natural Gas Elliott Wave CountNatural Gas Elliott Wave Count
TRADENATION:NATURALGAS MCX:NATURALGAS1! FOREXCOM:NATURALGAS CAPITALCOM:NATURALGAS MOEX:NG1!
Elliott Wave Count!

Naturalgas Elliott wave countNG Elliott wave count
MOEX:NG1! CAPITALCOM:NATURALGAS FOREXCOM:NATURALGAS MCX:NATURALGAS1! TRADENATION:NATURALGAS
Weekly chart
Elliott wave count

Naturalgas elliott wave countnatural gas elliott wave count
MOEX:NG1! CAPITALCOM:NATURALGAS FOREXCOM:NATURALGAS MCX:NATURALGAS1! TRADENATION:NATURALGAS
Elliott wave count!!!

Natural Gas Approaching Seasonal Growth PhaseNatural Gas is entering a period where its price tends to grow exponentially until October. We have identified a potential Demand area with a trigger price at $2.20. Given the favorable conditions and the seasonality trend, we see an opportunity for a Buy Limit order. With a reward potential of 2X, this setup offers a promising risk-to-reward ratio, making it a compelling buy opportunity.
✅ Please share your thoughts about NG in the comments section below and HIT LIKE if you appreciate my analysis. Don't forget to FOLLOW ME; you will help us a lot with this small contribution.

NATURAL GAS Rejection at the top of the Falling WedgeNatural Gas (NG!) hit last week the top (Lower Highs trend-line) of the long-term Falling Wedge pattern that started on the April 10 2023 Low and was immediately rejected back to the 1W MA50 (blue trend-line).
As long as it holds, this rejection indicates that technically, the new Bearish Leg should start. Our Target is 1.550 (just above Support 1). If however the trend reverses and gives a candle closing above the Lower Highs, we will take the sell's loss and buy instead, targeting 3.300 (projected 1W MA100 extension).
-------------------------------------------------------------------------------
** Please LIKE 👍, FOLLOW ✅, SHARE 🙌 and COMMENT ✍ if you enjoy this idea! Also share your ideas and charts in the comments section below! This is best way to keep it relevant, support us, keep the content here free and allow the idea to reach as many people as possible. **
-------------------------------------------------------------------------------
💸💸💸💸💸💸
👇 👇 👇 👇 👇 👇

Natural Gas Trade IdeaNG - Natural Gas is approaching a sell zone.
Let the GAP close and look for a price near the 88.6 FIB level for a retracement down.
As always, secure 20 PIPS!
Share your thoughts.
The Professor

NG NovaGold Resources Options Ahead of EarningsAnalyzing the options chain and the chart patterns of NG NovaGold Resources prior to the earnings report this week,
I would consider purchasing the 3usd strike price at the money calls with
an expiration date of 2024-6-21,
for a premium of approximately $0.37.
If these options prove to be profitable prior to the earnings release, I would sell at least half of them.

Natural Gas...If the price reach to the box, I will start to buy Gas or some shares which has correlation with Gas...
