$KOLD one more leg up? Short Natural gas for 100% gain?Really liking the look of the AMEX:KOLD chart.
We've largely been in sideways consolidation since early February and with the recent test of the bottom of the structure, KOLD looks poised to move higher.
I bought throughout the day today with the average entry at $61.23. I'm looking for around 100% move to the upper resistance.
Risks:
- A reversal that goes through the bottom support of the structure
- 1 more retest of the bottom of the structure before the real move starts (if that happens, I'd be looking at price action having a tough time making it through $72 leading to a reversal).
Reward:
Upside 100% with an exit at $123.29
Natural Gas

Natural Gas DXY Gold Silver Forecastsupport and resistance guide Natural Gas DXY Gold Silver Forecast
and price action analysis

natural gas DXY gold silver forecast Natural Gas Natgas Stock in daily neutral trend
- Natural Gas Natgas needs a daily trend change to uptrend
- Next level for natural gas needs break hold 2.54

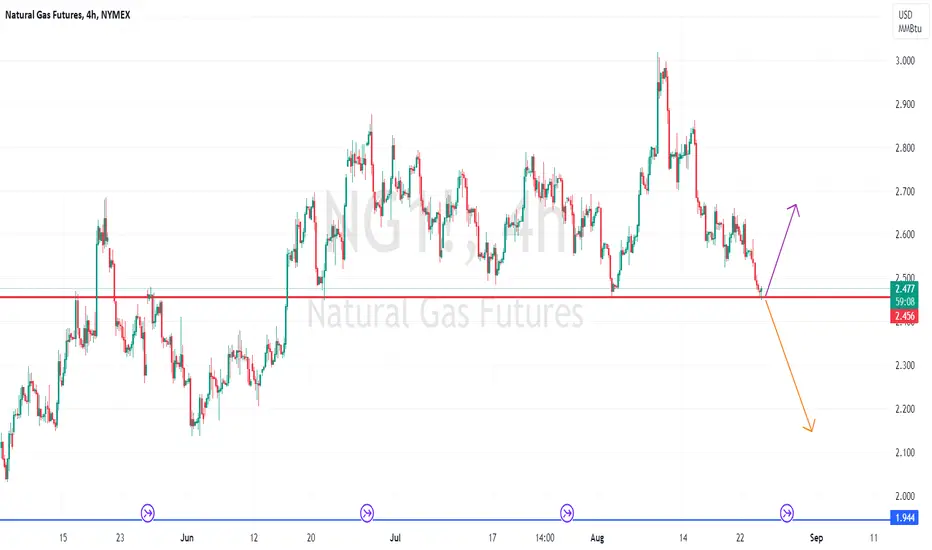
Natural GasAs noted to our members, Natural Gas rejected that 2740 area and is now heading back to retest the 2700 area.
We should see a bounce in this area back up for a longer-term bullish move.
As a scalper, this is an excellent area for a BUY opportunity.
Thoughts?

The Lengthy Wave 4 BeginsWe don't usually advise trading wave 4's as they can get overly complicated, however upon waiting for what should be the minute wave B we are advising our clients to go long as there is an off chance the minute wave C could be a minor wave 3 if the bottom is in. This is not our primary count though and we believe there is one more intermediate wave down to complete the primary wave C. Going long in our green box around $2.4 should provide us with at least 800 points of movement to $3.2 to complete the minor wave A. As always when trading natural gas you have to be prepared for extreme volatility and manipulation so be sensible with your position sizing.
Here's a closer look at the recent price action -

NG1! BEARS WILL DOMINATE THE MARKET|SHORT
Hello,Friends!
It makes sense for us to go short on NG1! right now from the resistance line above with the target of 2.448 because of the confluence of the two strong factors which are the general downtrend on the previous 1W candle and the overbought situation on the lower TF determined by it’s proximity to the upper BB band.
✅LIKE AND COMMENT MY IDEAS✅

Natural Gas Gold Silver DXY forecast- Natural Gas Natgas Stock in daily neutral trend
- Natural Gas Natgas needs a daily trend change to uptrend
- Next level for natural gas needs break above 2.86

NG1! The Target Is DOWN! SELL!
My dear subscribers,
NG1! looks like it will make a good move, and here are the details:
The market is trading on 2.762 pivot level.
Bias - Bearish
My Stop Loss - 2.837
Technical Indicators: Both Super Trend & Pivot HL indicate a highly probable Bearish continuation.
Target - 2.626
About Used Indicators:
The average true range ATR plays an important role in 'Supertrend' as the indicator uses ATR to calculate its value. The ATR indicator signals the degree of price volatility.
———————————
WISH YOU ALL LUCK

NG1! - The heating season is coming up soon.ahead of the heating.
Everyone needs gas.
The war will make gas more expensive.
if you like the idea, please "Like" it. This is the best "Thanks!" for the author 😊 P.S. Always do your own analysis before a trade. Put a stop loss. Fix profits in installments. Withdraw profits in fiat and please yourself and your friends.

Natural Gas DXY Gold SIlver FORECASTNatural Gas DXY Gold SIlver FORECAST
Price action Trend analysis


Natural Gas Gold Silver DXY ForecastNatural Gas Gold Silver DXY Forecast.
Big bounce but give most of it back

NG at multi timeframe support#NATURAL GAS... market is at his multi timeframe supporting level 2.45
its market most important and traded area form last few decades,
again market is at his level and winter season is on his way,
but it should hold this level for again bounce back..
otherwise downside we have next area that is mentioned on chart. 4
trade wisely
good luck

NG1! Massive Short! SELL!
My dear friends,
Please, find my technical outlook for NG1! below:
The price is coiling around a solid key level - 2.552.
Bias - Bearish
Technical Indicators: Pivot Points High anticipates a potential price reversal.
Super trend shows a clear sell, giving a perfect indicators' convergence.
Goal - 2.514
About Used Indicators:
The pivot point itself is simply the average of the high, low and closing prices from the previous trading day.
———————————
WISH YOU ALL LUCK

NG1!: Long Trade with Entry/SL/TP
NG1!
- Classic bullish setup
- Our team expects bullish continuation
SUGGESTED TRADE:
Swing Trade
Long NG1!
Entry - 2.560
Sl - 2.496
Tp - 2.656
Our Risk - 1%
Start protection of your profits from lower levels.
❤️ Please, support our work with like & comment! ❤️

NG1! Will Explode! BUY!
My dear subscribers ,
I analysed this chart on NG1!, and concluded the following:
The asset is approaching an important pivot point 2.549
Bias - Bullish
Technical Indicators: Pivot Points Low anticipates a potential price reversal.
Super trend shows a clear buy, giving a perfect indicators' convergence.
Goal - 2.640
Safe Stop Loss - 2.499
About Used Indicators:
The average true range ATR plays an important role in 'Supertrend' as the indicator uses ATR to calculate its value. The ATR indicator signals the degree of price volatility.
———————————
WISH YOU ALL LUCK

NG1! Is Bullish! Long!
Take a look at our analysis for NG1!.
Time Frame: 2h
Current Trend: Bullish
Sentiment: Oversold (based on 7-period RSI)
Forecast: Bullish
The market is approaching a significant support area 2.447.
The underlined horizontal cluster clearly indicates a highly probable bullish movement with target 2.551 level.
P.S
Overbought describes a period of time where there has been a significant and consistent upward move in price over a period of time without much pullback.
Like and subscribe and comment my ideas if you enjoy them!

NATGAS Long From Support! Buy!
Hello,Traders!
NATGAS is going down
But a strong horizontal
Support is ahead at 2.459
From where I believe
We might see a rebound
Buy!
Like, comment and subscribe to help us grow!
Check out other forecasts below too!

Natural gas bullish rally...Every time when it touches it make new high..let see again this time.naturalgas, NG, natural gas

Natural Gas from Pipelines to PortfoliosNatural gas was once considered a byproduct of oil production. It is now becoming increasingly important as one of the cleanest burning fossil fuels and a key piece of the clean energy transition. Today, it forms the backbone of global energy production.
This paper delves into the supply and demand factors affecting natural gas prices and proposes a long position in Henry Hub Natural Gas Futures (NG1!) to harness gains from seasonal price trends with an entry of 2.484 with a target of 3.099 and a stop loss at 2.172 delivering risk/reward ratio of 2x.
Natural Gas Supply and Demand
Supply
Largest producers and exporters of Natural Gas are US, Russia, Iran, China, Canada, Qatar, Australia, Norway, and Saudi Arabia.
The standout in the list is Russia. Following the conflict in Ukraine, gas exports from Russia plummeted 58% in 2022. This led to price shocks in EU natural gas (TTF). US supply is unable to adequately bridge this deficit as transporting natural gas using ships requires converting it to Liquified Natural Gas (LNG) and using special refrigerated vessels which is not economical for large quantities of natural gas.
This is also why the spread between EU and US natural gas is much wider than EU and US oil.
Notably, US shale reserves have a high concentration of natural gas. Along with newly developed fracking techniques, this has led to increasing gas production in the US. Moreover, natural gas is also obtained in the process of oil extraction, which means gas production is linked to oil production.
This has interesting ramifications when looking at present supply. Despite low natural gas prices over the past few months, production in the US has remained high as a result of high oil production. Similarly, higher prices do not readily translate to higher production. This suggests that Natural Gas price-supply relationship is inelastic.
Demand
Demand for Natural Gas comes from:
• Energy Production – Natural Gas is used in power plants to generate electricity. Natural Gas electricity production has been rising over the last decade as it replaces Coal. Notably, manufacturers using natural gas as an energy source can switch to other energy sources during price spike, which provides some elasticity to demand.
• Commercial and Residential Heating – Natural Gas is used for heating homes in winter. This can lead to a seasonal demand during winter months in the Northern Hemisphere.
• Industrial Use – Natural Gas is used as a raw material for industrial products such as plastics, ammonia, and methanol.
Natural gas demand is heavily affected by weather. Unusually warm summers in the Northern Hemisphere drive higher energy usage from air conditioners while colder winters drive higher demand for heating.
Inventories
Gas can be injected into storage facilities and stored for later use. These inventory levels play a major role in balancing supply-demand. Summer months (April-October) are referred to as injection periods while winter months (November-March) are withdrawal periods. Inventory levels help even out the surge in winter demand.
However, natural gas is much harder to store than oil as it is less dense. This means the inventory effect is not as apparent which explains the larger seasonal variation in natural gas prices as compared to oil prices.
Seasonality in Natural Gas Prices
Seasonal price action of Natural Gas shows two distinct price rallies. A large rally during winter in the US and EU driven by surge in supply for heating in winters, during this period, prices peak in early-December before declining. The other, smaller spike is during summers in the US and EU when demand for electricity rises, during this period, prices peak in early-June before declining.
Further, prices show the highest deviation from the seasonal trend in late-September.
Over the past five years, the winter rally has become wider, with prices staying elevated from August to early-December.
Additionally, seasonal trend points to a price appreciation of +11% between September and December.
However, investors should note that past seasonal trends are not representative of current or future market performance.
Henry Hub Futures
Henry Hub is the most prominent gas trading hub in the world. It is located at the intersection of major on-shore and off-shore production regions and connected by an extensive pipeline network. This is also where US natural gas exports are dispatched.
CME’s benchmark Natural Gas futures (NG) deliver to Henry Hub and is the largest gas futures contract in the world. Other notable Natural Gas futures contracts are TTF (EU) and JKM (Asia). Futures from both regions are also available for trading on CME.
Asset Managers are Bullish
Commercial traders are heavily net short on Natural Gas futures, short positioning in July was at its highest level since 2021 but has since reduced. Overall, net short commercial positioning points to bullish sentiment.
Asset managers have switched positioning in Natural Gas futures from net short to net long since May. Last week net long positioning reached its highest level since May 2022.
Options markets OI points to a neutral market view on natural gas with Put/Call ratio close to 1. Options P/C has stayed close to 1 for the past 3 months.
At the same time, Implied Volatility on Natural Gas options has been rising in August. A rally last week failed to break past a key support level but vols remain elevated suggesting that price may retest that level again.
Henry Hub Gas Dynamics with European Gas
Last week, EU Natural Gas futures (TTF1!) spiked by almost 28% due to a strike at Australia’s second largest LNG plant, still the rally soon retraced almost entirely.
LNG supply disruption, especially at the key transition to the winter season can lead to volatility spikes. Though, EU gas inventories are 90% full, supply disruptions like this can still have a major effect on gas prices but especially on volatility.
Over the past few years, higher flexibility and capacity in the global LNG supply chain has led to the various global natural gas benchmarks tracking each other more closely. This means that Henry Hub natural gas futures are exposed not just to US and Canada Natural Gas production but also to disruptions in global supply.
However, the effect is comparatively limited due to ample supply in the US. This can be seen in the price action of Henry Hub natural gas futures which rose by 6% on the same day.
Recent Trend in Natural Gas Inventories
As per the EIA, Natural Gas supply fell 0.1% WoW last week. At the same time demand rose by 0.3% WoW. Note that working natural gas in underground storage has started to flatten over the past 4 weeks, rising by just 94 billion cubic feet (BCf) compared to the 5Y average increase of 140 BCf during the same period.
Still, inventory levels are close to the top of their 5-year maximum, elevated by high US gas production during the summer driven by higher oil production. EIA forecasts that the depletion season will end with inventories 7% higher than their 5-year average.
EIA expects production to remain flat for the remainder of the year, so watching weekly consumption reports could point to early indicators of seasonal inventory depletion. However, due to elevated inventory levels, the seasonal effect may not be as strong as prior years.
In a longer-term trend, gas rigs in the US have started to decline this year after surging over the past year. This will likely lead to lower production over the next year.
Trade Setup
With options markets pointing bullish and seasonal trends suggesting price appreciation during this period, a long position in Natural Gas futures expiring in October (NGV) allows investors to benefit from an increase in Natural Gas prices.
Each contract of CME Henry Hub Natural Gas Futures provide exposure to 10,000 MMBtu of Natural Gas while the October contract has maintenance margin of USD 5,070 for a long position. A USD 0.001 MMBtu change in quoted price per MMBtu leads to a PnL change of USD 10 in one Henry Hub Natural Gas Futures.
Entry: 2.484
Target: 3.099
Stop Loss: 2.172
Profit at Target: USD 6,150
Loss at Stop: USD 3,120
Reward/Risk: 2x
MARKET DATA
CME Real-time Market Data helps identify trading set-ups and express market views better. If you have futures in your trading portfolio, you can check out on CME Group data plans available that suit your trading needs www.tradingview.com
DISCLAIMER
This case study is for educational purposes only and does not constitute investment recommendations or advice. Nor are they used to promote any specific products, or services.
Trading or investment ideas cited here are for illustration only, as an integral part of a case study to demonstrate the fundamental concepts in risk management or trading under the market scenarios being discussed. Please read the FULL DISCLAIMER the link to which is provided in our profile description.

NATGAS Bullish Rebound Ahead! Buy!
Hello,Traders!
NATGAS is going down
Now but it will soon hit
A support level of 2.473
From where I think the
Price will go up
Buy!
Like, comment and subscribe to help us grow!
Check out other forecasts below too!

✅NATGAS WILL GO UP|LONG🚀
✅NATGAS has almost reached
A strong long-term rising support
From where I will be expecting
A local bullish rebound
LONG🚀
✅Like and subscribe to never miss a new idea!✅
