Natural Gas

NG1 UPDATE WITH A GRAVITY CENTER, WATCH OUT CLOSELYPlease wait for the next candle to decide what to do,
Kind regards


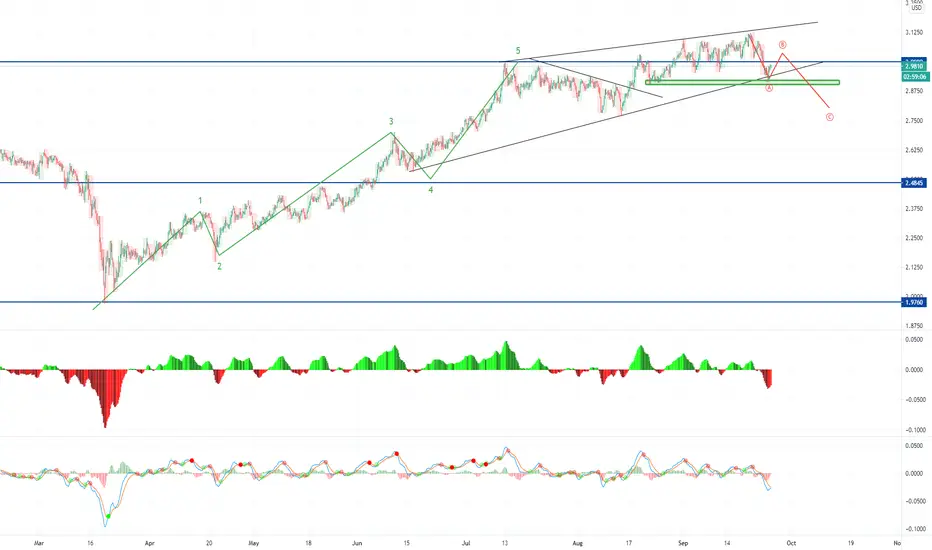
natgas/usd extreme bearish charthi, usually i'm not sharing my ideas in here. thats why im pretty bad at using this sites chart while analyse. ım wrıting down here, it will go drawn till 1.20. just watch. appreciate later. bonne chance!


NG, not Coal. Thanks!The big question is what is going on with Nat Gas this year???
The December(Z) contract is still coiling up in a wedge pattern and about to reveal the answer.
A closer look at the bullish scenario...
It's looking technically hopeful with the 200 Week EMA, $3.00 level, and the bottom of the wedge all lining up.
Now the bearish scenario...
The RSI could actually be showing that the strength of this trend is toast and it's possible the MACD is over-extended. It would be a good idea to keep a close watch for the whole thing to fall apart, just as bulls are piling in for an anticipated leg up.
As of now I'll be looking to buy December(Z) again around $3.00 if a bounce is confirmed and it remains within the wedge pattern.

RIP to the MACD cross BB Trendline Swing TradersThe price gapped by 69 cents. Hard to think there aren't whales having fun fleecing retail or something.
I wonder what will happen next with the COT.
Actually we just changed month as we were close to expiry. Damn might have been able to profit from the contango. Still funny to see.
I wonder how many retail gap traders will furiously short it now. And the short ETFS must be doing great. Maybe Robinhood "investors" will notice big drops and buy the chart without a clue of what is behind it.
Depending on the broker people just trade some made up chart that is supposed to look like NatGas and I'm sure some short sellers got ran over.
Commodity futures are more complicated than Forex in the sense that you got to watch the expiries. Bigger barrier to entry I mean.
If you understand that:
- Less is more,
- Trading is not rocket science,
- You must not overcomplicate your trading,
- The best strategy is a SIMPLE one (that you can explain easilly in a few words and took you 15 minutes to put together),
- Smart people are at a disadvantage,
- The most important part of trading is emotional control (something that sounds like anyone can do it),
- You can make 50% in 2 months,
- Trading is a new paradigm it's not like other boring jobs where the more you put in the more you get out here all you need is 1 hour a day,
- Spend as little time as possible doing research to avoid analysis paralysis,
- Rely heavilly on indicators
Then you are the smart money and on the road to success and I know some people that would be very happy to sell you a course.
Good luck competing against the pros with your simple strategy, low IQ, slack off not a care in the world attitude, and 45 minutes a day.
Just something to cheer me up and distract me after I missed buying the pound by a few seconds. Who knows maybe it'll go back to my entry before rallying.
Now NG is only in a contango of about 12%, not enough for me to want to exploit if that's even still possible with my broker.


Natural Gas (NATGASUSD): Bearish Reaction is Highly Probable
natgas broke and closed below an expanding wedge pattern.
because the price is currently testing a strong daily structure,
chances are high that the price will drop.
target levels:
2.05
2.0
the safest zone to sell from is the expanding area between the support of the wedge and the last higher low.

Natural Gas at HUGE ResistanceNatural Gas has opened the October Contract with a giant surge and in doing so has hit a very strong and time tested resistance.


Strong support level of 2$, A global reversal in the gas market has already occurred, a return to the $ 2 level and a rebound from it will confirm the reversal. The fast approach of the heating season and the tightening balance of supply and demand will support gas prices at a comfortable level above $ 2.

NG Halloween Trick or TreatToday the November(X) contract for Natural Gas corrected down to the historically significant $2.50 level. Going back a couple years it is clear that prices tend to hangout above $2.75 so right now prices are undervalued.
Buying here.
+1 @ $2.53

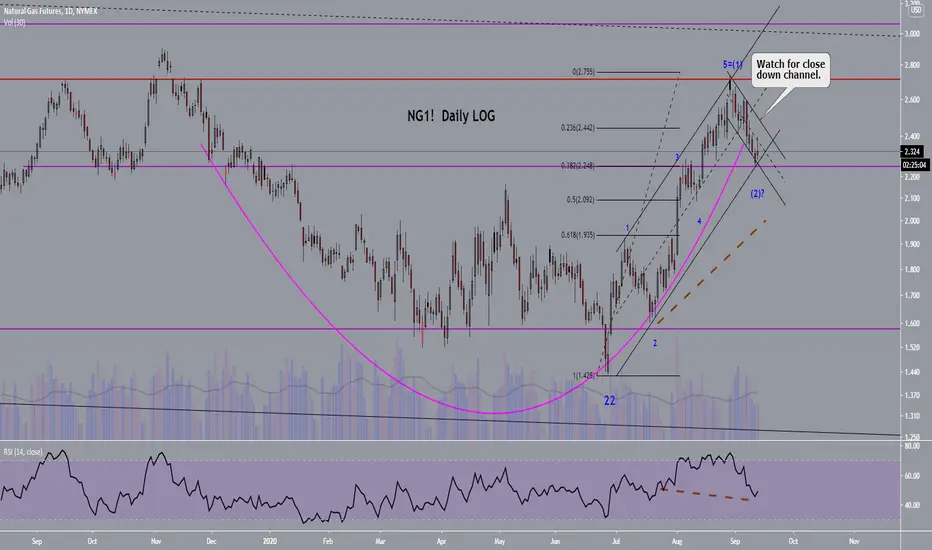
Natural gas: Cup with handle formation. Looks bullishWe have a cup with handle formation. Signal for buy would be a close the current down channel line. If you would go long now can use close below most ring low.
Supporting this idea is a sizable positive reversal in the daily RSI .
Major natural gas producers are: AR,EQT , and RRC all of which are up today. Take a look at them.
UNG is a natural gas ETF .