NATGAS The Target Is DOWN! SELL!
My dear friends,
Please, find my technical outlook for NATGAS below:
The instrument tests an important psychological level 2.638
Bias - Bearish
Technical Indicators: Supper Trend gives a precise Bearish signal, while Pivot Point HL predicts price changes and potential reversals in the market.
Target - 2.455
About Used Indicators:
Super-trend indicator is more useful in trending markets where there are clear uptrends and downtrends in price.
———————————
WISH YOU ALL LUCK
Ng1!f

Natural Gas Trade IdeaNG - Natural Gas is approaching a sell zone.
Let the GAP close and look for a price near the 88.6 FIB level for a retracement down.
As always, secure 20 PIPS!
Share your thoughts.
The Professor

Natural Gas Prices Rally Amidst Geopolitical Tensions and MarketNatural Gas Prices Rally Amidst Geopolitical Tensions and Market Sentiment Shift
The price of natural gas is staging a recovery, currently trading around $1.80 as of the time of writing. Preceding any technical analysis, it's important to note that the US Dollar Index is experiencing a slight decline, as market sentiment favors risk assets over safe havens and cash.
Natural gas futures are showing signs of strength ahead of the US trading session this Tuesday, surpassing the $1.80 mark. This uptick comes after tensions between Israel and Iran nearly escalated into a direct confrontation, causing concerns in the market. Despite the de-escalation of tensions over the weekend, natural gas prices are on the rise, buoyed by a shift in investor sentiment.
Both equities and commodities are regaining favor, with several analysts predicting a notable increase of 10% to 30% in commodity prices, particularly precious metals. Additionally, we are entering a period of seasonality for natural gas, historically marked by price growth during this time of the year.
Technical indicators further support the bullish outlook, with the Relative Strength Index (RSI) exiting the oversold territory and currently above the 50 middle level. This suggests a potential long setup trade for a swing reversal, aligning with the seasonal trend.
In light of these developments, traders may consider maintaining open positions for an extended period, in anticipation of the forecasted price movements driven by both geopolitical factors and market sentiment shifts.

Natural Gas Price Forecast | Oil, Silver, Gold DXY Natural Gas stock Bulls NatGas Support & Resistance Guide
AMEX:UNG Stock Forecast
USO Oil Stock Forecast
DXY US dollar Stock Forecast
Gold XAUUSD Stock Forecast
Silver XAGUSD

NG1! BEARS ARE STRONG HERE|SHORT
Hello,Friends!
We are going short on the NG1! with the target of 2.000 level, because the pair is overbought and will soon hit the resistance line above. We deduced the overbought condition from the price being near to the upper BB band. However, we should use low risk here because the 1W TF is green and gives us a counter-signal.
✅LIKE AND COMMENT MY IDEAS✅

Natural Gas Price Forecast | Oil, Silver, Gold00:00 Natural Gas stock Bulls NatGas Support & Resistance Guide
06:37 AMEX:UNG Stock Forecast
08:46 USO Oil Stock Forecast
10:37 DXY US dollar Stock Forecast
11:33 Gold XAUUSD Stock Forecast
12:38 Silver XAGUSD
Natural Gas Price Forecast | Oil, Silver, Gold

NATGAS Trading Opportunity! SELL!
My dear subscribers,
NATGAS looks like it will make a good move, and here are the details:
The market is trading on 2.252 pivot level.
Bias - Bearish
My Stop Loss - 2.355
Technical Indicators: Both Super Trend & Pivot HL indicate a highly probable Bearish continuation.
Target - 2.090
About Used Indicators:
The average true range ATR plays an important role in 'Supertrend' as the indicator uses ATR to calculate its value. The ATR indicator signals the degree of price volatility.
———————————
WISH YOU ALL LUCK

Natural Gas Price Forecast | Oil, Silver, Gold00:00 Natural Gas stock Bulls NatGas Support & Resistance Guide
06:37 AMEX:UNG Stock Forecast
08:46 USO Oil Stock Forecast
10:37 DXY US dollar Stock Forecast
11:33 Gold XAUUSD Stock Forecast
12:38 Silver XAGUSD
Natural Gas Price Forecast | Oil, Silver, Gold DXY

✅NATGAS RISKY SHORT🔥
✅NATGAS surged again to retest the resistance of 2.30$
But it is a strong key level
So I think that there is a high chance
That we will see a bearish pullback and a move down
SHORT🔥
✅Like and subscribe to never miss a new idea!✅

NATGAS: Bearish Continuation
The price of NATGAS will most likely collapse soon enough, due to the supply beginning to exceed demand which we can see by looking at the chart of the pair.
❤️Please, support our work with like & comment!❤️

Natural Gas Price Forecast | Oil, Silver, Gold00:00 Natural Gas stock Bulls NatGas Support & Resistance Guide
09:07 AMEX:UNG Stock Forecast
12:15 USO Oil Stock Forecast
15:22 DXY US dollar Stock Forecast
16:43 Gold XAUUSD Stock Forecast
17:28 Silver XAGUSD
Natural Gas Price Forecast | Oil, Silver, Gold

NATGAS My Opinion! SELL!
My dear friends,
NATGAS looks like it will make a good move, and here are the details:
The market is trading on 2.150 pivot level.
Bias - Bearish
Technical Indicators: Supper Trend generates a clear short signal while Pivot Point HL is currently determining the overall Bearish trend of the market.
Goal - 1.994
Recommended Stop Loss - 2.252
About Used Indicators:
Pivot points are a great way to identify areas of support and resistance, but they work best when combined with other kinds of technical analysis
———————————
WISH YOU ALL LUCK

NATGAS Bullish Breakout! Buy!
Hello,Traders!
NATGAS made a gap up
Then hit a horizontal level
Of 1.989 then made a breakout
And the breakout is confirmed
So we are bullish biased
And we will be expecting
A further move up
Buy!
Like, comment and subscribe to help us grow!
Check out other forecasts below too!

$NG1 $NATGAS #NaturalGas$NG1 PEPPERSTONE:NATGAS #NaturalGas is now testing a 33 years old wedge for a bit more than 12 times. Any close below 1.50 causes a free fall, however, there is a descending lower channel wedge extending since 2009 around 1$.

Natural Gas Oil, Silver, DXY, Gold Price ForecastSilver, Natural Gas DXY, Gold Oil Price Forecast
00:00 Natural Gas stock Bulls NatGas Support & Resistance Guide
04:36 AMEX:UNG Stock Forecast
09:16 USO Oil Stock Forecast
12:18 DXY US dollar Stock Forecast
14:04 Gold XAUUSD Stock Forecast
15:44 Silver XAGUSD

✅NATGAS SHORT FROM RESISTANCE🔥
✅NATGAS made a massive
Gap up from the support
But after the gap the price
Immediately hit a horizontal
Resistance level of 2.00$
From where we are already
Seeing a bearish reaction
And I think that we will see
A further move down next week
SHORT🔥
✅Like and subscribe to never miss a new idea!✅

Natural Gas Price Forecast | DXY Oil, Silver, Gold
00:00 Natural Gas stock Bulls NatGas Support & Resistance Guide
05:33 AMEX:UNG Stock Forecast
07:00 USO Oil Stock Forecast
09:30 DXY US dollar Stock Forecast
10:42 Gold XAUUSD Stock Forecast
13:29 Silver XAGUSD
Natural Gas Price Forecast | DXY Oil, Silver, Gold

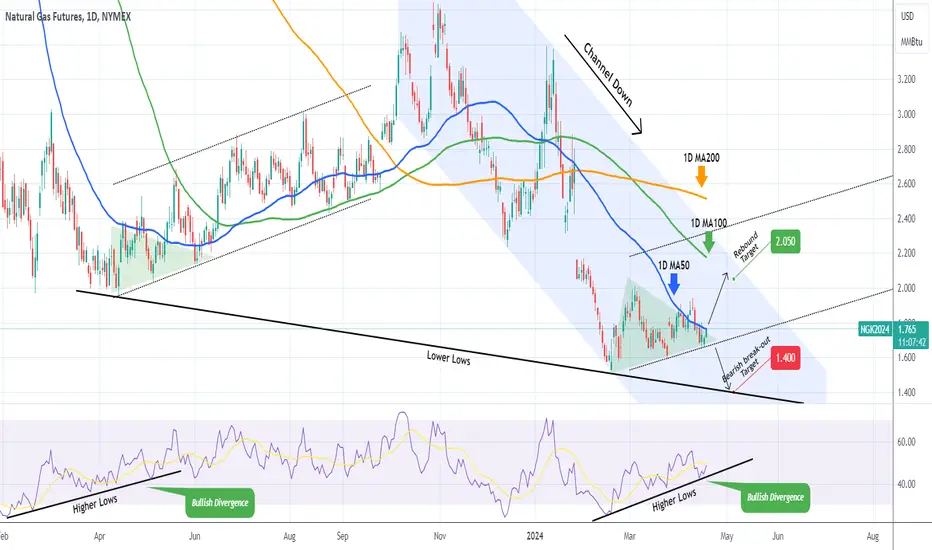
NATURAL GAS Can turn bullish on the short-term.Natural Gas (NG1!) has been posting Higher Lows, three so far since the February 20 Low, despite the fact that it remains within a Channel Down since the October 27 2023 High. This might be a short-term trend change similar to the Channel Up that started on the April 14 2023 Low following a sharp and long-term selling sequence. Notice also the Higher Lows Bullish Divergence on the 1D RSI patterns.
As long as the bottom of the (dotted) Channel Up holds, we will be bullish short-term, targeting the 1D MA100 (green trend-line) at 2.050. If the bottom of the Channel Down breaks, we will turn bearish, targeting the Lower Lows trend-line at 1.400. The risk is low on both sides.
-------------------------------------------------------------------------------
** Please LIKE 👍, FOLLOW ✅, SHARE 🙌 and COMMENT ✍ if you enjoy this idea! Also share your ideas and charts in the comments section below! This is best way to keep it relevant, support us, keep the content here free and allow the idea to reach as many people as possible. **
-------------------------------------------------------------------------------
💸💸💸💸💸💸
👇 👇 👇 👇 👇 👇
Natural Gas to $2.55On a seasonal basis over the last 30 years the price of Natural Gas begins to rise now into August. This year's price is tracking very closely to the historical price. I think we're about to rise at least to $2.55.
NYMEX:NG1!

NATGAS Swing Long Trade! Buy!
Hello,Traders!
NATGAS has retested a massive
Horizontal support level of 1.450$
And already made a rebound
So we will be expecting a
Further move up
Buy!
Like, comment and subscribe to help us grow!
Check out other forecasts below too!

NATGAS: Bullish Continuation & Long Signal
NATGAS
- Classic bullish formation
- Our team expects growth
SUGGESTED TRADE:
Swing Trade
Buy NATGAS
Entry Level - 1.773
Sl - 1.727
Tp - 1.861
Our Risk - 1%
Start protection of your profits from lower levels
❤️ Please, support our work with like & comment! ❤️

NATGAS Technical Analysis! BUY!
My dear friends,
Please, find my technical outlook for NATGAS below:
The instrument tests an important psychological level 1.773
Bias - Bullish
Technical Indicators: Supper Trend gives a precise Bullish signal, while Pivot Point HL predicts price changes and potential reversals in the market.
Target - 1.827
Recommended Stop Loss - 1.739
About Used Indicators:
Super-trend indicator is more useful in trending markets where there are clear uptrends and downtrends in price.
———————————
WISH YOU ALL LUCK

✅NATGAS MASSIVE LONG LONG🚀
✅NATGAS is trading in a
Downtrend but the price
Has reached a massive
Horizontal support level
Of 1.5$ which is both
A round number and a hasn't
Been breached since year 1995
So we can be pretty confident
In that a rebound is to be expected
And thus a swing long trade
On Gas makes sense
LONG🚀
✅Like and subscribe to never miss a new idea!✅
