Ng1!f

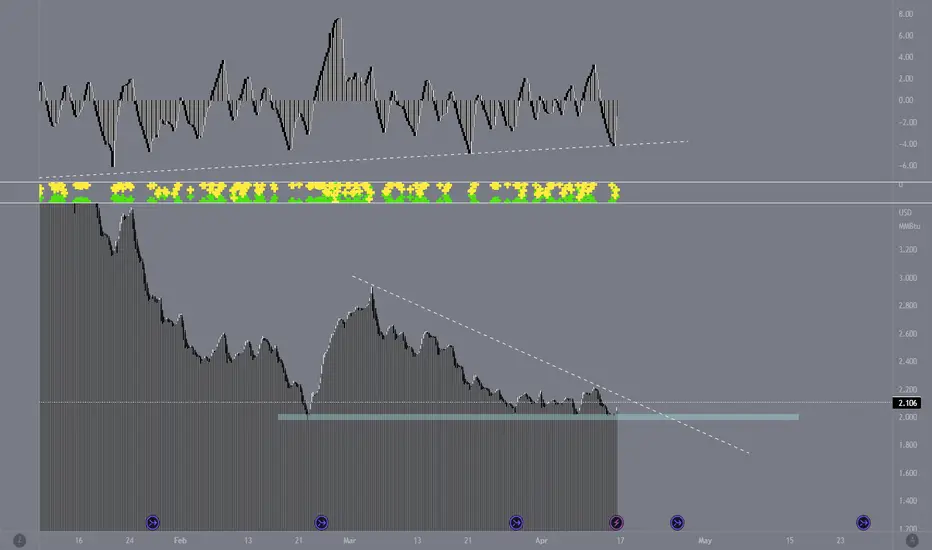
NATURAL GAS: Hit the 2 month Support. Buying is favored.Natural Gas hit the S1 Zone today (2.100 - 2.060), which started forming on February 22nd. This support has held another 8 times and with the 1D time frame neutral technically (RSI = 45.392, MACD = -0.046, ADX = 18.986), we are making a buy call targeting the 0.382 (TP = 2.440). In addition, the 1D RSI is bouncing off the HL trendline.
In the event however that the 1D candle closes under 2.060, we will revert to selling and target the -0.236 Fibonacci level (TP = 1.830).
## If you like our free content follow our profile to get more daily ideas. ##
## Comments and likes are greatly appreciated. ##

Natural GAS : LONGNatural gas bounced from a low of $1.95/MMBTU, where almost all producers lose money.
Since natural gas and crude oil are near or below breakeven levels, producers are reducing their drilling rate - likely lowering production levels given the lack of capacity.
The negative shift in weather, falling rig count, and potential export boost from Freeport may push natural gas back into a shortage over the coming months.
While natural gas spot prices appear likely bottoming, UNG's immense "contango" pressure remains a key investment rig factor.
Source : Seeking Alpha

Natural Gas Weekly Price Outlook | Support & Resistance Guide |- Natural Gas falling wedge is my support and resistance guide
- Currently Daily & 4h Neutral trend
- 2 key support below and 2 key resistances above.

NG1! Is Very Bearish! Short!
Take a look at our analysis for NG1!.
Time Frame: 9h
Current Trend: Bearish
Sentiment: Overbought (based on 7-period RSI)
Forecast: Bearish
The market is approaching a significant resistance area 2.465.
The above observations make me that the market will inevitably achieve 2.316 level.
P.S
Please, note that an oversold condition can last for a long time, and therefore being oversold doesn't mean a price rally will come soon, or at all.
Like and subscribe and comment my ideas if you enjoy them!

NG1! Buyers In Panic! SELL!
My dear friends ,
My technical analysis for NG1! is below:
The price is coiling around a solid key level - 2.458
Bias - Bearish
Technical Indicators: Both Super Trend & Pivot HL indicate a highly probable Bearish continuation.
Target - 2.312
Recommended Stop Loss - 2.541
About Used Indicators:
Pivot points are a great way to identify areas of support and resistance, but they work best when combined with other kinds of technical analysis
———————————
WISH YOU ALL LUCK

NG1!: Expecting Bearish Continuation! Here is Why:
It is essential that we apply multitimeframe technical analysis and there is no better example of why that is the case than the current NG1! chart which, if analyzed properly, clearly points in the downward direction.
❤️ Please, support our work with like & comment! ❤️

NG1! BEARS ARE GAINING STRENGTH|SHORT
Hello,Friends!
NG1! pair is in the uptrend because previous week’s candle is green, while the price is evidently rising on the 12H timeframe. And after the retest of the resistance line above I believe we will see a move down towards the target below at 2.169 because the pair overbought due to its proximity to the upper BB band and a bearish correction is likely.
✅LIKE AND COMMENT MY IDEAS✅

BULL FLAG! (4HR / 8HR)Natural Gas forming a BULL FLAG with a nice bounce off new support. Near term bullish.

NATGAS, keeps the flame burning. Upside continues.NATGAS weekly data is suggesting firm price foundation at current levels and an upside continuation is inevitable.
SPOTTED at 2.4 (continuation from 2.0 levels)
_______________
Related news:
Nat-Gas Prices Rebound on Outlook for Cold U.S. Temps
www.tradingview.com
NG1! BEARS ARE STRONG HERE|SHORT
Hello,Friends!
NG1! pair is trading in a local uptrend which we know by looking at the previous 1W candle which is green. On the 17H timeframe the pair is going up too. The pair is overbought because the price is close to the upper band of the BB indicator. So we are looking to sell the pair with the upper BB line acting as resistance. The next target is 1.949 area.
✅LIKE AND COMMENT MY IDEAS✅

NG1! BEST PLACE TO BUY FROM|LONG
Hello,Friends!
It makes sense for us to go long on NG1! right now from the support line below with the target of 1.931 because of the confluence of the two strong factors which are the general uptrend on the previous 1W candle and the oversold situation on the lower TF determined by it’s proximity to the lower BB band.
✅LIKE AND COMMENT MY IDEAS✅

Natural Gas Detail Trading Plan |Long term| Support & Resistance- AMEX:NG AMEX:UNG AMEX:BOIL : if i were to add today, I laid out a detailed game plan in the video of how to trade it with SL and target.
- 4 hour currently in neutral trend
- potentially shaping up daily higher low and trend change to uptrend need to break above prior high
- still trading within the equilibrium range likely breaking in early May

✅NATGAS BUYING OPPORTUNITY|LONG🚀
✅NATGAS will soon retest a key support level of 2.2$
So I think that the pair will make a rebound
And go up to retest the supply level above at 2.28
LONG🚀
✅Like and subscribe to never miss a new idea!✅

NG, 1st spark up... flame will ascend to new highs soon..NG correction is slowly concluding -- with bears showing some weakness on weekly data, after touching the order block support at 1.9 level.
A reversal is on queue now.
Expect some signficant moves on the upside soon -- a revisit to 7.0 before year ends is possible.
SEEDED L at 2.09
TAYOR.

Natural Gas Future Outlook Weekly /Daily S&R Technical Analysis - AMEX:NG Finally got a 4 hour uptrend need more follow through tomorrow to confirm
- likely heading to $2.5 if 4 hour uptrend confirm follow through tomorrow
- tradeable ticker AMEX:UNG and AMEX:BOIL still use the NG chart if you are trading natural gas.

NG1! Sellers In Panic! BUY!
My dear followers ,
Please, find my technical outlook for NG1! below:
The price is coiling around a solid key level - 2.274
Bias - Bullish
Technical Indicators: Supper Trend gives a precise Bullish signal, while Pivot Point HL predicts price changes and potential reversals in the market.
Target - 2.505
About Used Indicators:
Super-trend indicator is more useful in trending markets where there are clear uptrends and downtrends in price.
———————————
WISH YOU ALL LUCK

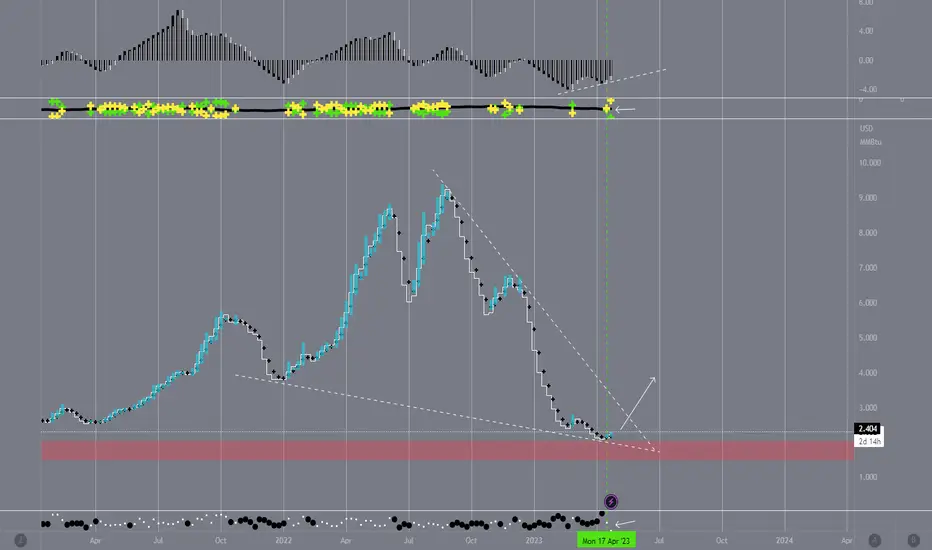
NATURALGAS Long Natural gas is packed in a tight falling wedge pattern. It is at historic support too, going back to August of 2019. Another point worth mentioning is that the price of natural gas defended this support on February 22nd of this year and produced a >40% rally, peaking on March 3rd. Virtually every timescale from the minutes to the weekly show positive divergences and oversold readings. The targets for this trade are the gaps above, marked in purple. Use UNG or BOIL (x2) for this trade.

Natural gas is on the verge of a move The Natgas bottom looks very close. It looks to be forming a broadening bottom. A marginal new high, a small pullback , then take off.

Natural Gas Weekly Bear Flag potential but still holding Support- AMEX:NG AMEX:UNG AMEX:BOIL needs that 4 hours trend change otherwise even the big moves will essentially just fade
- still a potential weekly bear flag
- but still holding bottom wedge support and also double bottom on daily.

Crude Oil and Natural Gas - Bearish ReversalsCrude Oil (WTI) & Natural Gas have been in an uptrend.
Reversal Patterns are present, and BIG bearish moves are around the corner.
Technical Analysis:
- WTI: Ascending Channel Breach
- Natural Gas: Ending Diagonal

NG, on active accumulation phase..NG, is undergoing significant accumulation at the current levels. It revisited strong order block / support at 1.9 level and it touched this multiple times. It retested it and bounce back-- only to return to it multiple times. Let's see if it can finally muster strength to reverse from this level.
Spotted at 2.10
TAYOR.