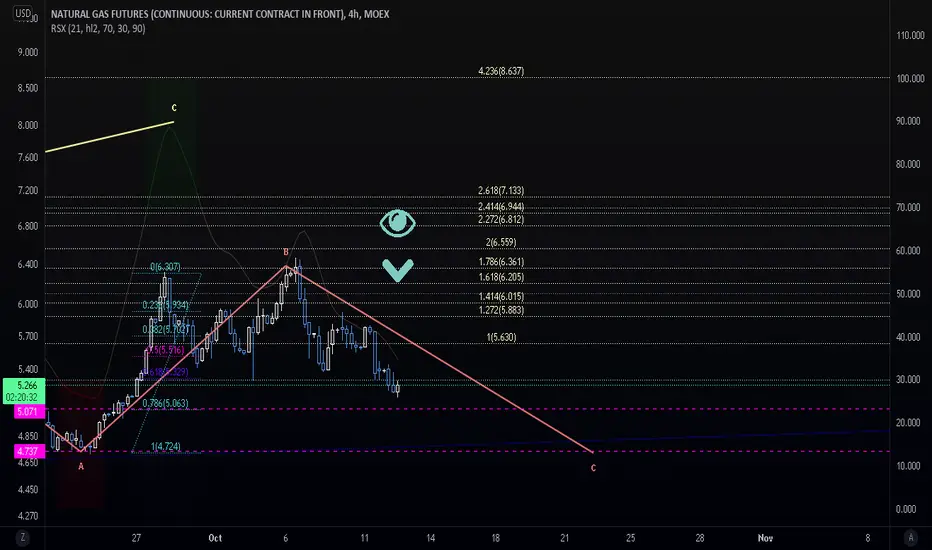
Complex analysis of "Natural Gas", the strongest analysis Complex analysis of "natural gas", the strongest analysis - know the upcoming price movement
Analyze natural gas prices in the short or medium term
The target is shown in the drawing. If Target 2 is breached upwards and stability, we will take off to the top
The analysis fails if it falls below $4.75
Several schools of technical analysis were used in this drawing. I hope you like it
Like - follow me
Ng1!f

Thursday: Natural Gas - Week 47Hello Traders! Check Related Idea for market context!!
I will update my idea as the trade progresses if any changes occur and my analysis is wrong, or need to be adapted to the new development of price-action.
Thanks for the support!
-----------------------------------------------------------------------------------------------------------------------
-----------------------------------------------------------------------------------------------------------------------
SMASH that follow button! 👍
💡 Leave a comment and/or message me on how I can improve and provide better content, I'm open to suggestions to create a better experience for you!
RISK DISCLAIMER: Please be advised that I am not telling anyone how to spend or invest their money. Take all of my videos as my own opinion, as entertainment, and at your own risk. I assume no responsibility or liability for any errors or omissions in the content of this channel. This content is for educational purposes only and is not tax, legal, financial, or professional advice. Any action you take on the information in this video is strictly at your own risk. We, therefore, recommend that you contact a personal financial advisor before carrying out specific transactions and investments. There is a very high degree of risk involved in trading. Past results are not indicative of future returns. Inotfancy.com and all individuals affiliated with this channel assume no responsibility for your trading and investment results.

Saturday: NGAS - Week 46Hello Traders! Check Related Idea for market context!!
I will update my idea as the trade progresses if any changes occur and my analysis is wrong, or need to be adapted to the new development of price-action.
Thanks for the support!
-----------------------------------------------------------------------------------------------------------------------
-----------------------------------------------------------------------------------------------------------------------
SMASH that follow button! 👍
💡 Leave a comment and/or message me on how I can improve and provide better content, I'm open to suggestions to create a better experience for you!
RISK DISCLAIMER: Please be advised that I am not telling anyone how to spend or invest their money. Take all of my videos as my own opinion, as entertainment, and at your own risk. I assume no responsibility or liability for any errors or omissions in the content of this channel. This content is for educational purposes only and is not tax, legal, financial, or professional advice. Any action you take on the information in this video is strictly at your own risk. We, therefore, recommend that you contact a personal financial advisor before carrying out specific transactions and investments. There is a very high degree of risk involved in trading. Past results are not indicative of future returns. Inotfancy.com and all individuals affiliated with this channel assume no responsibility for your trading and investment results.

Natural Gas futures slipping. NG1There has been quite a bit of turmoil in Europe with Russia and Natural gas and dwindling supplies. All that cause quite a stellar run up in gas prices. We believe that the overall run on natural gas is not done, but that we are taking a short and temporary break. After all, winter has not even started.
We are not in the business of getting every prediction right, no one ever does and that is not the aim of the game. The Fibonacci targets are highlighted in purple with invalidation in red. Fibonacci goals, it is prudent to suggest, are nothing more than mere fractally evident and therefore statistically likely levels that the market will go to. Having said that, the market will always do what it wants and always has a mind of its own. Therefore, none of this is financial advice, so do your own research and rely only on your own analysis. Trading is a true one man sport. Good luck out there and stay safe!
NG day trade could exist here so i fee as though a short term trade is here still but there is a chance we head lower I'm playing hnu.tsx in canada, do not touch it if you do not understand how contracts roll in the etf you will get screwed this is a risky play

NATURAL GAS Massive Long! Buy!
Hello,Traders!
NATURAL GAS is retesting a massvie support level
Which makes me bullish
And I think that we will see a rebound
And a move up from this support
With the modest target
But the price can go higher too!
Buy!
Like, comment and subscribe to boost your trading!
See other ideas below too!

NATURAL GAS TRADE IDEAMy trading strategy isn't intended to be used as a signal service. It's a process of gaining knowledge of market structure and improving my trading abilities.
Like and subscribe and happy trading to all

NG Aggressive Long IdeaI am currently long for the first scenario shown.
If there's a sustained break below the current low support line I will exit and look for a new long for the second scenario shown.

🔥 Natural gas will rise in price three times 🥶●● Preferred count
● NATURALGAS ( Currency.com ) 🕐TF:1W
Globally, the price of natural gas is driven by the third wave of the Grand Supercycle , within which the final wave (V) is developing. Wave (IV) that preceded it took the shape of a w-x-y double zigzag , although one should not exclude further complication before a sideways correction.
● NATGASUSD ( OANDA )🕐TF:1D
Behind the most powerful part of the wave ① of I — Third of a Third — 3 of (3) , on the horizon — a less rapid growth in the fifth waves, followed by a series of downward corrections.
● NATGASUSD ( OANDA )🕐TF:4h
A correction by wave 4 is expected in the form of an expanded flat , the target for which may be the area of the previous fourth .
● NATGASUSD ( OANDA )🕐TF:2h
Wave ⓒ of 4 , presumably, is unfolding the ending diagonal .
●● Alternative count
● NATGASUSD ( OANDA )🕐TF:2h
As an alternative count — wave 4 of (3) is a running contracting triangle . This interpretation implies the resumption of growth within wave 5 from the current levels.
Long position under the conditions of the implementation of the main scenario seems to me less risky, but the alternative count also offers good opportunities for long at current prices.

NATURALGAS, The top was not scored? $NG1 #naturalgasResistance at the key level 6.4. If it breaks, it will quickly rise to 8.4 and 9.7. Volumes are down but not too low yet to mark a period high. Will the growing demand from China cause the price to rise again?

𝗡𝗮𝘁 𝗚𝗮𝘀 𝗨𝗽𝗱𝗮𝘁𝗲: $NG_F Daily. H&S into NovemberFirst week of November has been the short past two years. Have been patiently watching this one and can see a H&S setting up. Major down TL on monthly ~6.5 otherwise large breakout
$UNG $BOIL $KOLD #NatGas #OOTT #Commodities #Trading

NATURAL GAS Will Go Up! Buy!
Hello,Traders!
NATURAL GAS is retesting a massive support level
And we are already seeing a bullish reaction
I don't think that the bullish rally is over yet
Thus, I am expecting the price to move up
Sell!
Like, comment and subscribe to boost your trading!
See other ideas below too!

i'm (as always) so stupidi have this shit circles(H&S) on my chart since a wile, yesterday i set a sell order at 5.55, and 10 min later i canceled it because of lack of confidence. i think ti will retrace to 5.46, but at this point it's just too risky entering, the perfect entry was yesterday.
will look for buy opportunities AFTER the bounce, could find floor at 4.80ish

Nat Gas. Short ▶ Targets on Chart Options play for a short on natural gas. If you are trading there is an obvious place to put your stop-loss above Tuesday's high. With the way Nat Gas has been volatile the past few days I also have a second sell limit entry just below 5.7. Targets are set out on the chart.
Please see the other ideas below as I am still holding (options) and i am also confident that they will come to fruition.
These thoughts are my own ideas based off my own analysis. Please do your own research before putting your own money into the markets.

✅NATURAL GAS LOCAL SHORT🔥
✅NATGAS broke the local horizontal key level
And is now retesting it form below
I think that a local bearish reaction is possible
Because gas is relatively overbought
So a correction is viewed as healthy
SHORT🔥
✅Like and subscribe to never miss a new idea!✅

NATURAL GAS : LONG POSITIONS SETUP | PRICE WILL GROW...Welcome back Traders, Investors, and Community!
Check the Links on BIO and If you LIKE this analysis, Please support our Idea by hitting the LIKE 👍 button
Traders, if you like this idea or have your own opinion about it, please write your own in the comment box . We will be glad for this.
Feel free to request any pair/instrument analysis or ask any questions in the comment section below.
Have a Good Day Trading !

NATURAL GAS Will Go UP! Buy!
Hello,Traders!
NATGAS is wildly bullish lately
And the price is retesting a horizontal support
I don't think that the rally is over
So I am betting it will go up
To retest the recent high
Perhaps it will go on to break it too
And go even higher
Buy!
Like, comment and subscribe to boost your trading!
See other ideas below too!

✅NATURAL GAS BULLISH PENNANT|LONG🚀
✅NATURAL GAS is trading in a massive uptrend
Due to the fundamental reasons
Pushed even higher by a massive short squeeze
In the options market to make matters worse
And now the price seems to be forming
A bullish pennant pattern on the 5H timeframe
So If we see a bullish breakout
That means that the price
Will keep going higher
LONG🚀
✅Like and subscribe to never miss a new idea!✅

When Might The Price Of Natural Gas Decompress?Traders that have taken a long position on Natural Gas will have been feeling lighter than air for the better part of 2021. Remarkably, the trading price of Natural Gas has rocketed up 115% since the beginning of the year, outperforming price increases in other commodities currently sitting close to record highs, Oats (up by 63.83% YTD), Copper (up by 19.65% YTD), and steel (up by 38.27% YTD). As of writing, Natural Gas is trading at $5.592 per million British thermal units, a thirteen year high for the commodity.
What Is The Reason For The Meteoric Rise In Natural Gas
An unusually scorching 2021 summer in the US drove demand for air conditioning and Natural Gas beyond normal levels, resulting in a lower stockpile of the commodity for an unusually cold winter. Following this, extreme weather conditions, such as Hurricane Ida, interrupted Natural Gas extraction in the Gulf of Mexico’s most productive zone.
Will The Price Of Natural Gas Recede?
Typically, when the price of a commodity rises, new investment will enter the market to scoop up the high prices. Regarding Natural Gas, the new investment could be from gas companies lifting output at existing gas wells or exploring new wells that will raise production. Counter-productively, the new investment and resulting lift in gas supply would help suppress the price rises in the commodity.
New investment in Natural Gas has stalled as of late. While fossil fuels will still be needed for a long time, so-called ‘Zero Carbon’ policies from governing bodies worldwide are disincentivising Natural Gas exploration. The long-term prospects of Natural Gas wells are less certain and less attractive when contending with the likes of the Biden Administration throwing its full support behind renewable energy sources as the US engages in a wide-scale upgrade to its infrastructure. One project for the Biden Administration is for the US electric grid to be powered by 50% solar within the next thirty years. Achieving this goal would severely squeeze demand for Natural Gas, which, according to the EPA, generated approximately 40% of the country’s electricity in 2020.

Natural Gas what a Move Natural gas again went to the same level of resistance as before, if it breakout you can easily take 1:4 or 5 risk reward

Descending Triangle in Natural Gas, Downside Target of 4.70Trend Analysis
The main view of this trade idea is on the 15-Min Chart. The commodity Natural Gas is currently in a descending triangle setup with lower highs around the 5.20 and 5.08 price levels and support observed around the 4.95 price level. If the commodity breaks through the 4.95 support it can head towards the 4.70 price level. Failure of this pattern will occur if Natural Gas were to rally above 5.10.
Technical Indicators
The commodity is currently trading below is short (50-MA), medium (100-MA) and long (200-MA) fractal moving averages. There has been negative crossovers on the short and medium as well as the medium and long term moving averages. These moves are bearish indications. To corroborate these signals of upcoming declines are the RSI being below the 50 level as well as a recent negative crossover in the KST.
Recommendation
The recommendation will be to go short at market, with a stop loss at 5.10 and a target of 4.70. This produces a risk/reward ratio of 2.31.
Disclaimer
The views expressed are mine and do not represent the views of my employers and business partners. Persons acting on these recommendations are doing so at their own risk. These recommendations are not a solicitation to buy or to sell but are for purely discussion purposes.

Natural Gas Target 4 acheived ..!!Finally Natural gas has respected all our level very accurately, i hope everyone made good money.

Natural Gas Respected the level gives accuratelyFollow the chart to make easy 1:3 profit in natural gas but keep in mind that the short term trend will remain downside it is making lower lows. **BUY ON SUPPORT AND SELL ON RESISTANCE**
