Natural Gas | Oil | Dollar | Silver | Gold Price ForecastNatural Gas | Oil | Dollar | Silver | Gold Price Forecast
Ng1!f

Natural Gas | Oil | Dollar | Silver | Gold Price ForecastNatural Gas | Oil | Dollar | Silver | Gold Price Forecast

NATGAS My Opinion! SELL!
My dear friends,
NATGAS looks like it will make a good move, and here are the details:
The market is trading on 3.749 pivot level.
Bias - Bearish
Technical Indicators: Supper Trend generates a clear short signal while Pivot Point HL is currently determining the overall Bearish trend of the market.
Goal - 3.574
About Used Indicators:
Pivot points are a great way to identify areas of support and resistance, but they work best when combined with other kinds of technical analysis
———————————
WISH YOU ALL LUCK

NATGAS: Short Trade with Entry/SL/TP
NATGAS
- Classic bearish pattern
- Our team expects retracement
SUGGESTED TRADE:
Swing Trade
Sell NATGAS
Entry - 3.749
Stop - 3.948
Take - 3.376
Our Risk - 1%
Start protection of your profits from lower levels
❤️ Please, support our work with like & comment! ❤️

Natural Gas | Oil | Dollar | Silver | Gold Price ForecastNatural Gas | Oil | Dollar | Silver | Gold Price Forecast

NATGAS: Bullish Continuation is Expected! Here is Why:
The charts are full of distraction, disturbance and are a graveyard of fear and greed which shall not cloud our judgement on the current state of affairs in the NATGAS pair price action which suggests a high likelihood of a coming move up.
❤️ Please, support our work with like & comment! ❤️

NATGAS Will Explode! BUY!
My dear followers,
I analysed this chart on NATGAS and concluded the following:
The market is trading on 3.268 pivot level.
Bias - Bullish
Technical Indicators: Both Super Trend & Pivot HL indicate a highly probable Bullish continuation.
Target - 3.355
About Used Indicators:
A super-trend indicator is plotted on either above or below the closing price to signal a buy or sell. The indicator changes color, based on whether or not you should be buying. If the super-trend indicator moves below the closing price, the indicator turns green, and it signals an entry point or points to buy.
———————————
WISH YOU ALL LUCK

Natural Gas | Oil | Dollar | Silver | Gold Price ForecastNatural Gas | Oil | Dollar | Silver | Gold Price Forecast

NATGAS BULLISH BIAS|LONG|
✅NATGAS fell again to retest the support of 3.20$
But it is a strong key level
So I think that there is a high chance
That we will see a bullish rebound and a move up
LONG🚀
✅Like and subscribe to never miss a new idea!✅

NATGAS: Bearish Forecast & Outlook
The charts are full of distraction, disturbance and are a graveyard of fear and greed which shall not cloud our judgement on the current state of affairs in the NATGAS pair price action which suggests a high likelihood of a coming move down.
❤️ Please, support our work with like & comment! ❤️

NATGAS What Next? SELL!
My dear subscribers,
My technical analysis for NATGAS is below:
The price is coiling around a solid key level - 3.106
Bias - Bearish
Technical Indicators: Pivot Points Low anticipates a potential price reversal.
Super trend shows a clear sell, giving a perfect indicators' convergence.
Goal - 3.067
About Used Indicators:
By the very nature of the supertrend indicator, it offers firm support and resistance levels for traders to enter and exit trades. Additionally, it also provides signals for setting stop losses
———————————
WISH YOU ALL LUCK

NATGAS Will Grow! Buy!
Hello,Traders!
NATGAS made a retest of
The horizontal support level
Of 3.00$ and we are already
Seeing a local bullish rebound
So we will be expecting a
Further bullish move up
Buy!
Comment and subscribe to help us grow!
Check out other forecasts below too!

NATGAS BULLISH REBOUND AHEAD|LONG|
✅NATGAS will be retesting a support level of 3.128$ soon
From where I am expecting a bullish reaction
With the price going up but we need
To wait for a reversal pattern to form
Before entering the trade, so that we
Get a higher success probability of the trade
LONG🚀
✅Like and subscribe to never miss a new idea!✅

Natural Gas | Oil | Dollar | Silver | Gold Price ForecastNatural Gas | Oil | Dollar | Silver | Gold Price Forecast

NATURAL GAS - 2025 IS THE LAST YEAR IT WILL BE CHEAP !📣 Hello everyone!
I believe that with a high degree of probability, a long-term reversal model "Inverted head and shoulders" is being formed on the price chart of natural gas.
If the above is true, then in 2025 the right shoulder will be formed and this is the last year when natural gas will cost so cheap $$ !
From my point of view, after the "Inverted head and shoulders" model finds its confirmation, or if the high 9.1560$ is broken even earlier, WE CAN CONDITIONALLY SAY THAT THE PRICE OF GAS WILL NEVER DROP <1.5$ AGAIN - IN MY UNDERSTANDING, THIS PROBABILITY IS >90%
Oil will also form a bottom next year and from the end of 2025 - the beginning of 2026, I expect the beginning of a long-term bull market!
That's all for today, I wish you good luck in making independent trading decisions and profit. Please analyze the information received from me, always think only with your head!
Goodbye! ✊

NATGAS Support Ahead! Buy!
Hello,Traders!
NATGAS is going down to
Retest the horizontal support
Of 3.09$ and as we are
Locally bullish biased
We will be expecting a
Local bullish rebound
Buy!
Comment and subscribe to help us grow!
Check out other forecasts below too!

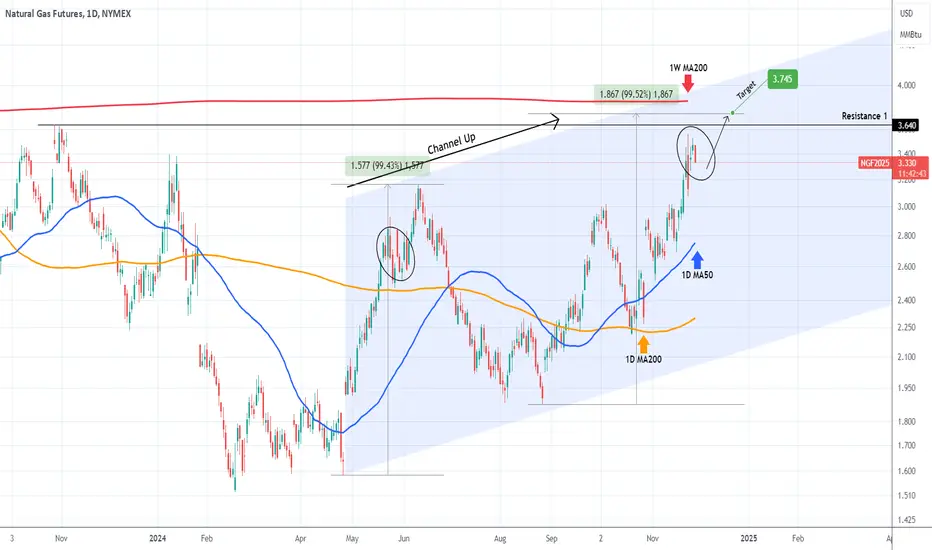
NATURAL GAS Final push before peakingNatural Gas (NG1!) rose and hit our 2.900 Target called on our last analysis (August 29, see chart below) and after a pull-back, broke above the Triangle:
The Triangle transitioned to a Channel Up and the price is already near the end of its Bullish Leg. The 1W MA200 (red trend-line) is the long-term Resistance (untouched since January 17 2023) so only above it can we justify a new bullish trend.
Until then, our Target is 3.745, which represents a +99.50% rise from the last Higher Low, which is the same % rise as the first Bullish Leg of the Channel Up.
-------------------------------------------------------------------------------
** Please LIKE 👍, FOLLOW ✅, SHARE 🙌 and COMMENT ✍ if you enjoy this idea! Also share your ideas and charts in the comments section below! This is best way to keep it relevant, support us, keep the content here free and allow the idea to reach as many people as possible. **
-------------------------------------------------------------------------------
💸💸💸💸💸💸
👇 👇 👇 👇 👇 👇
Crude Oil to $72 and then potentially $75Crude Oil to $72 and then potentially $75
Idea would invalidate with a daily close below $68.8

NATGAS SHORT FROM RESISTANCE|
✅NATGAS is going up now
But a strong resistance level is ahead of 3.646$
Thus I am expecting a pullback
And a move down towards the target at 3.300$
SHORT🔥
✅Like and subscribe to never miss a new idea!✅

Natural Gas BULLISH REVERSAL!!!All eyes on NYMEX:NG1! !!! Macro chart's about to confirm a bullish trend as price is making lower highs and higher highs. Ideally we want a strong close above $3.6. Any retrace towards $2.5 should be a buy opportunity. HUGE FVG to the upside.

Natural Gas: Analyzing Seasonal Trends and Supply PressuresIn the natural gas market, we observe a critical juncture that suggests a potential shift in pricing trends. Over the past decade, historical data has revealed a recurring seasonal pattern that may indicate the onset of a bearish phase during this particular time of year.
Currently, the market is approaching a significant supply zone, which could serve as a pivotal trigger for price corrections. This area has consistently tested traders' sentiments, and if the pressures of supply outstrip demand, it may catalyze a downward movement in prices.
Given these observations, positioning for a short scenario seems increasingly viable. As market participants weigh their options, it is essential to remain vigilant and analyze how these supply-demand dynamics will unfold in the coming weeks. Understanding the interplay between seasonal trends and market sentiment will be crucial as we navigate this potentially shifting landscape in the natural gas sector.
✅ Please share your thoughts about NG in the comments section below and HIT LIKE if you appreciate my analysis. Don't forget to FOLLOW ME; you will help us a lot with this small contribution.

Natural Gas | Oil | Dollar | Silver | Gold Price ForecastNatural Gas stock Bulls Support & Resistance Guide

NATGAS REBOUND AHEAD|LONG|
✅NATGAS is approaching a demand level around 3.00$
So according to our strategy
We will be looking for the signs of the reversal in the trend
To jump onto the bearish bandwagon just on time to get the best
Risk reward ratio for us
LONG🚀
✅Like and subscribe to never miss a new idea!✅
