NATGAS BULLISH BREAKOUT|LONG|
✅NATGAS is trading in an
Uptrend and we are seeing
A bullish breakout which
Makes us bullish biased and
We will be expecting a
Further move up
LONG🚀
✅Like and subscribe to never miss a new idea!✅
Ng1!f

NATGAS Risky Short! Sell!
Hello,Traders!
NATGAS is about to retest
A horizontal resistance
Of 3.024$ from where
We will be expecting
A local bearish correction
Sell!
Like, comment and subscribe to help us grow!
Check out other forecasts below too!

Natural Gas | Oil | Dollar | Silver | Gold Price ForecastNatural Gas | Oil | Dollar | Silver | Gold Price Forecast
AMEX:USO Oil Stock Forecast
TVC:DXY US dollar Stock Forecast
Gold OANDA:XAUUSD Stock Forecast
Silver OANDA:XAGUSD

NATGAS Set To Fall! SELL!
My dear friends,
Please, find my technical outlook for NATGAS below:
The price is coiling around a solid key level -2.837
Bias - Bearish
Technical Indicators: Pivot Points Low anticipates a potential price reversal.
Super trend shows a clear sell, giving a perfect indicators' convergence.
Goal - 2.760
About Used Indicators:
The pivot point itself is simply the average of the high, low and closing prices from the previous trading day.
———————————
WISH YOU ALL LUCK

NG1! SHORT FROM RESISTANCE
Hello, Friends!
We are now examining the NG1! pair and we can see that the pair is going up locally while also being in a uptrend on the 1W TF. But there is also a powerful signal from the BB upper band being nearby, indicating that the pair is overbought so we can go short from the resistance line above and a target at 2.135 level.
✅LIKE AND COMMENT MY IDEAS✅

NATGAS: Bears Will Push
Balance of buyers and sellers on the NATGAS pair, that is best felt when all the timeframes are analyzed properly is shifting in favor of the sellers, therefore is it only natural that we go short on the pair.
❤️ Please, support our work with like & comment! ❤️

NATGAS Set To Grow! BUY!
My dear followers,
I analysed this chart on NATGAS and concluded the following:
The market is trading on 2.665 pivot level.
Bias - Bullish
Technical Indicators: Both Super Trend & Pivot HL indicate a highly probable Bullish continuation.
Target - 2.739
About Used Indicators:
A super-trend indicator is plotted on either above or below the closing price to signal a buy or sell. The indicator changes color, based on whether or not you should be buying. If the super-trend indicator moves below the closing price, the indicator turns green, and it signals an entry point or points to buy.
———————————
WISH YOU ALL LUCK

Natural Gas Oil, Dollar, Silver, Gold Price ForecastNatural Gas stock Bulls
Gold OANDA:XAUUSD Stock Forecast
Silver OANDA:XAGUSD

NATGAS: Bullish Continuation is Expected! Here is Why:
Our strategy, polished by years of trial and error has helped us identify what seems to be a great trading opportunity and we are here to share it with you as the time is ripe for us to buy NATGAS.
❤️ Please, support our work with like & comment! ❤️

NG, prepping for a multi weekly gain come December 2023NG based on monthly data is registering very significant net buy volume at the current price range.
Seller's strength is certainly fading out based on thinning price volatility this past few days / weeks -- as shown on yellow price lines on chart.
NG is currently sitting at a strong major support at 2.0 to 2.5 area, a 1.0 FIB discount level -- this is where most buyers converge.
Initial trend shift has been spotted at the present price range.
Spotted at 2.50
TAYOR
Safeguard capital always.

Natural Gas | Oil, Dollar, Silver, Gold Price ForecastNatural Gas stock Bulls PEPPERSTONE:NATGAS Support & Resistance Guide
AMEX:USO Oil Stock Forecast
TVC:DXY US dollar Stock Forecast
Gold OANDA:XAUUSD Stock Forecast
Silver OANDA:XAGUSD

Natural Gas still coiling! breakdown or breakout?Hello Traders
In This Chart NATGAS HOURLY Forex Forecast By FOREX PLANET
today NATGAS analysis 👆
🟢This Chart includes_ (NATGAS market update)
🟢What is The Next Opportunity on NATGAS Market
🟢how to Enter to the Valid Entry With Assurance Profit
This CHART is For Trader's that Want to Improve Their Technical Analysis Skills and Their Trading By Understanding How To Analyze The Market Using Multiple Timeframes and Understanding The Bigger Picture on the Charts

Natural Gas Goldmine: Are You Ready to Take the Red Pill?Unlocking the Natural Gas Goldmine: Are You Ready to Take the Red Pill?
In the ever-shifting sands of the financial markets, the truth often lies buried beneath layers of noise and confusion. Today, we delve into the Commitment of Traders (COT) data, a powerful tool that reveals a compelling opportunity in the natural gas market. What if I told you that the signs are aligning for a potential rally? But heed this warning: This does not mean to blindly dive into long positions. Instead, we stand poised, awaiting the moment of a confirmed trend change on the daily timeframe—a moment that transforms potential into profit.
The Market Signals: A Gathering Storm
The data speaks volumes. Commercial traders, the real players in this game, are currently positioned at a major extreme in long holdings—the highest they’ve been in over three years. This is not mere coincidence; it’s a clear indication that something significant is brewing beneath the surface.
As we analyze the net open interest, we observe a phenomenon I like to call the “Bubble Up.” This surge occurs when Commercials outpace Large Speculators, and such dynamics often foreshadow market turning points. The whispers of a shift in power are growing louder, and it’s time to listen closely.
Furthermore, we cannot overlook the increasing open interest during this multi-week decline. But we must ask ourselves: Who is driving this increase? The answer is clear—commercial traders are loading up on long positions. This is a bullish sign, indicating confidence in a market reversal.
The Premium Charge: An Ominous Signal of Change
Adding another layer to our bullish thesis is the current premium charge in the market. We observe that the front months, extending out to April, are trading at a premium compared to later delivery months. This indicates a strong demand for immediate delivery—a sign that the market expects an uptick in prices.
But let us not forget the supplementary indicators that further bolster our long stance: the Price Oscillator Indicator Value (POIV), %R, and the Ultimate Oscillator are all aligning in favor of the bulls. They whisper of impending change, urging us to prepare.
The Seasonal Anomaly: A Moment of Reflection
Yet, as we pursue this truth, we encounter an obstacle. The traditional seasonal patterns suggest a decline until February, but the extreme positioning of commercial long traders casts doubt on this warning. Sometimes, the path to enlightenment requires us to look beyond conventional wisdom.
In this moment, we find ourselves at a crossroads. The insights we’ve gathered are akin to a revelation, a glimpse into the potential future of natural gas.
The Choice is Yours
Will you take the red pill and see how deep the rabbit hole goes? Embrace the knowledge, or remain in the shadows. The markets are waiting, and so is your potential.
Welcome to your awakening.

Natural Gas: Inverse Head & Shoulders targets $4.67The series of three valleys with the lowest bottom in between shaped notorious Inverse Head & Shoulders pattern in Natural Gas futures chart.
It's bullish reversal pattern.
Price eyes to break above the Neckline to trigger the pattern.
Target is located at the size of the Head added to the Neckline break point at $4.67.
Invalidation is below the trough of Right Shoulder at $1.88
Indicators support this bullish pattern:
1) RSI retested the midline and bounced up
2) Price retested 52-week MA and bounced up
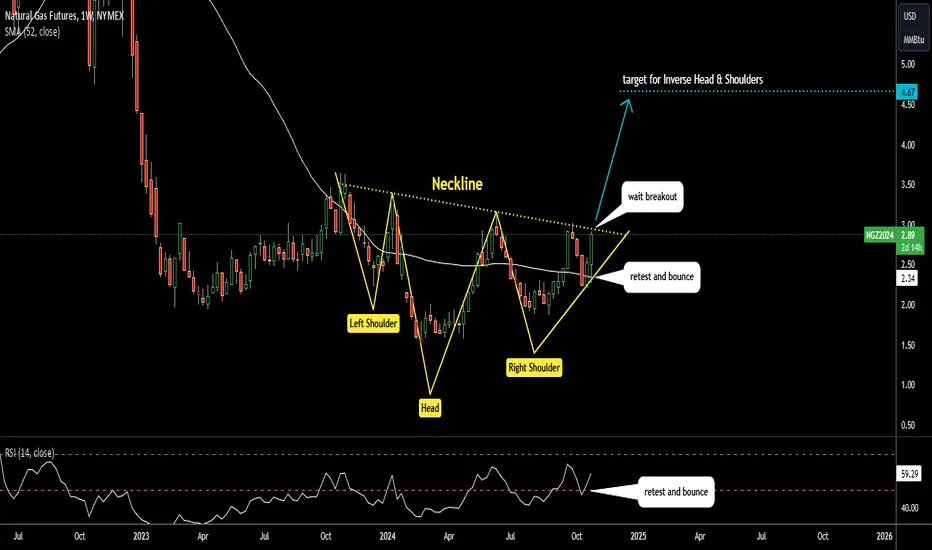
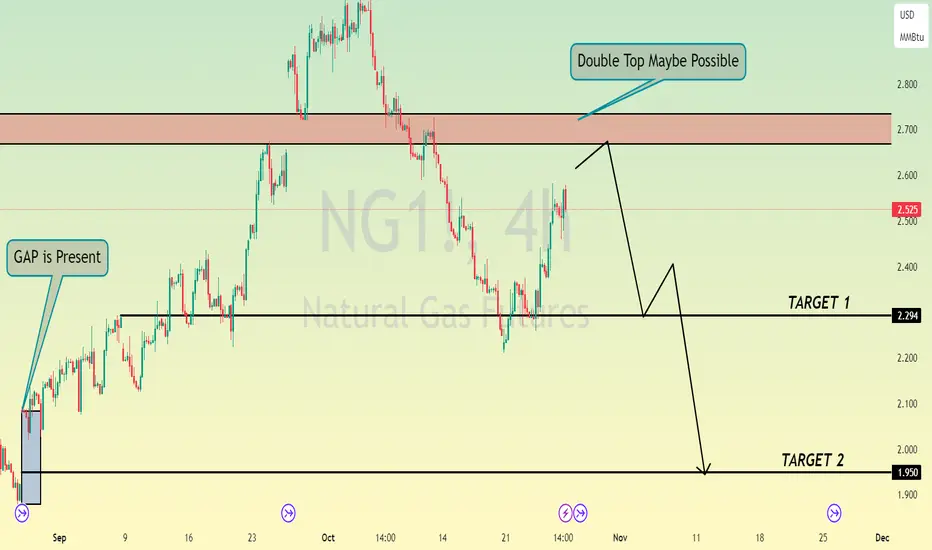
NATGAS The Target Is DOWN! SELL!
My dear followers,
I analysed this chart on NATGAS and concluded the following:
The market is trading on 2.525pivot level.
Bias - Bearish
Technical Indicators: Both Super Trend & Pivot HL indicate a highly probable Bearish continuation.
Target - 2.384
About Used Indicators:
A super-trend indicator is plotted on either above or below the closing price to signal a buy or sell. The indicator changes color, based on whether or not you should be buying. If the super-trend indicator moves below the closing price, the indicator turns green, and it signals an entry point or points to buy.
———————————
WISH YOU ALL LUCK

Smart Money's Secret Signal - Commercials Loading Up on NattySmart Money's Secret Signal: Commercial Traders Are Loading Up on Natural Gas
The natural gas market is displaying compelling signals that suggest a potentially significant bullish trend change on the horizon. Through careful analysis of the Commitment of Traders (COT) report and several other key market indicators, we're seeing a convergence of bullish factors that warrant close attention from market participants.
Commercial Positioning at Multi-Year Extremes
Perhaps the most significant indicator is the current positioning of commercial traders, who are now more long than they've been in over three years. Commercial traders, often considered the "smart money" in commodity markets, tend to have the most comprehensive understanding of supply and demand dynamics. Their extreme long positioning is a powerful bullish signal that shouldn't be ignored.
Open Interest Analysis Confirms Bullish Outlook
Recent weeks have shown a notable increase in open interest concurrent with price declines. This relationship between price and open interest becomes particularly meaningful when we examine who's driving the increase of OI. In this case, the increase in open interest is primarily attributed to commercial traders building long positions – a highly bullish indication that suggests strong hands are accumulating positions at current price levels.
Contrarian Indicators Support the Bullish Case
Several contrarian indicators are aligning to support the bullish thesis:
-Investment advisor sentiment is currently very bearish, which historically has been a reliable contrarian indicator.
-Small speculators are showing extreme short positioning, and this group tends to be wrong at market extremes.
-Natural gas is undervalued when compared to historical relationships with gold and U.S. Treasuries.
Technical Confirmation Signals
The technical picture is adding weight to the bullish case:
-The Average Directional Index (ADX) has triggered a buy signal, dropping below 20 while commercials shifted to extreme long positioning.
-A bullish spread divergence has emerged between front-month and second-month contracts, implying immediate commercial demand for the front month, which is bullish.
-A major weekly bullish divergence has recently confirmed, suggesting potential for significantly higher prices.
Market Structure and Timing
While these indicators paint a compelling picture for higher natural gas prices, it's crucial to understand that this analysis doesn't necessarily call for immediate long positioning. Rather, it suggests that the market is fundamentally "setting up" for an upward move. Traders should wait for confirmation through a daily bullish trend change before considering positions.
The Power of COT Analysis in Trading
The Commitment of Traders report remains one of the most powerful yet underutilized tools in market analysis. Understanding how to interpret this data, particularly when combined with other technical and fundamental indicators, can provide traders with a significant edge in the markets. While many traders focus solely on price action or technical indicators, the COT report offers unique insights into the positioning of the market's most informed participants.
Ready to master the art of COT analysis and gain access to professional-grade market insights? Reach out to us today to take your trading to the next level.
Risk Disclaimer
IMPORTANT: The analysis provided in this article is for educational and informational purposes only and should not be construed as investment advice or a recommendation to buy or sell any security or derivative. Trading natural gas futures, options, or any other financial instruments involves substantial risk of loss and is not suitable for all investors. The market analysis presented here represents the opinion of the author based on the data available at the time of writing, but markets are dynamic and can change rapidly.
Past performance is not indicative of future results. The indicators and analysis techniques discussed in this article may not work in all market conditions and should not be relied upon as the sole basis for any investment decision. Before trading, you should carefully consider your investment objectives, level of experience, and risk appetite. You should only trade with money you can afford to lose.
It is strongly recommended that you conduct your own research and due diligence before making any investment decisions. You should also consult with a licensed financial advisor or broker regarding your specific situation. The author and the trading community mentioned may have positions in the securities discussed and may trade in these securities at any time.

Natural Gas Oil, Dollar, Silver, Gold Price ForecastNatural Gas stock Bulls PEPPERSTONE:NATGAS Support & Resistance Guide
AMEX:USO Oil Stock Forecast
TVC:DXY US dollar Stock Forecast
Gold OANDA:XAUUSD Stock Forecast
Silver OANDA:XAGUSD

Natural Gas still coiling! breakdown or breakout?Hello Traders
In This Chart NATGAS HOURLY Forex Forecast By FOREX PLANET
today NATGAS analysis 👆
🟢This Chart includes_ (NATGAS market update)
🟢What is The Next Opportunity on NATGAS Market
🟢how to Enter to the Valid Entry With Assurance Profit
This CHART is For Trader's that Want to Improve Their Technical Analysis Skills and Their Trading By Understanding How To Analyze The Market Using Multiple Timeframes and Understanding The Bigger Picture on the Charts
Natural Gas is Ready For a Commercially Driven Bull MoveNatural gas is nicely setup for longs if we get a confirmed bullish trend change on the daily.
-Extreme commercial long positioning (most long they've been in the last 3 years) - bullish.
-Investment advisor sentiment very bearish - which is actually bullish.
-Undervalued vs gold & treasuries - bullish.
-ADX under 40 while commercials got extremely long - bullish.
-Bullish spread divergence between front month and next month out - bullish.
-Small specs at extreme in short positioning - bullish.
-True seasonal & some cycles are not supportive of going long, but these are the last things I look at. Enough indicators are supporting longs that I'm not going to worry about this.
-Bullish momentum divergence has triggered on some high timeframes, implying much higher prices are on the cards for Natty. There is also some smaller bullish weekly divergence currently setup (but not confirmed).
Have a good week.

NATGAS: Bears Will Push
The charts are full of distraction, disturbance and are a graveyard of fear and greed which shall not cloud our judgement on the current state of affairs in the NATGAS pair price action which suggests a high likelihood of a coming move down.
❤️ Please, support our work with like & comment! ❤️

Will the Perfect Storm in Natural Gas Markets Lead to a New EnerIn an era of unprecedented global energy transformation, the natural gas market stands at a critical juncture where geopolitical tensions, technological advancement, and infrastructure development converge to create a potentially game-changing scenario. The ongoing Middle East crisis, particularly the Israel-Iran tensions threatening the Strait of Hormuz, could reshape energy flows and trigger a cascade of effects across interconnected global energy markets, potentially forcing a fundamental reassessment of natural gas's role in the global energy mix.
A seismic shift is approaching in North American markets with LNG Canada's anticipated 2025 launch, which promises to revolutionize Canadian gas pricing dynamics and global market access. This transformation coincides with an extraordinary surge in potential demand from AI and data centers, projected to consume between 3 and 30 billion cubic feet per day of additional North American gas. Such technological evolution, coupled with Asia's growing appetite for cleaner energy sources, suggests a structural reformation of traditional gas flow patterns and pricing mechanisms.
The convergence of these factors presents both challenges and opportunities for market participants. While weather patterns and storage dynamics continue to influence short-term price formation, longer-term strategic considerations are increasingly dominated by infrastructure development, market access, and geopolitical risk management. As the industry adapts through strategic hedging, infrastructure investment, and consolidation, the natural gas market appears poised for a period of dynamic evolution that could fundamentally alter its global value proposition and establish a new paradigm in energy markets.

NATGAS RESISTANCE AHEAD|SHORT|
✅NATGAS is going up now
But a strong resistance level is ahead at 2.55$
Thus I am expecting a pullback
And a move down towards the target at 2.40$
SHORT🔥
✅Like and subscribe to never miss a new idea!✅

NGAS cup and handle / inverse HSForming a bullish inverse HS, or a cup and handle. If the trend line is finally broken, PT 3.50$ and 4.20$ in the horizon, NGAS usually spikes around year end due to increasing storage
