Natural gas Elliott wave analysisAnalysis does not take account of current geopolitical situation and is based solely on Elliott wave analysis.
I would assume the it will follow the black more than the red scenario.
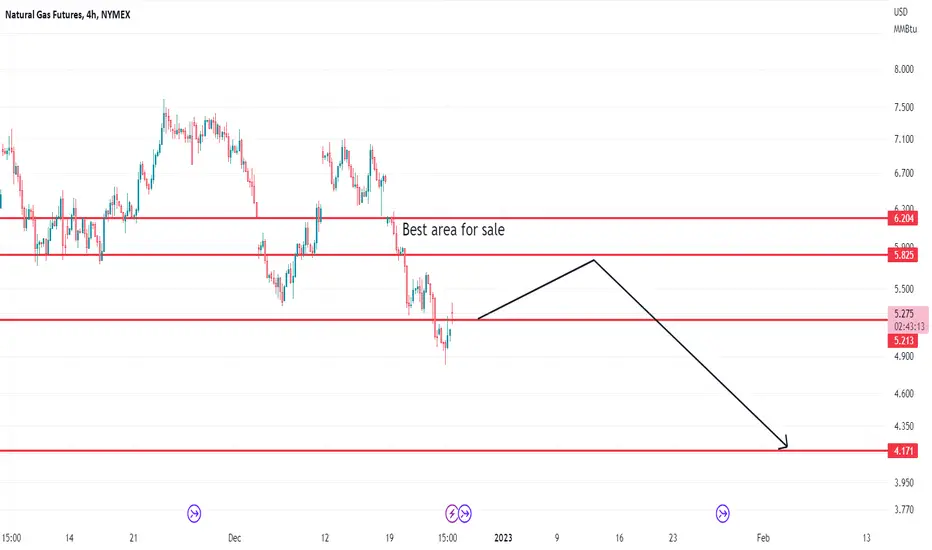
5.80 is the point where you would exit most of your shorts.
Ng1

Natural gas: When will the bloodshed stop?Natural gas prices (US Henry Hub) plunged 20% in the first week of 2023, dropping below pre-Russian invasion of Ukraine levels and continuing losses seen in the fourth quarter of 2023.
The sell-off was violent, mimicking a falling knife pattern, with prices sliding back to levels seen towards the end of 2021 and the RSI returning to oversold territory. aPrices are now two standard deviations lower than the 20-day moving average, while the 50-day and 200-day moving averages trade 70% and 100% above, respectively, than current prices. The decline from the highs reached in August is around 65%.
It appears that the apocalypse has arrived for the asset class that rose by 100% in the first eleven months of 2022, outperforming all major markets, only to lose all of its profits in one month.
Extremely high temperatures in Europe and the United States over the winter season kept natural gas supplies plentiful, causing prices to fall. According to NOAA predictions, temperatures on the North American continent will be above normal again in January 2023.
Prices for natural gas have hit a support level not seen in over a year, suggesting that an abundance of pessimism is already included into market valuations. Below this level of support, the next level to watch is 3.02 (June 2021 lows) and the psychological 3.00 level. That would imply a 70% loss from the peak, which would support some dip buying given that the market has not yet fully resolved the 2022 geopolitical issues.
In this case, technical analysis suggests that further declines are likely to be contained; similar oversold RSI levels in the past have been followed by weeks of bullish price action, suggesting that this sharp decline may not be without some upward potential. Prices might return to 4.47, the level at which they traded on the day of Russia's invasion of Ukraine.

NATGAS Long From Support! Buy!
Hello,Traders!
NATGAS has collapsed and
Has reached a strong horizontal
Support level from where
A local bullish rebound
Is likely to happen
Buy!
Like, comment and subscribe to boost your trading!
See other ideas below too!

NATURAL GAS Potential rebound but bearish long-term.Last time we gave a signal on Natural Gas (NG1!) in late November, we caught a perfect rejection and sell entry for a strong bearish December trend:
As you see, the price even closed below the 1W MA100 (red trend-line), breaking its previous 1 year Bullish Megaphone pattern, so the trend is confirmed as bearish long-term. By doing so, it has formed a Channel Down whose bottom (Lower Lows trend-line) was hit and the price bounced yesterday. Today though it resumed the downtrend.
We believe the key here is the RSI on the 1W time-frame and the Falling Wedge pattern we identified last time. This is now on its bottom as it was on October 21 2022 Low, which caused the short-term rebound to a Lower High for the Channel Down.
As long as it holds, we expect the price to rebound on the short-term in order to test the 1W MA100 and 1D MA50 (blue trend-line). A rejection there should extend the Channel Down to a new Lower Low. A break of the Channel Down downwards earlier, will simply accelerate the downtrend to the 0.618 Fibonacci and the long-term Support Zone just above the 0.786 Fib. Notice that right now the price is on the 0.5 Fibonacci.
-------------------------------------------------------------------------------
** Please LIKE 👍, FOLLOW ✅, SHARE 🙌 and COMMENT ✍ if you enjoy this idea! Also share your ideas and charts in the comments section below! This is best way to keep it relevant, support me, keep the content here free and allow the idea to reach as many people as possible. **
-------------------------------------------------------------------------------
You may also TELL ME 🙋♀️🙋♂️ in the comments section which symbol you want me to analyze next and on which time-frame. The one with the most posts will be published tomorrow! 👏🎁
-------------------------------------------------------------------------------
💸💸💸💸💸💸
👇 👇 👇 👇 👇 👇

NATURAL GAS🔥 breakoutNG1! broke down out of the raising wedge (yellow) and I expect further downside. It will prolly not be in straight line, pullbacks along the way expected. Actually now we are sitting at the support zone 7.78 - 7.55, so bounce up or sideways before next leg down is possible. Target being the support zone 6.46-5.95 and potentially the lime uptrendline.
Also there is a upward channel (blue) on the log scale:
Will we test the channel lower edge?
Let me know in the comments how much has your gas bill risen if you already pay new price.
Check my other stuff in related ideas.
Please boost🚀, comment🗣️, follow me✒️, enjoy📺!
⚠️Disclaimer: I'm not financial advisor. This is not a financial advice. Do your own due dilingence.

Natural Gas (NATGASUSD): Key Structure Ahead!
What a bearish rally on Natural Gas.
Ahead, I spotted a key horizontal weekly demand zone.
3.48 - 3.7 area matches perfectly with a completion point of a harmonic abcd pattern.
I will expect a bullish movement from the underlined area at least to 5.0 level.
Good luck!
❤️If you have any questions, please, ask me in the comment section.
Please, support my work with like, thank you!❤️

Natural Gas #NG - Target 4.9, 4.5 Natural Gas has been pulling back for last few months. It has hit double bottom today at 5.325 and I would expect some technical bounce of that level. Overall trend for NG is bearish, I expect it to next level major support 4.92 and 4.5 in next few weeks or months.

NG1 It is important to remember that trading in any financial market carries inherent risks, and it is essential to develop a sound trading strategy and properly manage your risk in order to minimize potential losses.
NATGAS Long Update! Buy!
Hello,Traders!
Here is another dimension
To the NG bullish forecast
That I posted last week.
In there we established
That the price is about to retest
The long-term rising support line
From where the rebound is almost
Inevitable. Now, the price has indeed
Almost reached that support and today
We are taking a closer look at the gas chart.
As you can see the rising support is
Confluencing with the horizontal support level
Which reinforces our bullish bias
And we are already seeing a bullish reaction
So I think that we can expect a move higher
And a retest of the local
Horizontal resistance level above
Buy!
Like, comment and subscribe to boost your trading!
See other ideas below too!

✅NATGAS BUYING OPPORTUNITY|LONG🚀
✅NATGAS is retesting a key support level
So I think that GAS will make a rebound
And go up to retest the supply level above
LONG🚀
✅Like and subscribe to never miss a new idea!✅

✅NATGAS LONG FROM SUPPORT🚀
✅NATGAS is approaching a demand level
So according to our strategy
We will be looking for the signs of the reversal in the trend
To jump onto the bullish bandwagon just on time to get the best
Risk reward ratio for us
LONG🚀
✅Like and subscribe to never miss a new idea!✅

NATGAS Swing Long! Buy!
Hello,Traders!
NATGAS is trading along the
Long-term rising trend-line
And the price is about
To retest the support
From where a rebound
And a move up are
To be expected
Buy!
Like, comment and subscribe to boost your trading!
See other ideas below too!

Natural Gas (NATGASUSD): Time to Grow?! 💨
Natural Gas dropped to a key weekly/daily demand zone one more time.
Chances will be high to see a pullback from that.
A bullish breakout of a falling parallel channel on 1H time frame confirms the strength of bulls.
Goals: 5.6 / 5.8
❤️If you have any questions, please, ask me in the comment section.
Please, support my work with like, thank you!❤️

Natural Gas is looking for a pullbackNatural Gas had a huge drop, then a big bounce (3 day bar surge!). It looks like it has hit resitance again and may fall into that lower bear target area.

NG1! NEW UPDATE HELLO GUYS THIS MY IDEA 💡ABOUT NG1! is nice to see strong volume area....
Where is lot of contract accumulated..
I thing that the buyers from this area will be defend this LONG position..
and when the price come back to this area, strong buyers will be push up the market again..
UP TREND + Resistance from the past + Strong volume area is my mainly reason for this long trade..
IF you like my work please like and follow thanks

Opening (Margin): /NG January 26th 12.5/13.5 Short Call Vertical... for a 1.80 credit.
Comments: Short call vertical hedge against my short put verticals. Will look to take off the 1.8/2.8/12.5/13.5 iron condor on which I've collected a total of 3.60 ($360) as a unit at 50% max and scratch out the more at-risk 1.9/2.9 short put vertical if I get the opportunity.

NATGAS Next Support! Buy!
Hello,Traders!
NATGAS is going down
But a local horizontal support
Is ahead of the price so I think
After the retest we will see
A local bullish rebound
Buy!
Like, comment and subscribe to boost your trading!
See other ideas below too!

Natural Gas to GrowIt seems NG has started a new impulse wave as it finished C move down in late October. The momentum in price sees a higher low, and a potential for a bullish continuation should see a test of $7.1 resistance level. Major resistance is seen at $9.7.
I see energy as the ONLY short-medium term gainer. NASDAQ has been underperforming greatly in the index range, and will probably continue to see lower demand as earnings have been disappointing, and Fed's tightening policy continues.

Opening (Margin): /NG January 26th 1.90/2.90 Short Put Vertical... for a 1.70 credit.
Comments: Neutral to bullish assumption trade on weakness. 1.70 credit on buying power effect of 16.41; 10.4% ROC at max as a function of buying power effect; 5.2% at 50% max.

Opening (Margin): /NG January 26th 1.80/2.80 Short Put Vertical... for a 1.90 credit.
Comments: Adding to my neutral to bullish assumption natural gas trade at slightly lower strikes. 1.90 credit on 16.87 of buying power; 11.3% ROC at max as a function of buying power effect; 5.6% at 50% max.

NATGAS JUST CROSSED VERY POWERFUL LEVELPEPPERSTONE:NATGAS
Hi!
I've been trading in last 2 months very actively NATGAS.
I have noticed there is very powerful level which we just crossed again. If 4h candle stay above then according to historical data we should have strong move up.
Apart of this we have news about cold weather hitting Europe. So let's see.
I'm long from friday and SL way above in profit but Im looking for adding more to my position.
Under the actual price is sitting volume spike where we could rebounce even we had such a big move after todays opening.
If not then I will look for entries for long. I'm not interested in short at the moment even I had most of my good profits from shorts.
Good luck!
M
This is not any financial advise, always check the market before entering any position and like it if you find it useful
NYMEX:NG1!
SKILLING:NATGAS

Natural GasHeading into the season, not an ideal set up with all the over extensions we have had in the past year with the commodities market, however might as well try to make some money off the tickers. NGG23 expire on the 23rd of Jan meaning we do not want to have the trade extend past the 23rd of Dec. or all the open interest will be sucked out. In addition we need to have a long dated contract shorting the Jan contract to hedge risk incase it goes against the trade. And do not fail to apply the proper stops 2% of the account size* or you can do 2% on the notional value of the trade but I would not recommend due to getting stopped out prematurally. With demand for natural gas increasing in the winter months and some of the supply being cut (Nordstream 2) there is a global shortage and dont think that our leaders won't share they are masked as globalists. Until they realize that kicking that can down the road until we realize we cannot server everyone in the world there will be prices to pay for the consumer but also opportunity in the commodities markets.
"Good Luck Ace"
-Kewl Kat

high probabilityhello traders and suppliers we have a strong probability of getting long or buying physique natural gas
