DAILY UPTREND CONFRIM natural gas gold silver DXY price forecastsupport and resistance guide natural gas DXY gold silver forecast
DAILY UPTREND CONFRIM
NGAS

natural gas dxy gold and silver forecastsupport and resistance natural gas dxy gold and silver forecast

natural gas DXY gold silver forecast Natural Gas Natgas Stock in daily neutral trend
- Natural Gas Natgas needs a daily trend change to uptrend
- Next level for natural gas needs break hold 2.54

Natural GasAs noted to our members, Natural Gas rejected that 2740 area and is now heading back to retest the 2700 area.
We should see a bounce in this area back up for a longer-term bullish move.
As a scalper, this is an excellent area for a BUY opportunity.
Thoughts?

The Lengthy Wave 4 BeginsWe don't usually advise trading wave 4's as they can get overly complicated, however upon waiting for what should be the minute wave B we are advising our clients to go long as there is an off chance the minute wave C could be a minor wave 3 if the bottom is in. This is not our primary count though and we believe there is one more intermediate wave down to complete the primary wave C. Going long in our green box around $2.4 should provide us with at least 800 points of movement to $3.2 to complete the minor wave A. As always when trading natural gas you have to be prepared for extreme volatility and manipulation so be sensible with your position sizing.
Here's a closer look at the recent price action -

Natural Gas Gold Silver DXY forecast- Natural Gas Natgas Stock in daily neutral trend
- Natural Gas Natgas needs a daily trend change to uptrend
- Next level for natural gas needs break above 2.86

Natural Gas DXY Gold SIlver FORECASTNatural Gas DXY Gold SIlver FORECAST
Price action Trend analysis


Natural Gas Gold Silver DXY ForecastNatural Gas Gold Silver DXY Forecast.
Big bounce but give most of it back

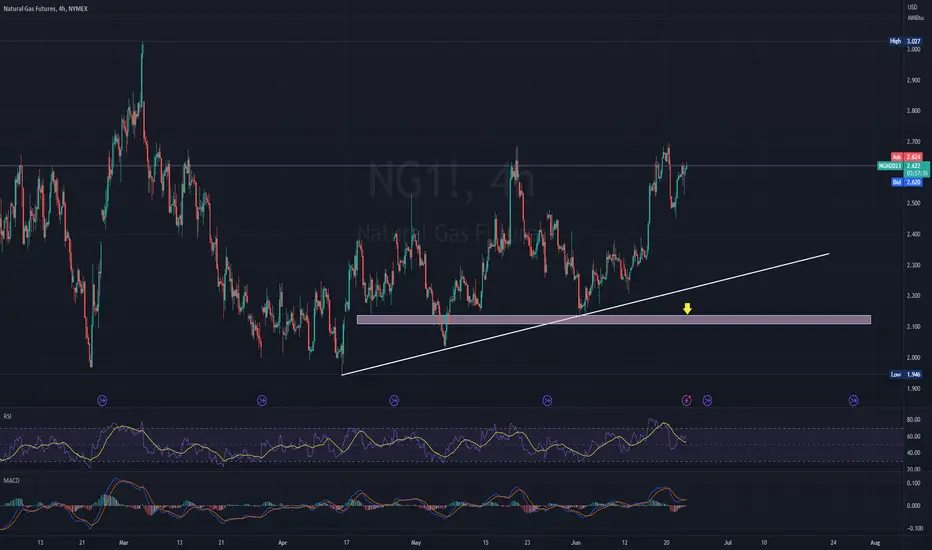
NG at multi timeframe support#NATURAL GAS... market is at his multi timeframe supporting level 2.45
its market most important and traded area form last few decades,
again market is at his level and winter season is on his way,
but it should hold this level for again bounce back..
otherwise downside we have next area that is mentioned on chart. 4
trade wisely
good luck

Natural gas bullish rally...Every time when it touches it make new high..let see again this time.naturalgas, NG, natural gas

#NatGas UpdateThis week, natural gas performed nearly perfectly. The wave count remains unchanged. Although I am still unsure about the ultimate shape of wave b, the scenario allows me to open cautious shorts. Of course, this is not advice. I look forward to the structure shaping the bottom and entering long positions into the winter.

NatGas: Take-off 🛫The price of NatGas has gained significantly again since Friday and could thereby move further away from the support at $2.48. Thus, we assume that it has already left the white wave (2) and is ready for high flights. For the white wave (3), it must rise significantly above the resistance at $2.75. After the completion of this wave, we expect a small correction and then another significant rise in the form of the white wave 5. Hence, we see a lot of movement on the upside at the moment. However, it should be noted that there is still an alternative scenario with a probability of 28%, which occurs if the price now falls contrary to our expectations. Then it would first have to fall below the support at $2.48.

Natural Gas Forecast | Trend Analysisfalling wedge pattern bull breakWeekly uptrend still intact Next level for is to break above $2.80 range

Natural Gas HELD SUPPORT What's NEXT? | Price Level Trend Analys- Natural Gas Stock Weekly uptrend still intact
- Natural Gas Natgas bear break lacking follow through
- Structure of the chart is ok as long as bulls hold above $2.53

Natural Gas Forecast | Price Trend GuideWeekly bounce off 50% fib retracement good sign for the bulls
weekly uptrend still intact, now we have a big enough bounce for bulls to try for the daily uptrend change

NatGas UpdatePreviously I mentioned that I had to pause trading in Natural Gas as the price action was uncertain from the Elliott Wave perspective without clear impulse waves up. Since then, the price has been moving within the boundaries of outlined complex scenarios of either - expanding or contracting leading diagonals. The price penetrated wave [ w] territory confirming my thinking. Once wave c of (y) of [ x] completes, I might risk opening new longs.

Natural Gas Forecast | Gold & Silver Analysis- natural gas bulls holding above 2.66
- Natgas resistance at 2.8 & 2.86 zone
- natural gas stock currently in a daily and weekly uptrend.

Natural Gas Stock Forecast | Gold Silver | Price Level Trend- Natural gas stock negated that hourly downtrend and bulls played defense
- natural gas natgas stock bounced off of strong support and now we have just have to break prior 2.8 high to continue the daily uptrend towards 3
- Gold & Silver Stock Falling Wedge Guide.

NatGas Gold Silver Forecast | QQQ Market Analysis- Natural Gas stock slight red flag today
- Natural Gas NatGas bull break above resistance today with no bull follow through and came below the resistance.
- Gold & Silver Stock Falling Wedge Guide.
- Silver is outperforming Gold and if silver weakens more Gold would likely break bearish through the falling wedge.
- QQQ needs to confirm a hourly downtrend before we can have more confidence that the daily lower high is set. So far bulls played defense and we are still in a hourly uptrend.

Natural Gas Price Level Trend Support & Resistance Guide- Natural Gas Weekly uptrend confirmed for the very first time since Aug 2022
- also confirmed a daily uptrend
- Structure of the chart is looking better for the bulls compare to the last couple months.

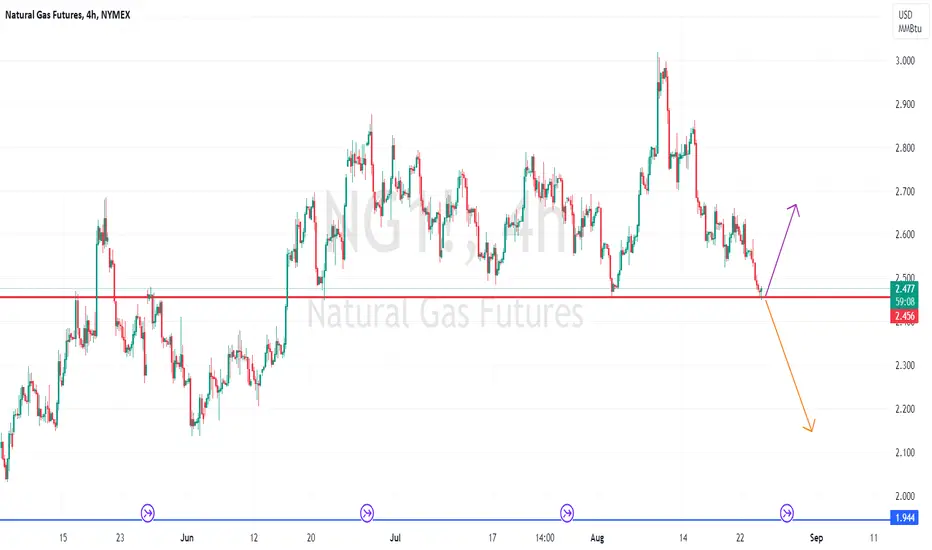
NGAS - SHORT SCENARIOLast week, fuel inventories in storage rose by 95 billion cubic feet (bcf), surpassing analyst forecasts. Gas futures initially dropped but rebounded by the end of the week. The market expects increased cooling demand in the coming weeks as summer temperatures rise. Gas futures on the Henry Hub are heading for their best month since August. However, the storage build exceeded last year's levels and the five-year average. Total gas in underground storage in the US is significantly higher than last year and the five-year average.
Risk Disclosure: Trading Foreign Exchange (Forex) and Contracts of Difference (CFD's) carries a high level of risk. By registering and signing up, any client affirms their understanding of their own personal accountability for all transactions performed within their account and recognizes the risks associated with trading on such markets and on such sites. Furthermore, one understands that the company carries zero influence over transactions, markets, and trading signals, therefore, cannot be held liable nor guarantee any profits or losses.