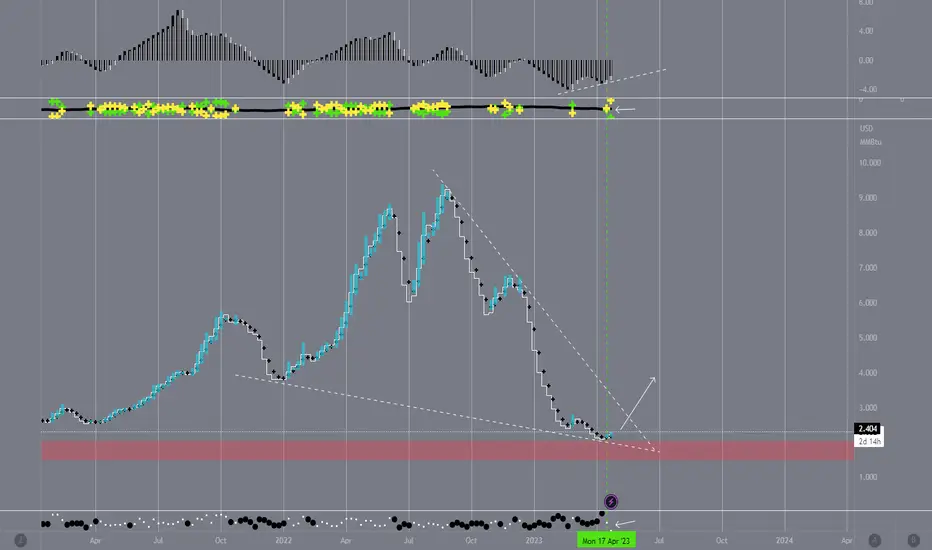
NATGAS Detail Trade Plan | Price Level S/R Guide- UNG falling wedge still intact,
- NATGAS potential daily downtrend forming we have to see if bulls can play defense and negate that bear flag.
- hourly trend will be my guide, if need bulls to form hourly uptrend before anything.
NGAS

NATGAS BOIL NG Bottoming formation.Natural gas has been basing for a few months now in what has become a very recognizable Wyckoff accumulation pattern. Complete with high volume on the start to low volume towards the end. Breakouts occur on LOW VOLUME in accumulation phases so don't look for volume to give a clue. Just like the AMEX:SPY and NASDAQ:QQQ markets did at the October bottoms. Remember everyone saying how low the volume was? Yes, same here. We also see a very recognizable MEGAPHONE BOTTOM specifically on BOIL. This is regarded as a bullish signal showing that the existing downtrend may reverse to start a new UPTREND. Further, we see evidence in arcs of a possible bottom. EW counts also suggest the bottom is in for now.

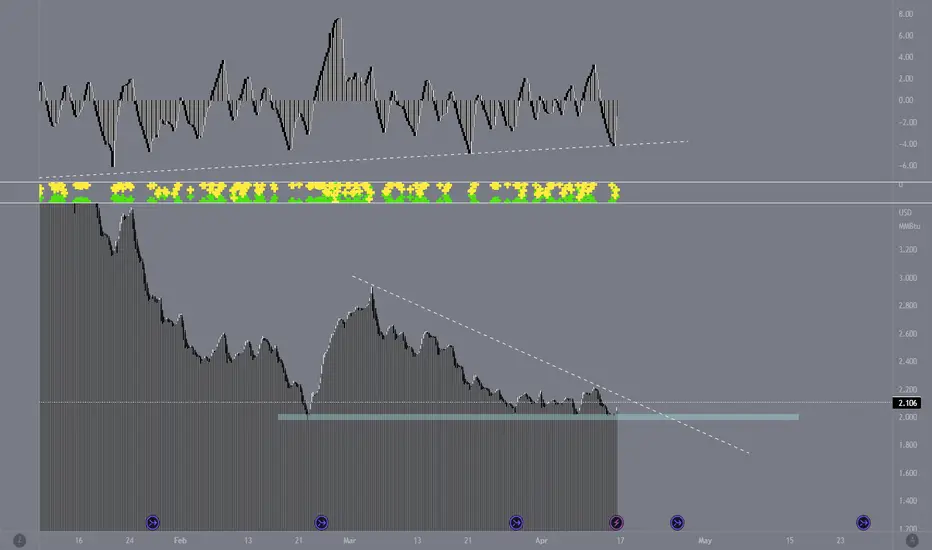
NatGas UNG Detail Trade Plan With Support & Resistance Levels- UNG falling wedge still intact
- potential lacking follow through on the bears on Friday
- Natural Gas needs to confirm 1h uptrend as their very first step

UNG Perfect Falling Wedge Rejection | Support & Resistance Guide- UNG rejected from falling wedge upper resistance now dropping a little more then what bulls want to see
- need to confirm a hourly uptrend as the first step for bulls
- want to see it hold it hold 6.65 otherwise going to 6.3

NATURALGAS 22May2023broadly speaking, it is sideways with a fairly large range. but we can still take a chance on a good moment. if you look at the current elliot notation, it is likely that the price will go to the previous HH, you can take a long opportunity with the SL area below the invalid area

Natural Gas Psychology | In-depth Support & Resistance Guide- Natural Gas First Daily uptrend in a while, still continuing
- potential Weekly bull flag if we don't retrace over 0.382
- Next key resistance at 2.65 zone

#NaturalGas Can Rise Up Very Quickly #NATGASTraders, Natural gas has created several bullish breakouts over the past weeks but failed to push higher. Now as we are reaching the end of the wedge pattern, a breakout is imminent. This can create a W pattern which in turn can push the prices higher.
Please support this analysis by liking and sharing. 👍🙂
Rules:
1. Never trade too much
2. Never trade without a confirmation
3. Never rely on signals, do your own analysis and research too
✅ If you found this idea useful, hit the like button, subscribe and share it in other trading forums.
✅ Follow me for future ideas, trade setups, and updates on this analysis
✅ Don't hesitate to share your ideas, comments, opinions, and questions.
Take care and trade well
-Vik
____________________________________________________
📌 DISCLAIMER
The content of this analysis is subject to change at any time without notice and is provided for the sole purpose of education only.
Not financial advice or signal. Please make your own independent investment decisions.
____________________________________________________

Natural Gas Clear Support & Resistance Guide | Falling Wedge- AMEX:UNG AMEX:BOIL PEPPERSTONE:NATGAS Natural Gas clear falling Wedge
- Daily uptrend confirmed without much follow through at the moment
- bulls would like us to hold prior pivot lows and bonce off next week

NATGAS, Accumulation mode is definitely ON before x4 by DecemberNATGAS weekly data is conveying massive accumulation at the current price range of 2.0 to 2.2.
Target by Winter/December will be a 6.0-8.0 price range.
TAYOR.

The Hard Boiled BOIL Bulls could catch a breakWho says you can't chart 3X leverage?
Got a nice down channel here and about to hit the bottom of the channel.
4.20 at the end of next week would be a nice price.
That would be over a 96% drop from the top. Interestingly, the previous peaks in Nov 2018 and Feb 2014 dropped just over 96% before touching the channel bottom.
Could overshoot below since it overshot out at the top.
Also could bounce early like that small bounce in Dec 2015, before tanking lower and tapping the channel.
Lots of breakout potential in the RSI.
Feeling like there's going to be some crazy times ahead... if things aren't crazy enough.

Natural Gas Support and Resistance Guide | Price Outlook- AMEX:UNG AMEX:BOIL VANTAGE:NG Still trading within my falling wedge pattern is getting tight so likely breaking soon
- Bounced off of quadrupole support Friday
- couple of resistance level right above us may test the upper falling wedge resistance next week

Natural GAS : LONGNatural gas bounced from a low of $1.95/MMBTU, where almost all producers lose money.
Since natural gas and crude oil are near or below breakeven levels, producers are reducing their drilling rate - likely lowering production levels given the lack of capacity.
The negative shift in weather, falling rig count, and potential export boost from Freeport may push natural gas back into a shortage over the coming months.
While natural gas spot prices appear likely bottoming, UNG's immense "contango" pressure remains a key investment rig factor.
Source : Seeking Alpha

Natural Gas Weekly Price Outlook | Support & Resistance Guide |- Natural Gas falling wedge is my support and resistance guide
- Currently Daily & 4h Neutral trend
- 2 key support below and 2 key resistances above.

NATGAS, keeps the flame burning. Upside continues.NATGAS weekly data is suggesting firm price foundation at current levels and an upside continuation is inevitable.
SPOTTED at 2.4 (continuation from 2.0 levels)
_______________
Related news:
Nat-Gas Prices Rebound on Outlook for Cold U.S. Temps
www.tradingview.com
Natural Gas Detail Trading Plan |Long term| Support & Resistance- AMEX:NG AMEX:UNG AMEX:BOIL : if i were to add today, I laid out a detailed game plan in the video of how to trade it with SL and target.
- 4 hour currently in neutral trend
- potentially shaping up daily higher low and trend change to uptrend need to break above prior high
- still trading within the equilibrium range likely breaking in early May

NG, 1st spark up... flame will ascend to new highs soon..NG correction is slowly concluding -- with bears showing some weakness on weekly data, after touching the order block support at 1.9 level.
A reversal is on queue now.
Expect some signficant moves on the upside soon -- a revisit to 7.0 before year ends is possible.
SEEDED L at 2.09
TAYOR.

Natural Gas Future Outlook Weekly /Daily S&R Technical Analysis - AMEX:NG Finally got a 4 hour uptrend need more follow through tomorrow to confirm
- likely heading to $2.5 if 4 hour uptrend confirm follow through tomorrow
- tradeable ticker AMEX:UNG and AMEX:BOIL still use the NG chart if you are trading natural gas.

Natural Gas May Have Bottom Out @ 2.054 With Double BottomAfter experiencing a price rejection at the 2.054 level and a double bottom formation, the natural gas market appears to be bottoming out, signalling an end to its 2-year low.
The bullish sentiment of natural gas is expected to gain momentum in coming weeks!
#NaturalGas
#NGAS
N.B!
- XAUUSD price might not follow drawn lines . Actual price movement may likely differ from the forecast.
- Let emotions and sentiments work for you
- ALWAYS Use Proper Risk Management In Your Trades

Natural Gas Weekly Bear Flag potential but still holding Support- AMEX:NG AMEX:UNG AMEX:BOIL needs that 4 hours trend change otherwise even the big moves will essentially just fade
- still a potential weekly bear flag
- but still holding bottom wedge support and also double bottom on daily.

NG, on active accumulation phase..NG, is undergoing significant accumulation at the current levels. It revisited strong order block / support at 1.9 level and it touched this multiple times. It retested it and bounce back-- only to return to it multiple times. Let's see if it can finally muster strength to reverse from this level.
Spotted at 2.10
TAYOR.
natgas - target 1,8Similar pattern.
Short view for the end of this week. I am waiting for 1,8 to buy natgas again.

Natural Gas Long Term Outlook | Importance of 4H Trend change | - AMEX:NG AMEX:UNG AMEX:BOIL cant stress enough we need to change trends, even if it is a very big move it will just fade if no trends are changed
- need to change the 4h and daily trend to the bulls
- likely tightening up in a equilibrium into May, still holding the teal support line.

Natural Gas Full Bear Control | Potential Equilibrium - NG UNG full bear control, need to see a hourly trend change to the bull for anything to happen.
- potential Equilibrium shape up on daily time frame if bulls can hold above $2
- daily 12 EMA resistance
