NGAS: Soon there will be a possibility for a long positionBased on Daily and Weekly technical analysis as well as fundamental I think there is a possible trade to the long side for NGAS in the upcoming weeks. I will post a more in-depth analysis when I see a window to enter the trade. For now I am keeping some cash to be ready.
Ngaslong

Can Natural Gas challenge 4.050 or 4.450Since the first of November, NGAS has had a nice run up but now appears to be pulling back for a correction. As part of my learning Renko Charts, I've created three views of NGAS:
Daily TF: source/close | style/traditional | blksz/.050
2Hr TF: source/close | style/traditional | blksz/.025
5Min TF: source/close | style/traditional | blksz/.010
With the price above the 20, 50, and 200 EMA and with the +DI of the DMI dominant, the overall trend of this market is up. However, looking at the 2Hr and 5Min charts, it looks like there is a correction in play. Once this correction concludes, NGAS can begin it's move up to challenge the 4.050 or even the 4.450 level.
On the 2Hr chart, the charcoal box is what the 5Min chart expands out to. Some key things to note and/or watch:
5Min price has moved off the 200EMA
5Min TSI has moved below 0 along with the -DI of the DMI dominant
2Hr chart is now correcting and attention should be paid to the TSI. If it breaks below 0, then wait for it to move back above 0 along with the PSAR signaling a buy
For now, on side until price and indicators signal that up move is beginning to continue

Watch out NG breakoutNG gonna hit 3.2 due to the cold weather in east coast US. Prior, it tested the lower point of 3.08 and bounced back.


Natural Gas short: FakeyThe uptrend of NGAS in the past week was a completely irrational move fueled by good news for oil. Other than that, inventories were slighly below forecasts and weather neutral. Furthemore, this rally is starting to experience exchaustion with huge spreads between bid and ask which leads to gaps--mostly to the downside. Thus, I believe that panic selling will follow; and as we know panic selling of NGAS is an amazing opportunity to short. I entered short at $3.5 and will hold till STOCH RSI bottoms, where I will try to long as I think NGAS has potential upside.

Natural Gas SHORT: December is ComingFriday I started selling my position in NGAS. Whilst I do expect further movement up, I think that there may be a possibility for some profit in the short side. That's because the upper BB did not seem to widen when the price reached it. This is a very common sign of NGAS reversing. Furthermore, the STOCH RSI look like not much upside is available. The MACD is still bearish but soon to reverse. I WILL NOT BE TAKING A SHORT position right now, but will wait for signs of reversal (retrace). There have been times when NGAS exploded after reaching a resistance. Thus, I will adding to short from 3.2-3.18 and only if indicators signal a selloff.

UPDATE: NGAS ShortWARNING: Tomorrow is a massively important day for short holders. Firstly it is important to note that there is very big spread between December ($3.066) and current contracts. Furthermore, tomorrow invontory data is released. If you see December contracts gapping down tomorrow that is a very bearish sign and could indicate that there is a short opportunity regarding the data. If we don't see a spread close, then we should all be extremely careful and exit immediately if data is positive as it will mean that NGAS will ride back to first resistance and trend higher for the days to come. At which point a short could be a possible trade to ride it back down.

NGAS BUY TRADENGAS PRICE SHOULD TEST THE SUPPORT TREND LINE AS SEEN ON THE CHART AT 2.770.
PLACE A BUY LIMIT AT 2.770.
STOP LOSS 2.645

Natural Gas Long OpportunityBull flag forming on NG1! daily chart.
Price consolidated in that pattern between 2 weekly zones and when it finally broke, bull momentum slowed and profit taking occurred.
I expect a retest on the upper channel before a charge to the 3.0 level.
This is one of those text book flag-retest setup
Opportunities to swing trade this commodity have been far and apart but a bull move seems to be what the market is signalling.
How I shall trade this:
1. I will be placing a buy Limit at the 2.75 area with an initial target at 2.90
2. A slightly smaller aggressive entry above the high of the Monday close with at target at 3.00
Happy Trading!


NATURAL GASSlowly but surely climbing. Building base and support line. Buy for Long term hold but resistance may be the BLACK SOLID LINE. The below Solid green line will act as support but if fails then Bear Market.


NGASBUYAnother long on this commodity, we took first TP on our last long, then broke even. We have good reason to buy this commodity again this week.
TRADERS TOOL: www.forexstocksignals.com
GET trade setup direct to your mobile device: Whatsapp / Email: www.forexstocksignals.com
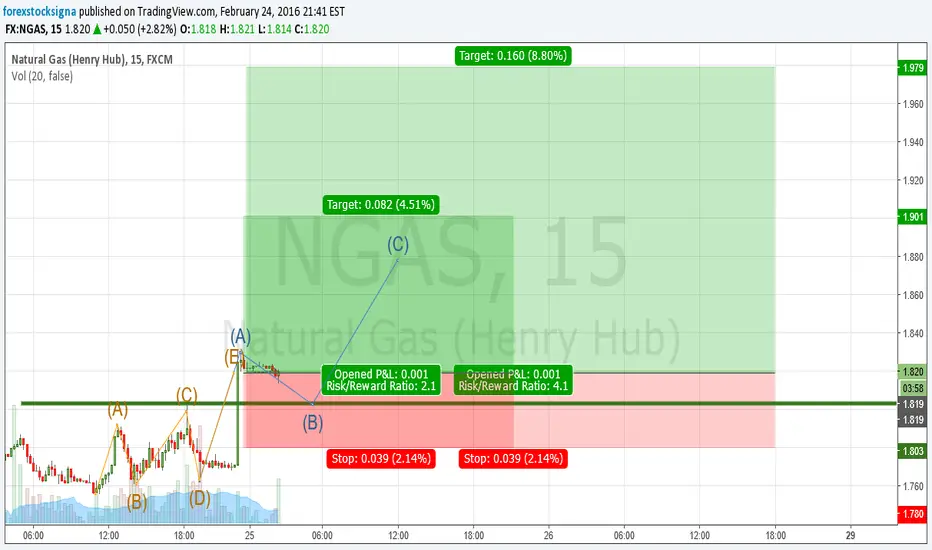
NGAS; catching wave 3it seems that wave 2 has been finished.
trying to catch wave 3.
note the divergence
very good risk to reward ratio.
2 units entries:
first target is 50% of previous wave and second can be normal targets of wave 3 but at least end of wave 1.
test of broken trendline.


