Jamie Gun2Head - Selling NikkeiTrade Idea: Selling Nikkei
Reasoning: Targeting 78.6% Fibonacci, price breaking below support
Entry Level: 26708
Take Profit Level: 25893
Stop Loss: 26871
Risk Reward Ratio 5:1
Disclaimer – Signal Centre. Please be reminded – you alone are responsible for your trading – both gains and losses. There is a very high degree of risk involved in trading. The technical analysis , like all indicators, strategies, columns, articles and other features accessible on/though this site is for informational purposes only and should not be construed as investment advice by you. Your use of the technical analysis , as would also your use of all mentioned indicators, strategies, columns, articles and all other features, is entirely at your own risk and it is your sole responsibility to evaluate the accuracy, completeness and usefulness (including suitability) of the information. You should assess the risk of any trade with your financial adviser and make your own independent decision(s) regarding any tradable products which may be the subject matter of the technical analysis or any of the said indicators, strategies, columns, articles and all other features.
Japan 225

Nikkei 225 Potential Bullish ContinuationPreference:
On the H4, with price bouncing off the ichimoku cloud and moving in an ascending trend channel, we have a bullish bias that price will continue to rise from the pivot at 26880 in line with the pullback support and 50% fibonacci retracement to the 1st resistance at 28410 in line with the multiple swing high and 100% fibonacci projection .
Alternative Scenario:
Alternatively, price may reverse off the pivot and drop to the 1st support at 26000 in line with the pullback support .
Any opinions, news, research, analyses, prices, other information, or links to third-party sites contained on this website are provided on an "as-is" basis, as general market commentary, and do not constitute investment advice. The market commentary has not been prepared in accordance with legal requirements designed to promote the independence of investment research, and it is therefore not subject to any prohibition on dealing ahead of dissemination. Although this commentary is not produced by an independent source, FXCM takes all sufficient steps to eliminate or prevent any conflicts of interest arising out of the production and dissemination of this communication. The employees of FXCM commit to acting in the clients' best interests and represent their views without misleading, deceiving, or otherwise impairing the clients' ability to make informed investment decisions. For more information about the FXCM's internal organizational and administrative arrangements for the prevention of conflicts, please refer to the Firms' Managing Conflicts Policy. Please ensure that you read and understand our Full Disclaimer and Liability provision concerning the foregoing Information, which can be accessed on the website.

Elliott Wave View: Nikkei Zigzag Rally Approaching TargetShort term Elliott Wave view in Nikkei suggests the decline from 3/29/2022 peak is unfolding as a zigzag Elliott Wave structure. A Zigzag is a corrective structure labelled as ABC with 5-3-5 subdivision. Down from 3/29/2022 peak, wave A ended at 25555 and rally in wave B ended at 28401. Wave C lower is in progress as a 5 waves impulse. Down from wave B, wave (i) ended at 26195 and rally in wave (ii) ended at 26960. Index then resumes lower in wave (iii) towards 25615, wave (iv) ended at 26235 and final wave (v) ended at 25525. This completed wave ((i)) of C. Wave ((ii)) of C is now in progress to correct cycle from 6/9/2022 high before the decline resumes.
Internal subdivision of wave ((ii)) is unfolding as a zigzag structure in lesser degree. Up from wave ((i)), wave (a) ended at 26555 and dips in wave (b) ended at 26005. Wave (c) higher is in progress to complete wave ((ii)) before the decline resumes. Potential target for wave ((ii)) is 100% – 161.8% fibonacci extension of wave (a) which comes at 27040 – 27675 area. Index should then resume lower or pullback in 3 waves at least. Near term, as far as pivot at 28401 high remains intact, expect rally to fail in 3, 7, or 11 swing for further downside.

Nikkei225 +415points, What Next?In this update we review the recent price action in the Nikkei225 futures contract and update the trade strategy and price objectives to target

Why markets will fall this week (JPN225 analysis) Last week we saw a rally in all the stocks.
Looking at the indexes, we are seeing all of them being overbought on H4, h1, m30 and m15.
We are seeing the weakness in H1 and M30 and M15 on Nikkei.
We will sell with 500 pip stop loss and target close to 2000.

✅NIKKEI225 WILL KEEP FALLING|SHORT🔥
✅NIKKEI225 is trading in a downtrend
And the price-action is rather bearish
The latest moves being a good proof of that
So I think that we will see the price go further down
Towards the support level below
SHORT🔥
✅Like and subscribe to never miss a new idea!✅

Current situation vs 1980s, 2000sIntroduction
This is pretty clear that we are witnessing bubbles on different markets every around 20 years period of time. These bubbles obviously are driven by the unreasonable greed of the investors. Market is always unreasonable but we can see some similarities between all bubbles.
Japan 80's real estate and stock market
Since Japan had monetary crisis at the beginning of 80's the government decided to impose more dovish policy with very low interest rates and stimulous which ended up in big stock market and real estate bubble. Not to mention that at the peak of in 1989, the value of the Imperial Palace grounds in Tokyo was greater than that of real estate in the entire state of California.
The end was when Bank of Japan raised interest rates from 2.5% to 6%. Investors found it as sign of worse times and bubble was ended. Nikkei 225 never got again the same value as in the late 80's.
NASDAQ 2000's Dotcom
Capital moved from Japan to NASDAQ where was found new point of investment. Newly developed internet created the base for greed for investors. Index crashed by 78% after raising interest rates from 4.75% to 6.5%.
Bitcoin 2020's
The most recent one. I know there are many people who wish Bitcoin go to 500k or more. Even many "predicted" that during current cycle peak will be at around 250-300k, however ATH was around 67k. In my opinion even 67k was very overpriced.
At this moment Bitcoin is not really usable, it was claimed to be "new gold" but gold already proved its usability for thousands years and Bitcoin is fairly new thing, maybe for the next generations it will be more usable but we need years until new business will be created on cryptocurrency and will be developed ways to use it, so far people don't use it widely for everyday payments, if it's ever intended to use for paymens. Similarly to the Dotcom bubble, internet at that time existed but wasn't very usable, later companies like Google and Amazon developed ways for commercial and everyday use. The state legislation must also follow these innovations, including crypto and NFT, otherwise companies won't ever want to enter this business if courts don't recognize violations related to this kind of business.
In my opinion Bitcoin may never reach again 67k or it will take many years. Maybe after few years we will call 2020's as "Bitcoin bubble" powered by very low interest rates and stimulous from pandemic and ended similar like in Japan by raising rates and making fear among investors.

Nikkei Pivotal Trend TestIn this update we review the recent price action in the Japanese Nikkei futures contract and identify the high probability trading opportunity and price objectives to target

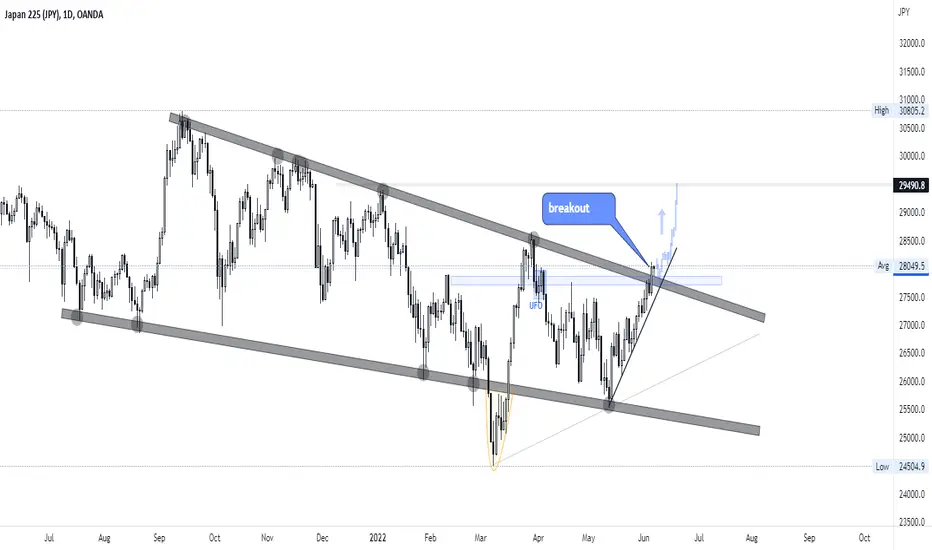
NIKKEI 7th JUNE 2022Asia Pacific stock markets were mostly bullish on Monday (June 6th) morning as China eased COVID-19 restrictions, giving hope for the global economic recovery. Also, the upbeat US jobs report opens the door for the US Federal Reserve to remain decisive on inflation.
Nikkei has breakout the resistance area. After several months inside the falling wedge area. So technically the price will be higher in the future.
Jamie Gun2head - Selling JPXJPYTrade Idea: Selling JPXJPY
Reasoning: Breaking trendlines, looking for an extended selloff
Entry Level: 27753
Take Profit Level: 27029
Stop Loss: 27923
Risk/Reward: 4.26:1
Disclaimer – Signal Centre. Please be reminded – you alone are responsible for your trading – both gains and losses. There is a very high degree of risk involved in trading. The technical analysis , like all indicators, strategies, columns, articles and other features accessible on/though this site is for informational purposes only and should not be construed as investment advice by you. Your use of the technical analysis , as would also your use of all mentioned indicators, strategies, columns, articles and all other features, is entirely at your own risk and it is your sole responsibility to evaluate the accuracy, completeness and usefulness (including suitability) of the information. You should assess the risk of any trade with your financial adviser and make your own independent decision(s) regarding any tradable products which may be the subject matter of the technical analysis or any of the said indicators, strategies, columns, articles and all other features.

Nikkei 225 Potential Bullish ContinuationOn the H4, with price moving above the ichimoku cloud and within the ascending trend channel, we have a bullish bias that price will continue to rise from our entry at 27760 in line with the overlap swing high to our take profit at 28410 in line with the 127.20% fibonacci expansion at the swing high. Alternatively, price may reverse and break the support level at our entry and drop to our stop loss at 27130 in line with the 61.8% fibonacci projection .
Any opinions, news, research, analyses, prices, other information, or links to third-party sites contained on this website are provided on an "as-is" basis, as general market commentary, and do not constitute investment advice. The market commentary has not been prepared in accordance with legal requirements designed to promote the independence of investment research, and it is therefore not subject to any prohibition on dealing ahead of dissemination. Although this commentary is not produced by an independent source, FXCM takes all sufficient steps to eliminate or prevent any conflicts of interest arising out of the production and dissemination of this communication. The employees of FXCM commit to acting in the clients' best interests and represent their views without misleading, deceiving, or otherwise impairing the clients' ability to make informed investment decisions. For more information about the FXCM's internal organizational and administrative arrangements for the prevention of conflicts, please refer to the Firms' Managing Conflicts Policy. Please ensure that you read and understand our Full Disclaimer and Liability provision concerning the foregoing Information, which can be accessed on the website.

NIKKEI 1st JUNE 2022The benchmark Nikkei 225 index on the Tokyo Stock Exchange rose 587 points, or 2.19% to 27,369 points, marking its highest closing level since April 21.
Investors were temporarily relieved by the US data, as concerns that the Fed would push for aggressive monetary policy receded.
Bullish trend is limited to 27,777 rebound is possible. If breakout, the price will be higher.

NIKKEI A great opportunity to invest. 7 years recurring pattern.The Nikkei index (NI225) has been on a strong correction phase since its September Highs. Despite the early March rebound just above the 1W MA200 (orange trend-line), it was rejected on the 1W MA50 (blue trend-line) pulling the index back towards the lows.
Notice on this chart, however, that the March rebound was performed on a Higher Lows trend-line that is holding for almost 10 years, since October 2012. It was on that trend-line that Nikkei made the bottoms of June 2016, December 2018 and August 2019 and rebounded. Interestingly enough on all cases that was on or marginally around the 1W MA200. The only exception to that was the global asset crash of March 2020 due to the COVID pandemic, which of course is classified as a Black Swan event, and was the only time that the Higher Lows trend-line broke.
As a result, we have a 7 year sample of corrections that end with a bottom on the 1W MA200 and/or the Higher Lows trend-line. At the same time, when the 1W RSI makes Higher lows following an (near) test of the 30.00 oversold level, it indicates that the bottom of the correction is in and the index starts a new Bull Phase.
This indicates that the current level is a confirmed long-term buy opportunity on Nikkei.
--------------------------------------------------------------------------------------------------------
Please like, subscribe and share your ideas and charts with the community!
--------------------------------------------------------------------------------------------------------

I am selling the NIKKEI (JP225) nowThis is my first trade on NIKKEI and I am scared :)
Well I just follow my rules, so I shouldn't worry.
1) Daily is down
2) H4 is down
3) Nice harmonic pattern setting up
All other indices are showing similar symptoms.
Hope it will be a good one. Stop loss is steep at 200 points but the reward is better.

JP225 (Nikkei 225) Index Intraday Technical Analysis:The downtrend of JP225 continued yesterday. Today JP225 showed recovery in Asian session. But this is not going to sustain in intraday. My target is entry at intraday resistance of 26300 with target of 26100.
If you like this or if you think the opposite of this or if there is any other opinion, mention it in the comments. I am open to all kind of suggestions and critics

JP225 (Nikkei 225) Index Intraday Technical Analysis:After a week full of blood in the streets. The Asian market took support from 26331. My target for intraday is support of 26300 and the goal for today is 26500.
If you like this or if you think the opposite of this or if there is any other opinion, mention it in the comments. I am open to all kind of suggestions and critics

JP225 (Nikkei 225) Index Intraday Technical Analysis:Today was a public holiday in Japan. The JP225 index which is aligned with international markets stayed sideways during the active Japanese session. Market once again took rejection from 27444. Effects of less hawkish US fed policy were seen in the Japanese market as well. My idea is that the JP225 will take rejection from 27444. My targets for intraday are entry at resistance of 27444. My goal is support of 27250 and retracement level of 27100.
If you like this or if you think the opposite of this or if there is any other opinion, mention it in the comments. I am open to all kind of suggestions and critics

Major Indexes are resilient but may be due to selloffThe world is focused on the US indexes which have recently broken down out of the uptrend. The question is now whether there is more downside to come which could turn into a major selloff after such a big Fed Fueled pandemic rally. I take a look at the price action and major levels of the Key Indexes.
In the US - DOW, SP500 and Nasdaq
Europe - DAX, FTSE and Eurostoxx
ASIA - ASX200, Hang Seng and Nikkei
Remember to take a look at my profile and follow for more content and analysis.

Nikkei ShortHere are the possible alternative subsequent movements of the Nikkei index.
It is assumed that the index formed a five-wave structure from the beginning to the middle of April, followed by a corrective three-wave structure. And currently we have a zigzag downward movement. In this regard, it can be assumed that most likely we will see either a ending diagonal triangle or a horizontal triangle with a final downward movement following.

Nikkei Playing The WXY PatternIn this update we review the recent price action in the Nikkei futures contract and identify the next high probability trading opportunity and price objectives to target

Nikkei225 Long Strategy Working WellIn this update we review the recent price action in the Nikkei225 futures contract and identify the next high probability trading opportunities and price objectives to target.

Nikkei (Japan 225) Upside Target 28600 - 30000Overview and identified market structure, setups will based off PA confirmation around our zone. Stops will then be strategically positioned.
