VDJP Weekly - Bull flag breakPatience has started to pay off. I have been averaging into this ETF for a while - especially when we saw the re-test of the inverse h&s neckline. The bull flag has finally broken higher and will target new all time highs - will hopefully see 31/32 region. Currently largest % holding in my portfolio and happy with current allocation.
Japan 225

Death cross is here.After a major bull run, we can see a death cross forming.
What is a death cross?
The death cross is a chart pattern that indicates the transition from a bull market to a bear market. This technical indicator occurs when a security’s short-term moving average (e.g., 50-day) crosses from above to below a long-term moving average (e.g., 200-day).
The indicator gets its name from the alleged strength of the pattern as a bearish indication. In short, traders who believe in the pattern’s reliability say that a security is “dead” once this bearish moving average crossover occurs.
Three Phases of Forming the Death Cross:
There are three primary phases in the formation of the cross of death pattern.
The first phase involves the existing uptrend of a security, when it begins to reach its peak as buying momentum tapers off. Then the price begins to fall as sellers gain the upper hand in the market.
The second phase is the decline in the security’s price to a point where the actual death cross occurs, with the 50-day moving average falling below the 200-day moving average. This downside shift of the 50-day average signals a new, bearish long-term trend in the market.
The final phase occurs with the continuation of the downward movement in the market. The new downtrend needs to be sustained in order for a genuine death cross to be deemed to have occurred. If the period of downward momentum is merely short-lived, and the stock turns back to the upside, then the cross of death is considered a false signal.

money rotations (theory)let's talk about money rotation for a minute.
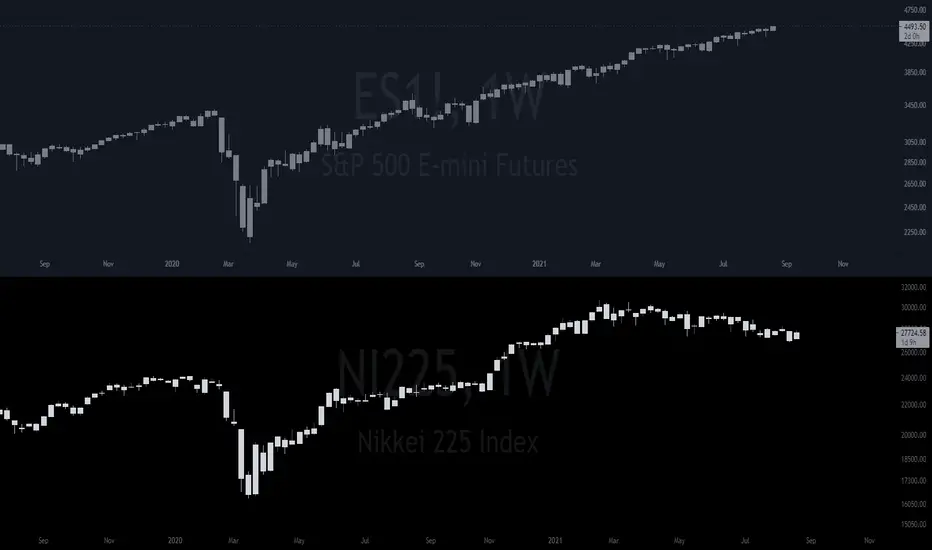
someone brought up this nikkei chart to me last night, and told me it is close to seeing a strong reversal, after taking a deeper look into it, i will have to strongly agree with their statement.
---
notice how the es chart has been going up for the last 189 days, while nikkei has been slumping for this same duration of time.
the indicator i use on all my trades is flashing a weekly buy signal right now for the first time since the covid crash on nikkei - see below the reaction it saw after this buy signal was triggered the last time around.
Hang Seng (Honk Kong Index) has the same weekly buy indicator, and it's also sitting at the 0.618 wave (2) target.
the theory is, since market maker doesn't want the market to just crash randomly - instead what they're going to do is rotate money into the next profitable area (slowly) - which in turn will create prolonged sideways chop \ a weak downward trend similar to what nikkei has been seeing over the last 6 months or so. not sure how long this is going to last, but i favor this scenario over a market crash any day - for the sake of the people, and for the sake of selling iron condors on spx 3 times a week 💸
curious to see how this will play out, but that's the primary scenario as of right now. if we happen to see a sharp correction as mentioned in my previous post, then i suppose we can invalidate the theory stated here.
also, a flat correction would greatly benefit the longer term bullish trend, as we would be able to build a very strong base up here, before the last push to 5000~6000 in the years ahead.
ps. if you wanted to try and catch some gains from the nikkei play, you could try picking up some december\january calls on $EWJ - they've some very low iv right now, and it could work out very nicely as a hedge against our flat corrective phase.

INDEX - Nikkei 225 - Model ForecastModel Forecast for NI225:
- Line of Least Resistance EW Corrective Wave found.
- Wolfe Wave at Top Distribution Level.
- Weakening rally rejected at top of channel.
- This time the support will break.
- US Markets to follow.
Soon the V's will stop. Easy come easy go.
GLHF
- DPT


Nikkei 225 looks tempting
11% already looks tempting
good idea if you wait for the bigger move down
also good to go directly if you are more like an investor :)

Stocks - What Next?Idea for indices:
- As expected, Robinhood IPO was the trigger for global sell-off (other factors involved obviously, but I have been posting about everything macro related in other posts).
- China continuing to lead down.
- Look how the deflationary wave hits HSI > Nikkei > EU > US. Dome tops forming everywhere.
- ECB actually has greater QE than US, so EU index performance is a critical tell for deflationary forces vs. QE.
- Watch China Tech ETFs to lead US indices down. Managers will need to also liquidate US positions as their portfolio % exposure becomes overweight.
I've been enjoying watching Nikkei lately - it just broke a critical support and 200 DMA (6m low), officially a bear market if it consolidates losses. However, it is still holding 50 WMA and 200 DMA in real performance... waiting for US markets for confirmation.
Bearish bias here, turning point is due. Aug 2 debt limit will be in focus. Early August is my trigger for reversal confirmation. If it holds, we can back off and try again later, but rugpull is definitely due.
Already short US indices (long vol).
Nikkei real performance (relative to currency):
Here is what I think will happen to Nikkei next:
GLHF
- DPT

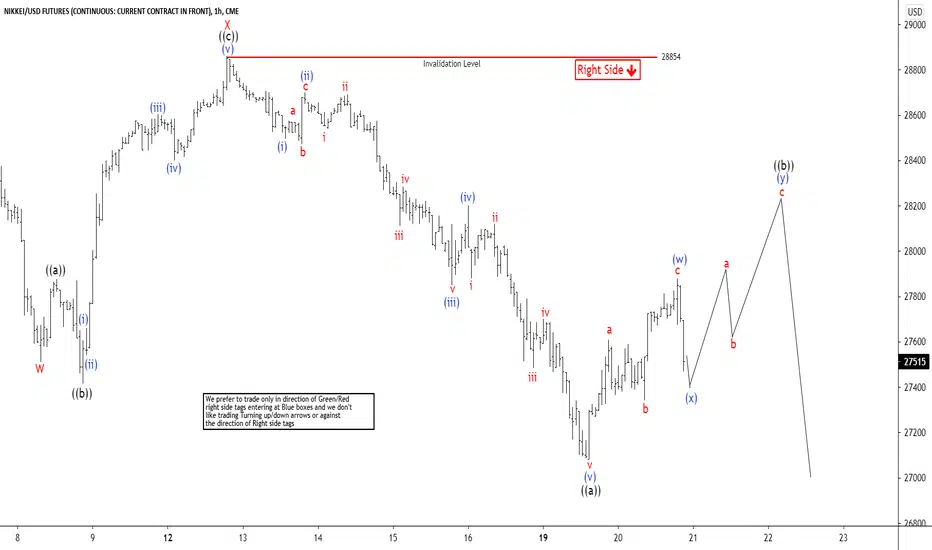
Elliott Wave View: Nikkei (NKD) Rally Likely to FailElliott Wave structure of Nikkei (NKD) shows incomplete sequence from February 16, 2021 high as well as from June 15, 2021 high suggesting further downside is likely. From June 15 peak, the Index shows a 5 swing sequence which is an incomplete sequence that needs further downside. The decline from June 15 is unfolding as a double three Elliott Wave structure. Down from June 15, wave W ended at 27510 and rally in wave X ended at 28860. Internal subdivision of wave X unfolded as an Expanded Flat where wave ((a)) ended at 27875, wave ((b)) ended at 27415, and wave ((c)) ended at 28860.
The Index has resumed lower in wave Y as a zigzag Elliott Wave structure. Down from wave X, wave (i) ended at 28495, and rally in wave (ii) ended at 28700. The Index resumes lower in wave (iii) towards 27850 and bounce in wave (iv) ended at 28200. Final leg lower wave (v) ended at 27080 which should complete wave ((a)) in higher degree. Bounce in wave ((b)) is in progress to correct cycle from July 13 peak before the decline resumes. Near term, as far as July 13 pivot high at 28854 stays intact in the first degree, expect rally to fail in 3, 7, or 11 swing for more downside.
Selling ur positions Better to sell ur positions now.. it will reach the 3rd resistance line but slowly

Stocks - What do HSI and Nikkei Know?Idea for HSI & NI225:
- Delta variant proving to be a third wave globally.
- Supply chain issues, productivity decline, credit impulse having spillover on Asian indices now.
- SPX will get its wake-up call too.
I know this frequency well.
Speculate Jul-Aug will be very painful for global indices.
GLHF
- DPT

FX Morning Meeting & Top Trade Ideas for July 08🌐 MORNING MEETING - MARKET PREVIEW - JULY 08
🔴 USD INDEX
The US dollar retreated from highs after the FOMC minutes release with the UST 2y-10y curve continuing its bull flattening. The falling yields suggest that the US dollar could see some selling pressure, at least against low-yielding currencies. However, with risk aversion present in the markets ahead of the weekend, downsides in the USD may be limited. USD bulls could continue to flex their muscles against risk currencies. Today's US Unemployment Claims are expected slightly lower than in the previous month (345k vs 364k expected).
🔴 GLOBAL STOCK MARKETS
Morning traders, global markets entered a broad risk-off mode after the FOMC minutes showed that the Fed is not as hawkish as previously expected. Asian markets closed lower (Hang Seng is down 2.90%), and European markets followed their Asian peers with losses that exceed 1%. US futures are also down ahead of the NY open.
🔴 CURRENCY STRENGTH
Surprise surprise, the risk-off scissors are here! JPY and CHF are the strongest, while AUD, NZD and CAD are racing who will print the biggest loss.
🔴 ECONOMIC CALENDAR
Early in the morning London time, RBA's Lowe held a webinar speech about monetary policy, but didn't deliver anything the markets don't already know.
The remaining calendar is light with key reports being the US unemployment claims and crude oil inventories.
Inventories have fallen more than anticipated for six previous periods, which is helpful to have on mind.
🔴 TOP TRADE IDEAS FOR JULY 08
- Long USD against high-yielders - While falling UST yields could pose a bearish risk for USD, risk-off may still support the currency.
- Long low-yielders - If technicals allow

Stock market fundamental and technical analysisGoing through all the major indices, going through whether stocks are overvalued and where they might be heading next and closing with two major meme stocks like AMC and GME

Nikkei Options Strategy for coming monthsThis is an idea for trading INDEX:NKY options.
In recent months, Nikkei index did experienced some volatile moments, however, they were all short-term momentum that they were unable to be met with trends that lasted for months or even weeks.
The author of this article believes that this trend to continue.
So, I suggest opening an Iron Condor spread which captures the prices between the lines drawn.

Bearish on NikkeiNI 225 looking to consolidated. Like IXI, we are more or less at the beginning of the downtrend. Some goals are provided in purple as well. RSI show dropping momentum.
None of the above is financial advice, please do your own research - your trades are your trades.

VDJP Weekly - Potential large bull flag developing Bullish developments continue following inverse H&S break. Needs to stay above 24.50

Elliott Wave Analysis: NIKKEI Remains BullishHello traders and investors!
Today we will talk about Japanese Index NIKKEI 225 in which we see very clear bullish pattern.
As you can see, NIKKEI made an A-B-C corrective decline from the highs and the main reason why we think it's a correction within uptrend is because of a triangle within wave B in the middle. We know that triangles cannot occur in wave 2, so it must be wave B as part of an A-B-C correction.
The Next very important evidence that A-B-C correction is completed is recent five waves up from the lows and we know that a five-wave reversal indicates a change in trend, so NIKKEI will probably stay in the uptrend.
However, in EW theory, after every five waves, a three-wave pullback follows, so before we will see a continuation higher, be aware of a corrective slow down with ideal support in the 28800 - 28300 zone. Of course, pullbacks could be even deeper, so count remains valid as long as the price is trading above 27400 May lows.
Be humble and trade smart!
If you like what we do, then please like and share the idea!
Disclosure: Please be informed that information we provide is NOT a trading recommendation or investment advice. All of our work is for educational purposes only.


NI225 29161.58 + 0.74 % LONG IDEA * PRICE ACTION OVERVIEWHELLO EVERYONE
HOPE EVERYONE IS DOING GOOD HAVING A GOOD ONE, READY FOR THE MARKET THIS WEEK, HERE'S A LOOK AT NIKKEI 225 FROM THE MONTHLY CHART.
IF THIS IDEA ASSISTS IN ANY OR IF YOU LIKE THIS ONE
SMASH THAT LIKE BUTTON & LEAVE A COMMENT.
ALWAYS APPRECIATED
____________________________________________________________________________________________________________________
* Kindly follow your entry rules on entries & stops. |* Some of The idea's may be predictive yet are not financial advice or signals. | *Trading plans can change at anytime reactive to the market. | * Many stars must align with the plan before executing the trade, kindly follow your rules & RISK MANAGEMENT.
_____________________________________________________________________________________________________________________
| * ENTRY & SL -KINDLY FOLLOW YOUR RULES | * RISK-MANAGEMENT | *PERIOD - INTRA-DAY TRAD

Keep it simple and buy ToyotaNot much to say here other than Toyota is 100x better than Tesla in everything. Personally I don't believe that a company who has a CEO like Elon will ever be successful, so I'd rather buy the most successful company out there that just had a major breakout. Definitely one of the most bullish stocks out there.

NIKKEI 225 28941.45 - 0.4% MONTHLY OVERVIEWHELLO EVERYONE
HOPE EVERYONE IS DOING GOOD HAVING A GOOD ONE IN THE MARKET THIS WEEK, HERE'S A LOOK AT THE NIKKEI 225 OVER VIEW BASICALLY FOR DIRECTION, OVERALL PERSPECTIVE & DIRECTION OF THE INDEX.
* follow your entry rules on entries
* significant moves with the bears change the plan.
lets see how it goes.
many stars must align with the plan before executing the trade, kindly follow your rules.
HAPPY TRADING EVERYONE & LET YOUR WINS RUN...
_________________________________________________________________________________________________________________________
ENTRY & SL - FOLLOW YOUR RULES
RISK-MANAGEMENT
PERIOD - SWING TRADE
__________________________________________________________________________________________________________________________
If this idea helps with your trading plan kindly leave a like definitely appreciate it.

Nikkei's multiyear rising expanding wedge and probable outcomeI have the chart depiction of Nikkei's multiyear rising expanding wedge and outcome laid out here. In my understanding, the Dow, SnP 500 and all the rest of indexes worldwide will mirror this to the final lows in March 2022 and probably beyond. The standard price targets in that rising expanding wedge pattern along with possible cycle date timings are shown no matter of any timescales in the chart. That's about 56% decline from around the high of 30,700+. German DAX 30 shows expanding megaphone in the same range of years which is targeting all the way to 3,600 in coming years (end of 2023) if the megaphone pattern fully plays out in this large context. I know that it certainly does in smaller scales for the declines up to 30%. That will be one heck of a decline to witness in anybody's lifetime.
