Nikkei225 - Daily Key ElementsThese are the key levels to look out for on the Nikkei225. Please refer to the 4hr chart for a strategic view!
Japan 225

Nikkei Elliott Wave Right Side Calling HigherHello Traders,
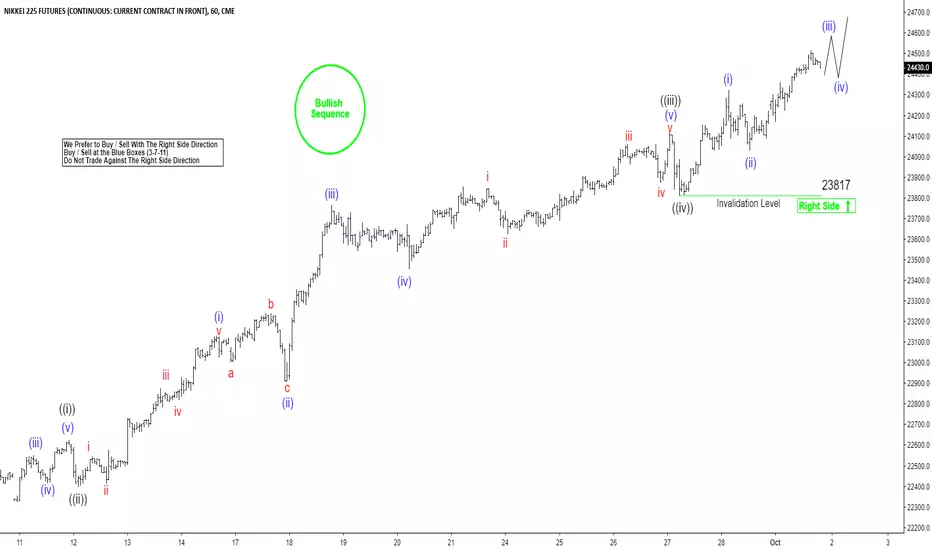
Nikkei short-term Elliott wave view suggests that the decline to 22161 on 9/06/2018 low ended red wave 2. Above from there, red wave 3 remain in progress, nesting higher in an impulse structure. With lesser degree cycles showing sub-division of 5 waves structure in each leg higher i.e black wave ((i)), ((iii)) & ((v)) expected to unfold in 5 waves structure. Also, it’s important to note that the right side is up & instrument is having a bullish sequence tag available in below chart. This suggests that the selling is not recommended.
Up from 22161 low, the initial rally to 22750 high black wave ((i)) in 5 waves. The decline to 22535 low ended black wave ((ii)) pullback.
Then the rally higher from there ended black wave ((iii)) at 24120 high. The pullback to 23817 low ended black wave ((iv)). Above from there black wave ((v)) of 3 remain in progress, looking to extend higher as long as the pivot at 23817 stays intact.
Afterwards, the index is expected to do a wave 4 pullback in 3, 7 or 11 swings before further upside is seen. We don’t like selling it & expect buyers to appear in 3, 7 or 11 swings against 23817 low.

JAPAN 225 Nikkei 225 Long I am running a trailing stop on this pair - there is currently no upside target.
Once we have broken 24168, we are in relative un-chartered territory.
Currently oversold on the 2hr timeframe and the running support line is holding the buyers up.

Nikkei Bottom formation after 2008 crisis: take-aways BTCUSD Hello all,
I'm trying to analyse several bottom formations of different asset classes in order to find key take-aways that could be useful for the BTCUSD bottom formation.
On my profile page you can find the BTCUSD analysis based on the same principles.
The Japanese Nikkei bottom formation after 2008 financial crisis:
- Top 200 MA: 17 300
- Bottom 200MA: 8 752
- Draw a fibonacci retracement from top to bottom:
Conclusions:
- After heavy selloffs; 115% retrace from 200MA top served as support.
- price levels below 115% got bought up quickly
- Afterwards price was mostly trading in the 85 - 100 - 115 retrace channel from 200MA top
- 200MA touched 100% retrace once.
- Jun2012 - Dec2012 strong consolidation around 100% retrace zone with very low volatility.
Link BTC 2014 Crash:
- parabolic selloffs
- price levels below 115% got bought up quickly
shortcommings:
- Prediction of 200MA trendline
- Empirical analysis
I'm looking forward to your feedback.
Best,
Bavo

NIKKEI 225 forming bullish ascending triangleNIKKEI 225 forming bullish ascending triangle
wait for another higher low formed then buy in
SL : 21680
TP : 24120

NIKKEI BREAKOUTThe Nikkei has broken out of its multi-month ascending triangle. If resistance at 24.2 zone can be overcome, targets are 24.4 area and 25.8 area.

Global Markets : Out of Sync ?Till 29 Jan 2018, Everything was in order but after that correction DAX & Nikkei got out of sync with SPX500 & Nifty. The divergence is clearly visible and if both DAX & Nikkei breaks the recent low then it could be the start of the next bearish markets which are long pending since 2008. And the EW wave count on NIfty & SPX500 is showing wave 5 of wave 5 ( a top in sight ) and on other hand Dollar Index is becoming bullish day by day. Any further rally in DXY would derail the last standing emerging markets and with it the SPX500.

Japanese stocks beginning to moveToday’s session saw the Nikkei close above 23,000 for the first time since the January sell-off. The chart below shows the Nikkei well positioned for a rally. Note: a) 3 higher lows b) the index on the right side of a long-term uptrend, and c) the first close higher above a 7 month resistance (the break).
This specific setup offers a good risk-reward: Entry now at 23,100 with a stop-price at 22,000 -last swing higher- for just a 5% risk.
Data based on Japan's Ministry of Finance data, and compiled by CLSA, shows the profitability of corporate Japan surging to its highest level since comparable data started being compiled in 1954. Growing data shows that Japan — in the face of a permanently bearish view of Japan’s demographics, high public debt and historically weak corporate governance — is midway through a historic turnaround in productivity and corporate return on equity. That view, said Morgan Stanley in a report published this week “puts us strongly against the consensus opinion that Japan should remain a structural underweight in global equity portfolios”.

Nikkei large time frame breakoutNikkei looks to be on it's way to January's highs. Buying dips on shorter timeframe charts

Nikkei 225 bull runNikkei with a lot of upside potential. Room for a larger timeframe downward rotation in the near future, until that time i'll be fading dips at marked zones dependent on approach. Context is everything. Happy trading

NIKKEI JAPAN 225 CRUCIAL LEVEL TO WATCH23000 IS THE CRUCIAL LEVEL TO WATCH. SEE HOW IT CLOSES THIS WEEK, IF WE SEE A STRONG BULLISH CANDLE STRIKE THROUGH 23000, WE WILL SEE NIKKEI TO REACH 24000. OTHERWISE WE WILL SEE THIS COMING BACK DOWN TO 22000.

Let's keep an eye on the japanese economy :)If no giant sea monster invades the land, their stock market has a shot at going back to ath.
Right now we are fighting this very important - actually much more important than ath - resistance, but we can see there is bearish divergence on the monthly chart.
And there are many reasons as to why we do not go up. A correction is necessary and I think will happen in the next few months.
But after this has happened, when for example the US economy collapses and investors pull their money out and want to put it elsewhere, it is possible they send it over to Japan. If I were to invest in the next year(s) this is what I would do. Pick solid companies there and let's goooooo!
Buy early in the market cycle thing. I wonder how dividends are?
So many people love pokemon giant robots and lizards, anime etc, Japanese foods but no one loves the Japan stocks.
How much investors put into jp stock should be proportional to how much they take of the culture?
If USA is 100 culture and 50 stock, and Japan is 50 culture, it should be 25 stock right?
They are certainly not as undervalued as below 10.000 points at the extreme of the selling, but once that level is beaten in a few months, very quick growth is possible. The thrill euphoria phases go fast. Just get in early but not too early in other words, unless you want to wait 15 years.
I think I will take a look in a couple of months.
This will take a long time for sure.

Bitcoin's last chance.Comparison with Nikkei.
1°) Bitcoin line of life will break and the market will create new lows. Higher probabilities
2°) Last chance for Bitcoin if the market decides to reproduce this scenario of the H&S Bottom without creating new lows.
This could happen if the Bitcoin structure rejected more lows and decided to produce the H&S bottom at higher usd levels than Nikkei did. Lower probabilities.

JP225USD Approaching Resistance, Potential Reversal!JP225USD is approaching its resistance at 22935 (100% Fibonacci extension, 78.6% Fibonacci retracement, horizontal swing high resistance) where it could potentially reverse down to its support at 22435 (38.2% Fibonacci retracement, horizontal overlap support).
Stochastic (89, 5, 3) is approaching its resiustance at 98% where a corresponding reversal could occur.

JP225USD Approaching Resistance, Potential Reversal!JP225USD is approaching its resistance at 22756 (100% Fibonacci extension, 61.8% Fibonacci retracement, horizontal swing high resistance) where it could potentially react off, causing price to reverse down to its support at 22391 (38.2% Fibonacci retracement, 61.8% Fibonacci extension, horizontal swing low support).
Stochastic (55, 5, 3) is approaching its resistance at 96% where a corresponding reversal could occur.

Nikkei 225 bounced off support, potential to rise further!Nikkei 225 has bounced off its support at 22335 (38.2% & 50% Fibonacci retracement, horizontal pullback support, ascending support line) where it has the potential to rise to its resistance at 22728 (61.8% Fibonacci retracement, horizontal pullback resistance).
Trading CFDs on margin carries high risk.
Losses can exceed the initial investment so please ensure you fully understand the risks.

JP225 ShortI was looking to long last week*
- price failed to break white Trendline (look at shaded yellow on intraday chart)
- as the story continues, we are testing another Trendline (blue line)
- will allocate short on confirmed break

Nikkei225, Correction down to 18000-19000 likely, base on EWNikkei 225 seem to have completed a 5 wave rally to the upside.
Currently we could be working downwards as an ABC corrective ZZ downwards. Looking for wave C to unfold.

NIKKEI, Daily Chart Analysis 7/16Implications and Outlook
1. Friday the Thirteenth is almost certainly not that fortunate for many. However, that didn't appear to be the situation for the equity markets. Asia stocks built on Thursday's gains with core market segments more potent throughout the region. The Nikkei Index finished way up plus 1.85%, with only a bit added in by the minus 0.4% decline of the Yen currency.
2. The index further medium-term bullish momentum did hit Mean Resistance at 22696 and is a most likely to turn downwards for the time being.
3. With this impressive rally, the disruption on Mean Resistance of 22696 will undoubtedly bring intermediate short-term bullish implications, having upside target to inner Index Rally 22825 , and Mean Resistance of 23 000 , with further assault on completed Index Rally/May's high resting at 23050.
4. Current Index Strategy Bias: Bullish 60 / Bearish 40

NI225Pennant pattern forming with macd divergence at it's lowest = breakout incoming. White shaded zones are long and short entries. More bearish than bullish on the long term. Look out for a fake break out, big wick candle, and then strong reversal before 2019. Green dotted lines represent support and resistance prices.

Nikkei continue moving bearishThe Nikkei index continues with the bearish sentiment in the last trading session of the week.

USDJPY - watch for a bearish reversalUSDJPY is about to start a downride on daily as you see. It reached the fib arc and repeats the bearish reversal patterns from the past waves. Follow the price to complete that bearish pattern it copies from the past and once it hits the fibonacci arc, we go for a down slide. Then watch for reactions or pullbacks at Gann angles. Every Gann angle line acts as support which price has to break. We can also do Elliot wave wave count once price starts moving downwards. We take TP once Elliot wave 5 is completed! It agrees with our geometrical arc analysis on XAUUSD which is about to start a ride up. Gold and USDJPY 0.02% have negative correlation (-65.5 percent on daily), as you know. You can also short Nikkei (JPN225) as they have +78 % positive correlation. If one thing goes up the other down. Our analysis confirm this correlation.
