Nikkei225 resistancesee video here www.dailyfx.com / basically looking for pullback here...implications extend to usdjpy / which we're short from a good level last night over at www.sbtradedesk.com
Japan 225

$NIKKEI - The Thin Red Line - to be, or not to be for Abenomics.Well ... we are one step over the precipice. The market is waiting for another #QE made in Japan. I hope that the strengthening of the yen is temporary and sell signals will be canceled.


$Nikkei / $JPN225 At Critical Level; Favors Decline | $JPY #BOJ TECHNICAL SYNOPSIS:
1 - Predictive/Forecasting Model defines 20780 as critical high/High-prob. reversal level
2 - Technical analysis would define 20961 as probable resistance level based on June 1997 and April 2000 structural level and last month's failure to break above same level.
3 - Current bar carves out a lower-low relative to last month's bar
Net Bias = BEARISH
BEARISH SCENARIO - 50% FIB:
Decline would likely seek Fibonacci handles at 38.6%, 50.0% or 61.8% significant retracement level. However, first retracement offers little to no past structural levels for reaction when compared to significant pivot range at the corresponding 50.0% Fib retracement level.
INVALIDATION:
Invalidation would occur if price broke above and closed above 20961. For now, market remains taut to the upside.
OVERALL:
Bears are gaining ground, defending a historical 20961 level. Market is taut to the upside, while technical profile is tilting towards bearish favors.
David Alcindor
Predictive Analysis & Forecasting
Durango, Colorado - USA
-----
Twitter:
@4xForecaster
LinkedIn:
David Alcindor
-----
.

Long Nikkei 225 Yen and Nikkie are USUALLY inversely correlated. Watch these two relationships carefully. I expect the Nikkei to decline by at least 4% before bouncing upward.

Nikkei: Low risk short setupThe Nikkei is currently in a 10 week decline and hasn't reached its target.
Today we observed a sharp retracement thanks to crude oil's short covering spree, and a very dovish Mario Draghi, sending ripples through the global markets.
I expect the move to the downside to continue, after the Vix fell for more than 7 points.
There are levels of support to be tested below, so I'd aim for the lowest one ideally, and remain short, or add to shorts here (or open new shorts if not in this trend).
For more information on setups, analysis and matters relative to the services I offer, contact me privately.
Cheers,
Ivan Labrie.

Correlation between Nikkei and USD JPYCorrelation between Nikkei and USD JPY. Since Kuroda did negative rates, Nikkei will jump up.


Nikkei225 _ Bat pattern completion.Bat pattern completion at pervious structure zone synchronized with RSI divergence.

Nikkei 225 (Playstyle)All the info, plus s/r lines that I consider important are on the chart. Trading NDK futures.
Ofc, 0.7~1.1% risk.


Possible LONG positions on NIKKEIWe have two possible short positions on the FX:JPN225
1. If price touches the first blue area, check if there is divergence on either MACD or stoch. If step 1 is fulfilled, continue.
2. If step is 1 fulfilled, we want to see either a double bottom or w/m pattern forming on 4H or 1H. Will demonstrate those patterns when the time comes. If step 2 is fulfilled, continue.
3. TP/SL will be set when necessary price action takes place in those areas. We will always wait for pullback no matter what. No pullback, no trade. If step 3 is fulfilled, continue.
4. Short when PRICE makes higher high. If it doesn't and instead makes lower low, abort this potential SHORT and look for the next red area.
Purple horizontal line: BRN(big round numbers).


Decision PointStill holding the trend line, next week will be key. RSI & MACD pointing to the downside, but its Nikkei, you never know

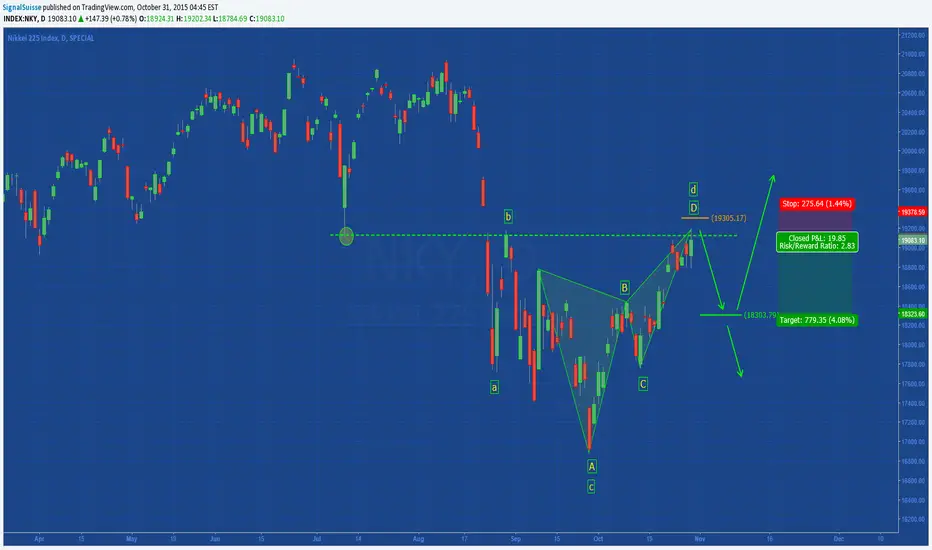
NIKKEI: Pullback/Consolidation3 Bearish Pattern in Play:
- ABCD (impulsive)
- abcd (corrective)
- Harmonic Butterfly
We appreciate your interest in our analysis, if you agree (or not) with our work, and would like to continue reading our opinions, be part of it with your "I Like"... Thanks you!
SignalSuisse
www.nonsolotrading.com
Yen index: The yen could see prolonged weaknessThe weekly index chart, with monthly MTPC overlay shows a vivid picture, that of a constantly weak yen.
We are right at a longterm downtrend mode resistance from the historical high back in 2007*, and the last test of it resulted in the start of a very volatile monthly downtrend.
We have this mode resistance as the first obstacle for new highs, as well as the low volume resistance up ahead, in the 135+ region.
The profile balance point for this uptrend sits higher up, at 148.774, so I wouldn't discount the possibility of further Yen weakness in the coming months, backed by a still running monthly uptrend signal with time to spare (price target already exceeded before starting this very volatile and sideways corrective phase) and a very clear and steep weekly uptrend that has time left as well, but with price targets already met ahead of time.
Just keep watch of this chart as you navigate the Yen pair waters.
See comments for the bigger picture view of the whole move from the 2007 high.
My current Yen vehicle is a potentially very large weekly uptrend in the Euro-yen cross. See related ideas for my forecast and trade setup.
Cheers,
Ivan.

NIKKEI: UPDATEIn my previous idea I located the key levels on chart, and was biased towards a short.
Recently, it started being obvious that the Yen was weakening, so I decided to go long GBPJPY.
I still think the dollar will remain weak for the rest of the year, possibly until June 2016, nothing has changed, but the
Nikkei is implying that it will rally asap. Tim West's recent publication clearly depicts how the stage was set up for a rally, so I'll limit myself to expand the analysis with a few more details of interest that are worth noting. I include the ichimoku indicator on chart, because it's a very highly regarded tool among japanese traders, and many pro traders as well.
It's good to contrast our own analysis with other tools from time to time.
The weekly time at mode downtrend target has been exceeded, and now, time has expired. This implies the Nikkei has a low probability of retesting the mode from where the downtrend launched, at the 20385 mark, in 9 weeks or less.
The daily chart is giving confirmation of a bullish time at mode trend signal today, which aims for the top of the kumo resistance. Interestingly enough, the lagging line, which is part of the ichimoku suite, sits above price, 26 bars back from today. This implies that it's possible for price to cross the cloud resistance and meet with the mode above, or beyond.
Good luck if going long, keep in mind rgmov is in a downtrend in the daily, so I'd still would look into fading the target hit, or the resistances above, or even short under the highest daily low after overbought spikes.
If you want live updates and more information, make sure to follow me at collective2, where I provide signals for auto trading and via email for a monthly fee.
I'm also providing access to a live trading chatroom free of charge for concordbay.com customers, contact me via skype for more details.
Cheers,
Ivan Labrie
Time at Mode FX
Analyst at Concord Bay dot com

Nikkei short at top of rangeNikkei has been ranging for a while. Had a big move up today after terrible Japanese trade data. Probably market expects more QE. Anyways on the meanwhile a nice short with first TP at bottom of range and second TP at old support

Nikkei: Fade overbought ralliesNikkei is consolidating forming a bell curve, if you look at the profile shape from the low.
The weekly downtrend that fired in August has now expired, which means there's a possibility that price goes up to retest the downtrend mode.
I see this as improbable and would suggest looking for shorts once the targets on chart are hit, or the low volume resistance zones tested.
The last daily leg implies further upside, but rgmov is at abysmal levels and forms new lows, so, it's possible that this move fails and it heads down from here.
If that were the case, next week we will have a new mode, lower, so we could look for time at mode trend signals, which would more or less imply the Nikkei will travel down to test previous support levels.
Once we have clarity here, we will know wether to consider Yen longs or not. For the time being, I'd only try short term swing trades in the yen pairs.
Regards,
Ivan Labrie
Time at Mode FX

GBPJPY: Potential breakout trade / Time at Mode signalThe analysis of multiple timeframes in GBPJPY leads me to believe that we might see a bullish breakout emerge from this juncture.
If we base on the relative strength readings, obtained from my ratio analysis, pairing gold vs each currency, we'd be biased towards a bullish trade setup here. Although rgmov doesn't signal a new 44 bar high in any timeframe, the monthly does have a recent uptrend, which turned into a lengthy sideways move, and price is emerging right from support, so this opportunity should be considered.
Check out my previous Nikkei chart, and the gbp/xau, an jpy/xau ones, as well as Tim West's own analysis on the Nikkei for more information.
The 3 targets on chart are potential reversal zones as well, the low volatility enviroment we're in makes me think we have a very big move coming!
I take this trade as a hedge against my longer term shorts in usdjpy and my eurusd and usdchf longs. It's good to keep a balanced portfolio when opening and managing multiple positions, without being incoherent with our own analysis and methodology.
I'll post uptades and send broadcasts with more information, related charts and associated add on trades to my followers at collective2. Check out my profile for details. Currently offering a 15 day free trial.
Kind regards,
Ivan Labrie
Time at Mode FX

Nikkei: Top projectionBrief EW analysis of the Nikkei index suggests we're at the top, or close to it.
As per my USDJPY/Nikkei chart, the area above is a very strong quarterly chart resistance.
A move above 23155 would invalidate this scenario, making wave 3 the smallest.
Just something to keep in mind.
Good luck!

EURJPY: Potential position trade setting upWe have an interesting scenario here, with the possibility of Nikkei topping, and the Euro on the verge of being devaluated by the ECB's monetary policy.
The setup offers a great risk/reward ratio, so I wouldn't hesitate to take it.
Target is the AB=CD completion from the top to the current sideways range, but it will probably offer plenty of shorter term opportunities to scale in and book partial profits along the way.
Good luck!
