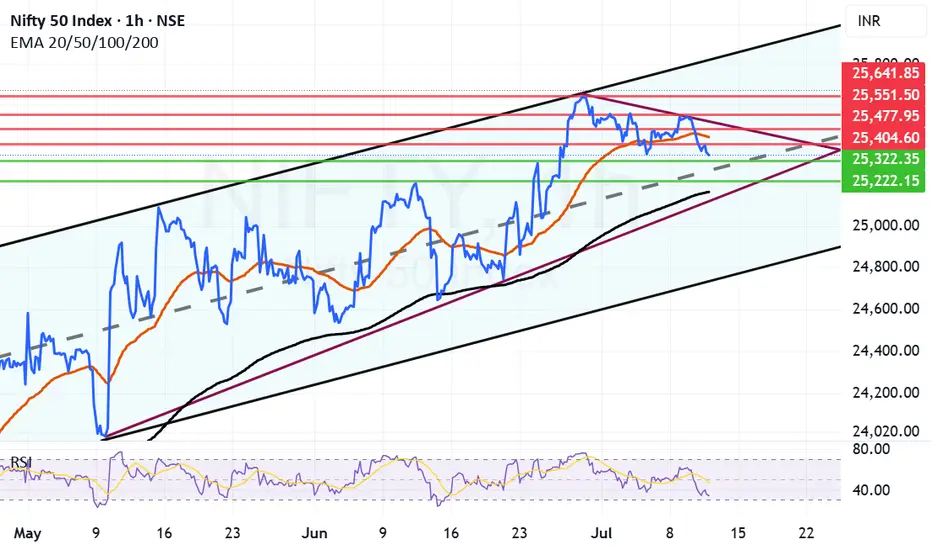
Nifty approaching Mid-channel support zone now. Nifty after a 120 point negative closing is entering an important support zone. This support zone has 3 layers. The First of the support lies at 25322 which is just above the mid-channel. The second for Nifty is near 25222 which is just below the mid channel support.
There is a possibility of bounce either from the current level or either of these 2 levels. If we get a closing below 25322 then there is a possibility that bears might try to pull Nifty down towards 25167 which is the Father line or 200 Hours EMA.
The resistances for Nifty remain at 25404, 25437 which is the Mother line or 50 hours EMA. Post that there are resistances at 25477, 25551 and 25641. Closing above 25641 is required for Nifty to fly towards 26K levels.
Disclaimer: The above information is provided for educational purpose, analysis and paper trading only. Please don't treat this as a buy or sell recommendation for the stock or index. The Techno-Funda analysis is based on data that is more than 3 months old. Supports and Resistances are determined by historic past peaks and Valley in the chart. Many other indicators and patterns like EMA, RSI, MACD, Volumes, Fibonacci, parallel channel etc. use historic data which is 3 months or older cyclical points. There is no guarantee they will work in future as markets are highly volatile and swings in prices are also due to macro and micro factors based on actions taken by the company as well as region and global events. Equity investment is subject to risks. I or my clients or family members might have positions in the stocks that we mention in our educational posts. We will not be responsible for any Profit or loss that may occur due to any financial decision taken based on any data provided in this message. Do consult your investment advisor before taking any financial decisions. Stop losses should be an important part of any investment in equity.
NIFTY
NIFTY Eyes 25,410: Setup in ActionIn this update, I’m revisiting the setup I shared earlier that points towards NIFTY’s next potential target at 25,410. The analysis covers the key levels, price action structure, and the factors supporting this move. This setup is based on clear technical confirmations and disciplined risk management — not just speculation.
Please remember to follow your own plan and manage your trades responsibly. This is for educational purposes and not financial advice. Let’s see how the price action unfolds!

Review and plan for 10th July 2025 Nifty future and banknifty future analysis and intraday plan.
Swing ideas.
This video is for information/education purpose only. you are 100% responsible for any actions you take by reading/viewing this post.
please consult your financial advisor before taking any action.
----Vinaykumar hiremath, CMT

Range Bound consolidation going on in the market. Range bound consolidation is going on in the market. As you can see in the chart there is consolidation going on before a substantial up or down move happens. Mostly it looks like Tariff negation deadline will be extended or India might end up getting the tariff deal sealed. all eyes on Trump and TCS results tomorrow. TCS has been reeling close to an year now after making a high of 4592 everything depends on the result tomorrow. The result can give direction to the market as TCS has good weightage (Around 6.09% in Nifty and 7.43% in BSE Sensex). TCS has 21.93% Weightage in Nifty IT index so the result tomorrow is a must watch. It can give direction to the It index as well.
Supports for Nifty remain at 25413 and 25243. If by chance this level is broken Nifty can fall further towards Mother line which is at 24862 or in worst case scenario towards Father line of daily chart at 24030.
Resistances for Nifty remain at: 25531 and 25710 Closing above which Nifty becomes very strong. After we get a closing above 25710 Nifty can swiftly move towards 25888 or even 26K+ levels.
Disclaimer: The above information is provided for educational purpose, analysis and paper trading only. Please don't treat this as a buy or sell recommendation for the stock or index. The Techno-Funda analysis is based on data that is more than 3 months old. Supports and Resistances are determined by historic past peaks and Valley in the chart. Many other indicators and patterns like EMA, RSI, MACD, Volumes, Fibonacci, parallel channel etc. use historic data which is 3 months or older cyclical points. There is no guarantee they will work in future as markets are highly volatile and swings in prices are also due to macro and micro factors based on actions taken by the company as well as region and global events. Equity investment is subject to risks. I or my clients or family members might have positions in the stocks that we mention in our educational posts. We will not be responsible for any Profit or loss that may occur due to any financial decision taken based on any data provided in this message. Do consult your investment advisor before taking any financial decisions. Stop losses should be an important part of any investment in equity.

BSE - BUY THE FEAR, SELL THE GREED !"Buy the fear, sell on greed" is an investment strategy that means you should buy assets when most investors are scared and selling (during periods of fear), and sell those assets when most investors are excited and buying (during periods of greed).
Why does this work?
⦁ When fear dominates the market, prices often drop below their true value because people panic and sell at low prices. This creates opportunities for disciplined investors to buy quality assets at a discount.
⦁ When greed takes over, prices often rise above their real worth because people are eager to buy, hoping for quick gains. This is usually a good time to sell, as the risk of a downturn increases.
How do emotions affect markets?
⦁ Fear leads to panic selling, causing prices to fall further and often locking in losses for those who sell at the bottom.
⦁ Greed leads to speculative buying, driving prices higher and sometimes creating bubbles that eventually burst.
Why is it hard to follow?
⦁ While the idea is simple, it is emotionally difficult to buy when everyone else is pessimistic and selling, or to sell when everyone else is optimistic and buying. Most people act on emotion rather than logic, which is why few consistently succeed with this approach.
Practical example:
During a market crash, negative news and panic cause many to sell at low prices. A disciplined investor who buys during this fear can benefit when the market recovers. Conversely, when markets are booming and everyone is rushing to buy, selling at this point can help lock in gains before a potential correction.
Key takeaway:
This strategy is about removing emotion from investing decisions and taking a contrarian approach—buying when others are fearful and selling when others are greedy—rather than following the crowd. This approach has been used by successful investors like Warren Buffett to achieve long-term success by focusing on value and maintaining emotional discipline.


Review and plan for 9th July 2025Nifty future and banknifty future analysis and intraday plan.
This video is for information/education purpose only. you are 100% responsible for any actions you take by reading/viewing this post.
please consult your financial advisor before taking any action.
----Vinaykumar hiremath, CMT

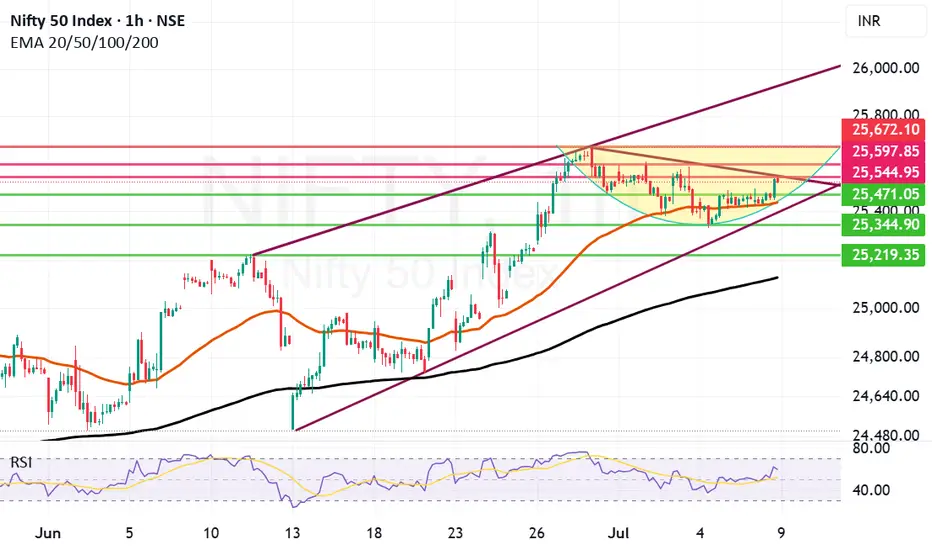
Closing above 25544 should be first step for Nifty to break freeNifty today closed in positive but still it might not be free enough to crate further bull run. the first step that Nifty needs to take to get out of this range bound trade zone or consolidation is to get a closing above 25544.
Further to this step it my find resistances at 25597, 25672. Once we close above 25672 the possibility that Bulls can regaining 26K levels and go even higher becomes stronger.
The Supports for Nifty currently remain at 25471, 25437 which is Mother line or 50 Hours EMA, 25344, 25219 and finally 25125. 25125 is the Father line support or 200 hours EMA. Closing below 25215 will empower Bears to drag Nifty further down wards.
Disclaimer: The above information is provided for educational purpose, analysis and paper trading only. Please don't treat this as a buy or sell recommendation for the stock or index. The Techno-Funda analysis is based on data that is more than 3 months old. Supports and Resistances are determined by historic past peaks and Valley in the chart. Many other indicators and patterns like EMA, RSI, MACD, Volumes, Fibonacci, parallel channel etc. use historic data which is 3 months or older cyclical points. There is no guarantee they will work in future as markets are highly volatile and swings in prices are also due to macro and micro factors based on actions taken by the company as well as region and global events. Equity investment is subject to risks. I or my clients or family members might have positions in the stocks that we mention in our educational posts. We will not be responsible for any Profit or loss that may occur due to any financial decision taken based on any data provided in this message. Do consult your investment advisor before taking any financial decisions. Stop losses should be an important part of any investment in equity.
Review and plan for 8th July 2025Nifty future and banknifty future analysis and intraday plan.
Swing ideas.
This video is for information/education purpose only. you are 100% responsible for any actions you take by reading/viewing this post.
please consult your financial advisor before taking any action.
----Vinaykumar hiremath, CMT

Review and plan for 7th July 2025 Nifty future and banknifty future analysis and intraday plan.
Swing ideas.
This video is for information/education purpose only. you are 100% responsible for any actions you take by reading/viewing this post.
please consult your financial advisor before taking any action.
----Vinaykumar hiremath, CMT

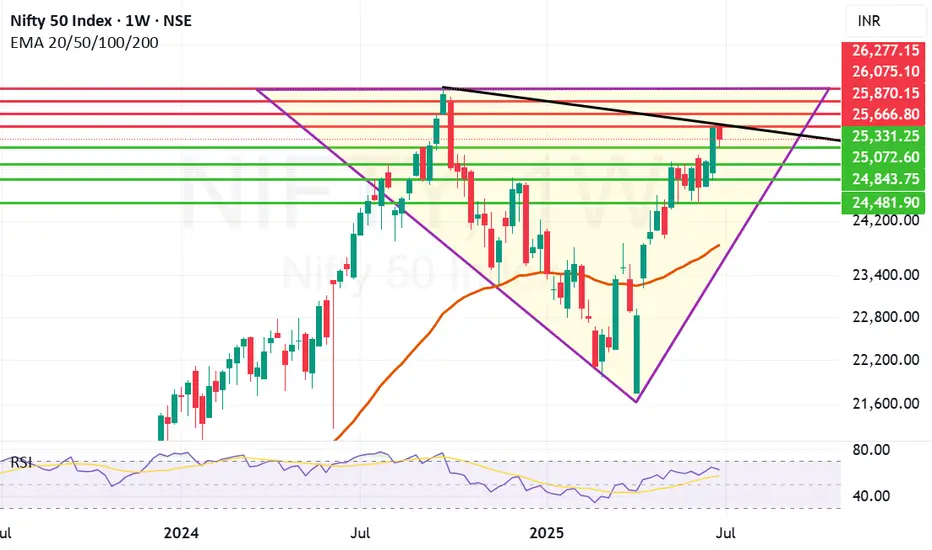
Good Closing by Nifty: Trump Tariff decision awaits us next weekNifty closed the week at 25461 well after gaining 130 points from Friday low of 25331. Overall Nifty closed 55 point positive from Thursday closing. This was a very smart recovery of Nifty from the lows of the day but we are heading towards Trump Tariff deadline of 9th July. That has potential to shake the market and move it any direction so investors should keep an eye on the developments and keep their stop losses and trailing stop losses in place. Overall Nifty is on the path to V shaped recovery as indicated in the chart. If everything works out in favour of India in the negotiation the 816 point gap from previous all time high will be bridged sooner than later. Once we reach the Previous All-time high the recovery will be complete. But we have to be cautiously optimistic.
Nifty supports currently remain at: 25331, 25072, 24843, 24481. If 24481 is broken than Bears will try to drag Nifty towards 23840 (Which is the Mother line of Weekly Chart).
Nifty Resistances currently remain at: 25666 (Trend line Resistance), 25870, 26075, 26277 (Previous All time high).
Disclaimer: The above information is provided for educational purpose, analysis and paper trading only. Please don't treat this as a buy or sell recommendation for the stock or index. The Techno-Funda analysis is based on data that is more than 3 months old. Supports and Resistances are determined by historic past peaks and Valley in the chart. Many other indicators and patterns like EMA, RSI, MACD, Volumes, Fibonacci, parallel channel etc. use historic data which is 3 months or older cyclical points. There is no guarantee they will work in future as markets are highly volatile and swings in prices are also due to macro and micro factors based on actions taken by the company as well as region and global events. Equity investment is subject to risks. I or my clients or family members might have positions in the stocks that we mention in our educational posts. We will not be responsible for any Profit or loss that may occur due to any financial decision taken based on any data provided in this message. Do consult your investment advisor before taking any financial decisions. Stop losses should be an important part of any investment in equity.
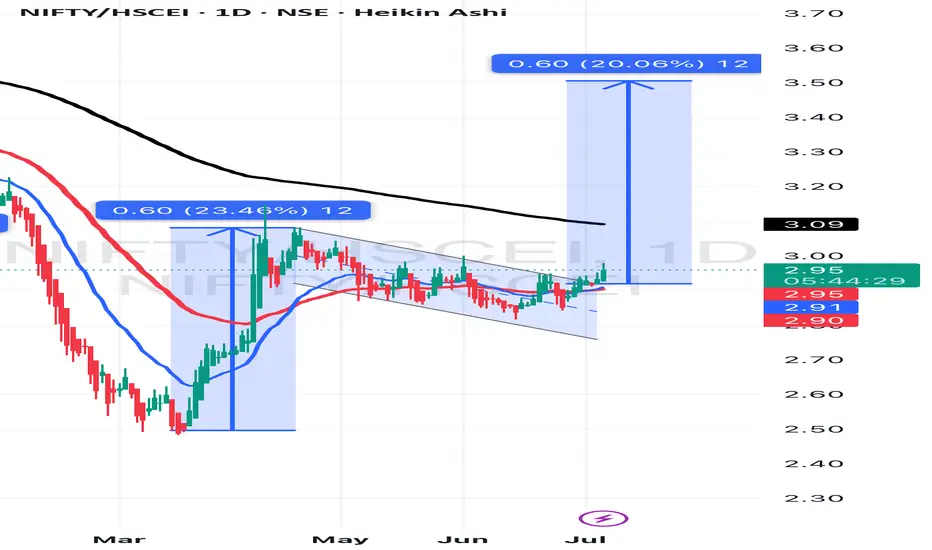
India vs ChinaYear to date, NIFTY has underperformed China - but not recently. Nifty outperformed HSCEI by nearly 20% pts between mid-Mar to mid-Apr and the over the last 2 months, gave back nearly half of these gains! What happened next?
The pullback appears to be a "flag" pattern - typically a bullish continuation - if this breakout holds (stays above 2.9 for NIFTY/HSCEI), Then the measuring implication is a whopping 3.5 - an outperformance of 18-20% pts.
Long Nifty/ HSCEI, currently ay 2.95; stops at 2.85
Review and plan for 4th July 2025 Nifty future and banknifty future analysis and intraday plan.
Swing ideas.
This video is for information/education purpose only. you are 100% responsible for any actions you take by reading/viewing this post.
please consult your financial advisor before taking any action.
----Vinaykumar hiremath, CMT

Nifty facing strong resistance between 25587 and 25500. Nifty today again failed to hold levels above 25500 as it made a high of 25587 and closed at 25405. Closing almost 182 point from its high today and 48 points down from yesterday. This is a worrying sign even if just slightly as for moving towards 26K we need a strong closing of the week at least above the Mother line. Nifty closed just below Motherline today which is showing some weakness in the rally which seems to be losing direction. The fear of Tariffs seems to be taking toll on Bulls whereas bears are currently gaining strength. The closing we get tomorrow will indicate a definitive direction to Nifty.
The Supports for Nifty currently remain at: 25385, 25299, 25177 (strong trend line support) and finally we will have Father line support of Hourly candles which is at 25050. Closing 25050 below will have potential to drag Nifty further down towards 24700 which is again a strong Channel bottom support.
The Resistances for Nifty currently remain at: 25416 (Mother line Resistance), 25470, The zone between 25500 and 25587 is a strong Trend line resistance. A closing above 25587 will have potential to take Nifty towards 25603, 25679 or even 25759 (Which is again a strong Channel top resistance).
Disclaimer: The above information is provided for educational purpose, analysis and paper trading only. Please don't treat this as a buy or sell recommendation for the stock or index. The Techno-Funda analysis is based on data that is more than 3 months old. Supports and Resistances are determined by historic past peaks and Valley in the chart. Many other indicators and patterns like EMA, RSI, MACD, Volumes, Fibonacci, parallel channel etc. use historic data which is 3 months or older cyclical points. There is no guarantee they will work in future as markets are highly volatile and swings in prices are also due to macro and micro factors based on actions taken by the company as well as region and global events. Equity investment is subject to risks. I or my clients or family members might have positions in the stocks that we mention in our educational posts. We will not be responsible for any Profit or loss that may occur due to any financial decision taken based on any data provided in this message. Do consult your investment advisor before taking any financial decisions. Stop losses should be an important part of any investment in equity.

Review and plan for 3rd July 2025 Nifty future and banknifty future analysis and intraday plan.
Swing ideas.
This video is for information/education purpose only. you are 100% responsible for any actions you take by reading/viewing this post.
please consult your financial advisor before taking any action.
----Vinaykumar hiremath, CMT

Nifty took support at the Mother line and trying to recoverNifty has taken support at the Mother line today and tried to post a recovery. Again proving our Mother, Father and small Child theory correct. To know more about the Mother father and small Child theory of stock market. Read my book THE HAPPY CANDLES WAY TO WEALTH CREATION. Nifty during the day made a low of 25378 and closed the day at 25453. It is not a strong recovery nevertheless the recover of 75 points recovery which makes shadow of the candle neutral to positive. Let us see if Nifty can recovery fully tomorrow or Friday to close the week in positive.
Nifty Supports remain at: 25396 (Mother Line Support which is also near the trend line support at 25378), there there is a support at 25245 and finally mid channel support near 25177. Closing below 25177 will make the Bears more powerful and they can drag the index further down towards Father line support near 25108.
Nifty Resistances remain at: 25470, 25528 (Trend line resistance), 25603 and finally 25679. 25759 seems to be the channel top currently in the hourly parallel channel.
Disclaimer: The above information is provided for educational purpose, analysis and paper trading only. Please don't treat this as a buy or sell recommendation for the stock or index. The Techno-Funda analysis is based on data that is more than 3 months old. Supports and Resistances are determined by historic past peaks and Valley in the chart. Many other indicators and patterns like EMA, RSI, MACD, Volumes, Fibonacci, parallel channel etc. use historic data which is 3 months or older cyclical points. There is no guarantee they will work in future as markets are highly volatile and swings in prices are also due to macro and micro factors based on actions taken by the company as well as region and global events. Equity investment is subject to risks. I or my clients or family members might have positions in the stocks that we mention in our educational posts. We will not be responsible for any Profit or loss that may occur due to any financial decision taken based on any data provided in this message. Do consult your investment advisor before taking any financial decisions. Stop losses should be an important part of any investment in equity.

Review and plan for 2nd July 2025 Nifty future and banknifty future analysis and intraday plan.
Swing idea.
This video is for information/education purpose only. you are 100% responsible for any actions you take by reading/viewing this post.
please consult your financial advisor before taking any action.
----Vinaykumar hiremath, CMT

Review and plan for 1st July 2025Nifty future and banknifty future analysis and intraday plan.
swing idea - trent
This video is for information/education purpose only. you are 100% responsible for any actions you take by reading/viewing this post.
please consult your financial advisor before taking any action.
----Vinaykumar hiremath, CMT

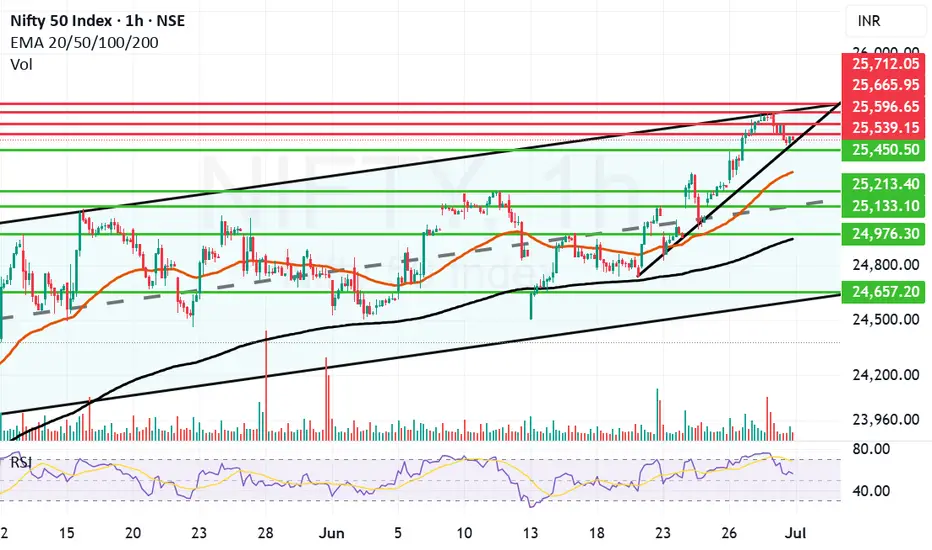
Nifty goes into consolidation mode to end the month at 25500.Today Nifty went into consolidation mode searching for the supports nearby after a massive upward run in the last week. Even though we saw Nift climbing down 120 points today the closing above 25500 is a good sign. It was a volatile day where Nifty made a high of 25669 and a low of 25473 moving 200 points down. But recovered a bit to close at 25517.
The Supports for Nifty remain at: 25450, 25321 (Mother line Support), 25133 (Mid-channel support). If that is broken the Nifty may fall further towards 24976 or 24956 (Which is the Father line support). Channel bottom seems to be at 24657. If we get a closing below this zone we will comment about further supports on the down side.
The Resistance for Nifty remain at: 24539, 24596, 25665 and finally 25712. (25712 seems to be the channel and trend top. Once Nifty closes above this zone we will be able to comment about further levels on the upside.
Disclaimer: The above information is provided for educational purpose, analysis and paper trading only. Please don't treat this as a buy or sell recommendation for the stock or index. The Techno-Funda analysis is based on data that is more than 3 months old. Supports and Resistances are determined by historic past peaks and Valley in the chart. Many other indicators and patterns like EMA, RSI, MACD, Volumes, Fibonacci, parallel channel etc. use historic data which is 3 months or older cyclical points. There is no guarantee they will work in future as markets are highly volatile and swings in prices are also due to macro and micro factors based on actions taken by the company as well as region and global events. Equity investment is subject to risks. I or my clients or family members might have positions in the stocks that we mention in our educational posts. We will not be responsible for any Profit or loss that may occur due to any financial decision taken based on any data provided in this message. Do consult your investment advisor before taking any financial decisions. Stop losses should be an important part of any investment in equity.
Review and plan for 30th June 2025Nifty future and banknifty future analysis and intraday plan.
Swing ideas.
This video is for information/education purpose only. you are 100% responsible for any actions you take by reading/viewing this post.
please consult your financial advisor before taking any action.
----Vinaykumar hiremath, CMT

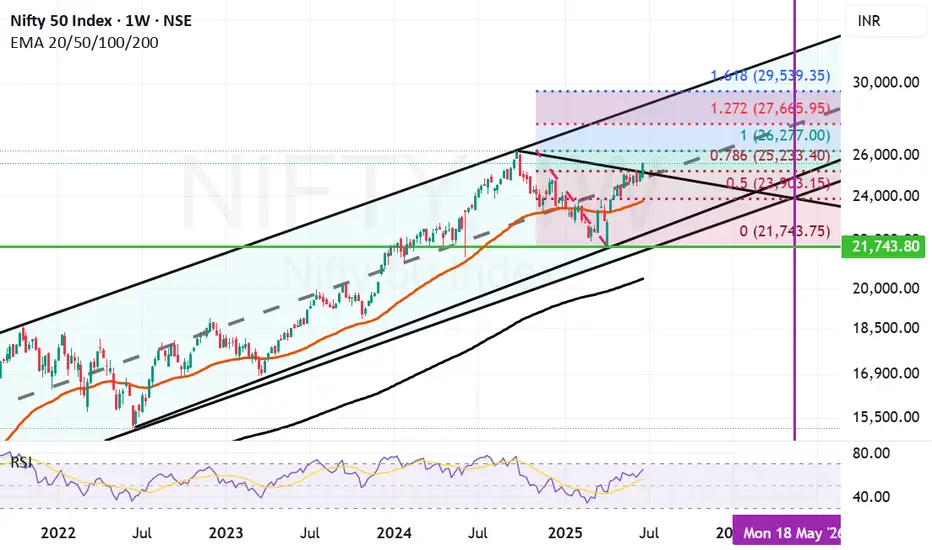
Medium to long term targets for Nifty. We have used parallel channel and Fibonacci retracement on Nifty weekly chart to gauge medium to long term targets for Nifty.
The Fibonacci retracement points out that the support for Nifty will remain at 25233(Fibonacci Support and mid channel support), 23903 (Important Fibonacci support), 23774 (Important Mother line support or 50 weeks EMA, channel bottom support). Nifty can go below these levels only in situation of another major global event or some major local event. If we get a closing below 23774 the Bear will be in commanding situation and will have the power to take Nifty further down towards 21743 which was the recent low we reached during Indo-Pak conflict.
The resistances for Nifty now are at 26277 (Major Resistance, Previous All Time high of Nifty), The next leap of faith for Nifty can be towards 27665 after we get a closing above 26277. (This will be a major hurdle and in next 1 year or so it is highly unlikely that we will cross this level unless we hit a euphoria zone.) This zone is also the current channel top zone. In very unlikely circumstance of Nifty crossing 27665 the next target for Nifty will be at 29539. (This looks possible in 18 to 24 months). We will be very lucky to reach this zone earlier. You never say never in the market.
As of now the local factors remain optimistic but there is a concern by experts related to valuation of market. As the Nifty PE currently is around 23. The results in the next couple of quarters will determine if Bull market stays active.
Disclaimer: The above information is provided for educational purpose, analysis and paper trading only. Please don't treat this as a buy or sell recommendation for the stock or index. The Techno-Funda analysis is based on data that is more than 3 months old. Supports and Resistances are determined by historic past peaks and Valley in the chart. Many other indicators and patterns like EMA, RSI, MACD, Volumes, Fibonacci, parallel channel etc. use historic data which is 3 months or older cyclical points. There is no guarantee they will work in future as markets are highly volatile and swings in prices are also due to macro and micro factors based on actions taken by the company as well as region and global events. Equity investment is subject to risks. I or my clients or family members might have positions in the stocks that we mention in our educational posts. We will not be responsible for any Profit or loss that may occur due to any financial decision taken based on any data provided in this message. Do consult your investment advisor before taking any financial decisions. Stop losses should be an important part of any investment in equity.
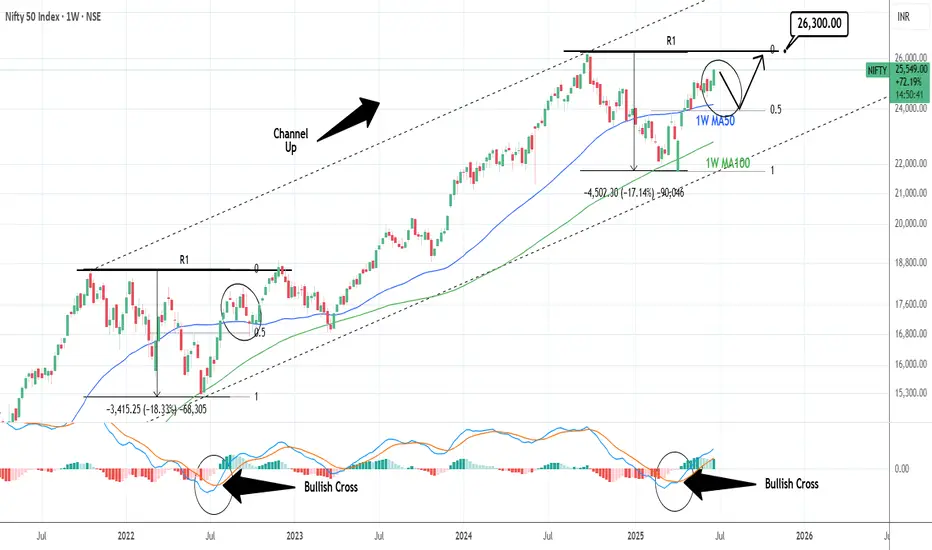
NIFTY: One more opportunity to buy lower.Nifty is on excellent bullish levels on its 1D technical outlook (RSI = 66.330, MACD = 172.380, ADX = 16.480), extending the bullish wave of the 4 year Channel Up. Being close to the R1 already, a pullback to the 0.5 Fib and the 1W MA50 isn't unlikely, as it is what happened in September 2022. That will be our final opportunity to buy low and target the R1 level (TP = 26,300).
## If you like our free content follow our profile to get more daily ideas. ##
## Comments and likes are greatly appreciated. ##
Review and plan for 27th June 2025Nifty future and banknifty future analysis and intraday plan.
Swing trade.
This video is for information/education purpose only. you are 100% responsible for any actions you take by reading/viewing this post.
please consult your financial advisor before taking any action.
----Vinaykumar hiremath, CMT
