Review and plan for 26th June 2025Nifty future and banknifty future analysis and intraday plan.
This video is for information/education purpose only. you are 100% responsible for any actions you take by reading/viewing this post.
please consult your financial advisor before taking any action.
----Vinaykumar hiremath, CMT
NIFTY

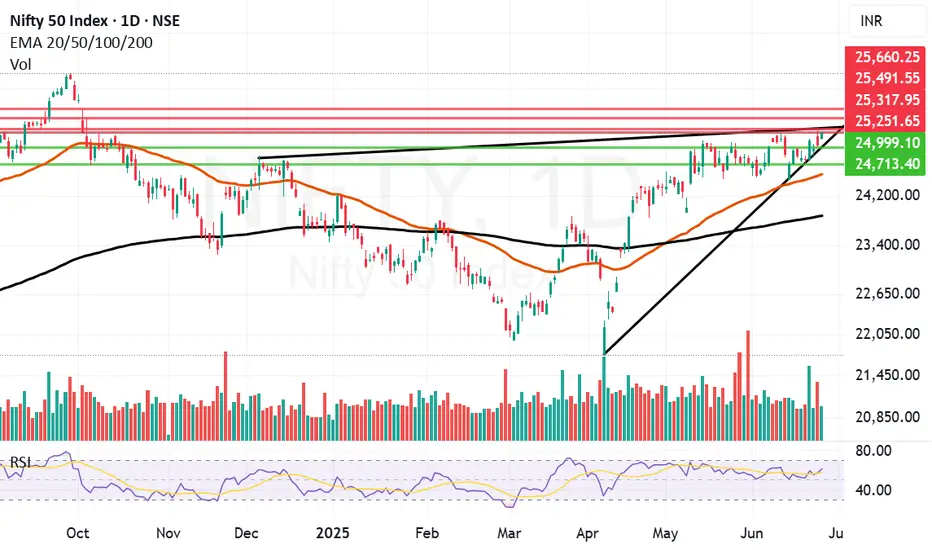
Final hurdle remains to be crossed before Nifty can fly further.One important final hurdle of 25251 remain just in front of Nifty before it can fly further. I can it a final hurdle because it is an important trendline resistance. Last 2 days Nifty has tried to climb above it but we did not get a closing above it yesterday and today as well. Today Nifty made a high of 24266 but closed at 25244. It could not hold on to the ground above 25251. The level is challenging but positive momentum built from today's display might allow it to close above the same. Only time will tell. Closing of this week will be very important.
Nifty resistances remain at: 25251, Closing above 25251 will empower Bulls to pull Nifty further upwards towards 25317, 25491 and 25660.
Nifty supports remain at: 24999, 24713, 24749 (Mother Line Support), 23875 (Father line support). (Closing below Father line support can bring Bears back into the game).
Disclaimer: The above information is provided for educational purpose, analysis and paper trading only. Please don't treat this as a buy or sell recommendation for the stock or index. The Techno-Funda analysis is based on data that is more than 3 months old. Supports and Resistances are determined by historic past peaks and Valley in the chart. Many other indicators and patterns like EMA, RSI, MACD, Volumes, Fibonacci, parallel channel etc. use historic data which is 3 months or older cyclical points. There is no guarantee they will work in future as markets are highly volatile and swings in prices are also due to macro and micro factors based on actions taken by the company as well as region and global events. Equity investment is subject to risks. I or my clients or family members might have positions in the stocks that we mention in our educational posts. We will not be responsible for any Profit or loss that may occur due to any financial decision taken based on any data provided in this message. Do consult your investment advisor before taking any financial decisions. Stop losses should be an important part of any investment in equity.
Review and plan for 25th June 2025Nifty future and banknifty future analysis and intraday plan.
This video is for information/education purpose only. you are 100% responsible for any actions you take by reading/viewing this post.
please consult your financial advisor before taking any action.
----Vinaykumar hiremath, CMT

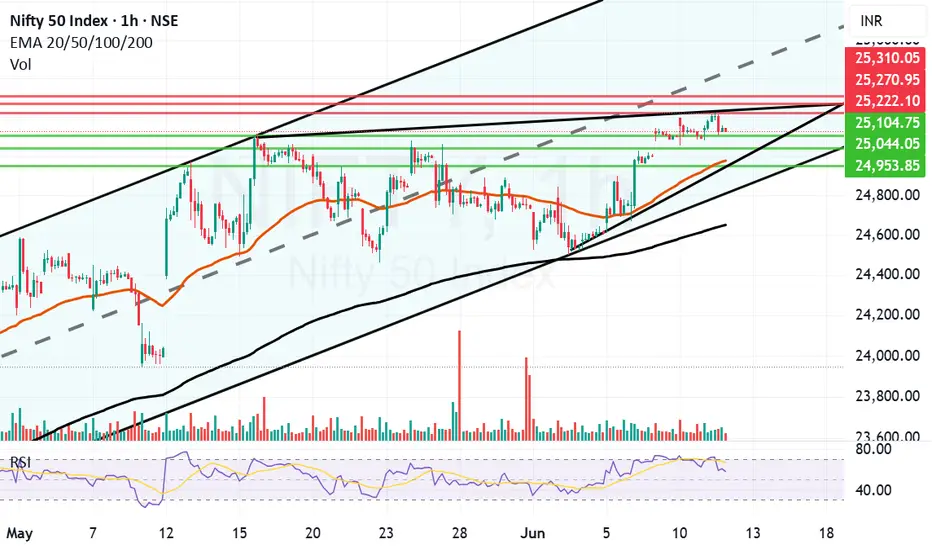
Nifty lost gains but it is a positive sign to close above 25KNifty in the Euphoria of ceasefire between Iran and Israel gained a lot of ground early in the day and made a high of 25317 but could not sustain the levels and lost massive 273 points due to profit booking to close the day at 25044. Although the loss was big but the silver lining is Nifty still ended the day 72 points in the green and closed above 25K levels. As there were news and claims related to ceasefire violations from both sides a lot of investors and participants were apprehensive of carrying long positions forward. If the things remain positive over night and if important resistance levels of 25116 and 25251 are crossed we might yet again see positive momentum building.
Nifty Resistances remain at: 25116, 25251, 25317. Closing above 25317 will lead to further upside towards the next resistance levels of 25491 and 25660.
Nifty Supports remain at: 25499 (Trend line support), 24713, 24521 (Mother Line Support) and 24463. closing below 24463 can had over the gains to the Bears who can drag index down towards Father line support of 23861.
Disclaimer: The above information is provided for educational purpose, analysis and paper trading only. Please don't treat this as a buy or sell recommendation for the stock or index. The Techno-Funda analysis is based on data that is more than 3 months old. Supports and Resistances are determined by historic past peaks and Valley in the chart. Many other indicators and patterns like EMA, RSI, MACD, Volumes, Fibonacci, parallel channel etc. use historic data which is 3 months or older cyclical points. There is no guarantee they will work in future as markets are highly volatile and swings in prices are also due to macro and micro factors based on actions taken by the company as well as region and global events. Equity investment is subject to risks. I or my clients or family members might have positions in the stocks that we mention in our educational posts. We will not be responsible for any Profit or loss that may occur due to any financial decision taken based on any data provided in this message. Do consult your investment advisor before taking any financial decisions. Stop losses should be an important part of any investment in equity.

Review and plan for 24th June 2025Nifty future and banknifty future analysis and intraday plan.
This video is for information/education purpose only. you are 100% responsible for any actions you take by reading/viewing this post.
please consult your financial advisor before taking any action.
----Vinaykumar hiremath, CMT

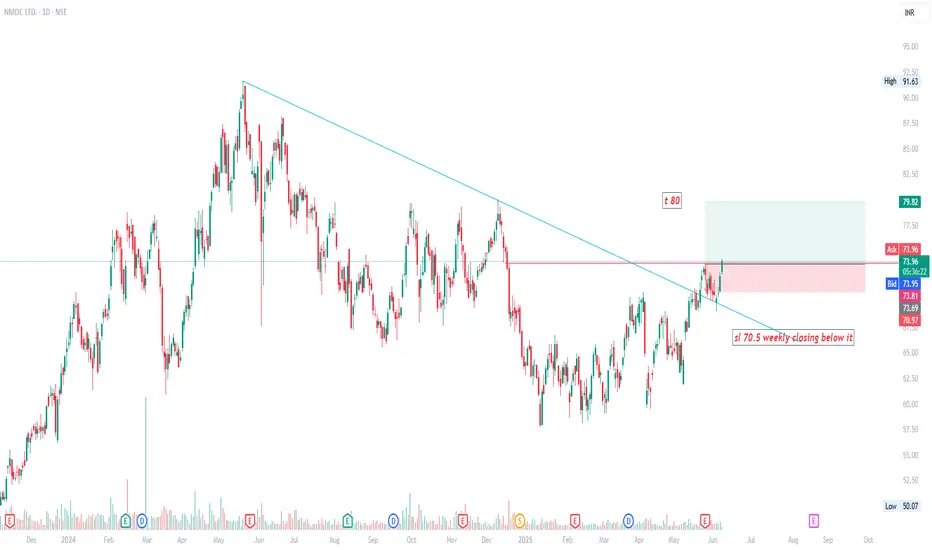
NMDC LONG NMDC CMP 74 T-80 SL 71.5 Weekly closing below it
personal bias as i hold it. not a trading call just a educational idea.
Review and plan for 24th June 2025Nifty future and banknifty future analysis and intraday plan.
This video is for information/education purpose only. you are 100% responsible for any actions you take by reading/viewing this post.
please consult your financial advisor before taking any action.
----Vinaykumar hiremath, CMT

Great recovery by Nifty to end the week. Nifty has shown a great recovery to end the week at 25112 despite persisting global uncertainties. This again shows imminent strength of Indian markets and confidence on the local factors by Bulls.
Nifty however is now entering a tough resistance zone which starts exactly from 25113 and extends till 25251. Once we get a closing above 25251 the Bulls will try to control the market with more strength. Till that happens it can still go in any direction. The supports for Nifty remain at 24869, 24713, 24480 (Mother line support), 24175 and finally 23838 (Father line support).
If any major further global escalation happens during the weekend and we get a closing below 23838 then Bears can become more powerful and they might have potential to push market further down towards 23047 or below.
Things hang in balance despite a strong closing on Friday as the shadow of the candle is still neutral.
Disclaimer: The above information is provided for educational purpose, analysis and paper trading only. Please don't treat this as a buy or sell recommendation for the stock or index. The Techno-Funda analysis is based on data that is more than 3 months old. Supports and Resistances are determined by historic past peaks and Valley in the chart. Many other indicators and patterns like EMA, RSI, MACD, Volumes, Fibonacci, parallel channel etc. use historic data which is 3 months or older cyclical points. There is no guarantee they will work in future as markets are highly volatile and swings in prices are also due to macro and micro factors based on actions taken by the company as well as region and global events. Equity investment is subject to risks. I or my clients or family members might have positions in the stocks that we mention in our educational posts. We will not be responsible for any Profit or loss that may occur due to any financial decision taken based on any data provided in this message. Do consult your investment advisor before taking any financial decisions. Stop losses should be an important part of any investment in equity.

Review and plan for 20th June 2025Nifty future and banknifty future analysis and intraday plan.
This video is for information/education purpose only. you are 100% responsible for any actions you take by reading/viewing this post.
please consult your financial advisor before taking any action.
----Vinaykumar hiremath, CMT

HDFCBANK - For my Indian Viewers!So an Indian Viewer has asked for this, so looking onto it, the heavyweight of sector NIFTY would see a move as stated!

Review and plan for 18th June 2025 Nifty future and banknifty future analysis and intraday plan.
This video is for information/education purpose only. you are 100% responsible for any actions you take by reading/viewing this post.
please consult your financial advisor before taking any action.
----Vinaykumar hiremath, CMT

Resistance zones and Geo-political instability acting up.Geo-Political instability and resistance zone are acting up together to stop Nifty and not allowing it to close above 25K. As the world is looking at developments in Iran Vs Israel conflict with beated heart market today gave up some gains from yesterday. The only index looking strong is IT index right now. Avoid taking very long positions unless you are very sure of the company. Yesterday also Nifty failed to close above 25K opened briefly near 25K today and then moved downwards. Lot will be decided in the short term by the developments that happen tonight. Important G7 meet and US Federal reserve Rate Cut meet is also to happen later in the week. These 2 global factors will decide fate of the market in the short term. Local factors are all in line and nothing to worry for Indian markets on that front.
The supports for Nifty remain at: 24713 (Trend line support), 24425 (Mother line support of Daily chart), next support is near 23917, 23806 (Father line support of daily chart is in place). Closing below 23906 can lead to further down side and in such a scenario Nifty can fall further towards 23500 or 23047 levels. If we get a closing below that we will give updates regarding the same.
Resistances for Nifty remain at: 24982 (Today's high), 25112 and trend line resistance of 25251. When we get a closing above 25251 we will update you regarding the further upward resistnace levels.
Disclaimer: The above information is provided for educational purpose, analysis and paper trading only. Please don't treat this as a buy or sell recommendation for the stock or index. The Techno-Funda analysis is based on data that is more than 3 months old. Supports and Resistances are determined by historic past peaks and Valley in the chart. Many other indicators and patterns like EMA, RSI, MACD, Volumes, Fibonacci, parallel channel etc. use historic data which is 3 months or older cyclical points. There is no guarantee they will work in future as markets are highly volatile and swings in prices are also due to macro and micro factors based on actions taken by the company as well as region and global events. Equity investment is subject to risks. I or my clients or family members might have positions in the stocks that we mention in our educational posts. We will not be responsible for any Profit or loss that may occur due to any financial decision taken based on any data provided in this message. Do consult your investment advisor before taking any financial decisions. Stop losses should be an important part of any investment in equity.

Review and plan for 17th June 2025 Nifty future and banknifty future analysis and intraday plan.
Swing trading ideas.
This video is for information/education purpose only. you are 100% responsible for any actions you take by reading/viewing this post.
please consult your financial advisor before taking any action.
----Vinaykumar hiremath, CMT

Solid V Shaped recovery within the Parallel channel for NiftyNifty recovered sharply within the parallel channel. The reasons that can be attributed are inherent strength in the Indian market and swift recovery in IT, Infra, Metal, commodities, Realty, Mid and Small cap browsers. The closing of Nifty was at 24946 which is just above the mother line which is at 24908. The same mother line provided the support to Nifty in the last few hours of trade when there was some intraday profit booking pressure.
Nifty Supports remain at: 24908 (Mother line Support), 24836, 24690 (Father Line Support), 24555 (Channel Bottom Support) and 24480 recent low. Below 24880 Nifty will be very weak and Bears in that scenario can drag Nifty further down to 24195 or 23957. These are the levels as of now. If we go below these levels in unlikely circumstances we will update the levels once we get there.
Nifty Resistances remain at: 24973, 25106 (Mid Channel Resistance) and 25231.Once we close above 25231 we will update further levels.
Disclaimer: The above information is provided for educational purpose, analysis and paper trading only. Please don't treat this as a buy or sell recommendation for the stock or index. The Techno-Funda analysis is based on data that is more than 3 months old. Supports and Resistances are determined by historic past peaks and Valley in the chart. Many other indicators and patterns like EMA, RSI, MACD, Volumes, Fibonacci, parallel channel etc. use historic data which is 3 months or older cyclical points. There is no guarantee they will work in future as markets are highly volatile and swings in prices are also due to macro and micro factors based on actions taken by the company as well as region and global events. Equity investment is subject to risks. I or my clients or family members might have positions in the stocks that we mention in our educational posts. We will not be responsible for any Profit or loss that may occur due to any financial decision taken based on any data provided in this message. Do consult your investment advisor before taking any financial decisions. Stop losses should be an important part of any investment in equity.

Review and plan for 16th June 2025Nifty future and banknifty future analysis and intraday plan.
This video is for information/education purpose only. you are 100% responsible for any actions you take by reading/viewing this post.
please consult your financial advisor before taking any action.
----Vinaykumar hiremath, CMT

Tensions in the Middle East. (Levels to watch, things to do). Iran and Israel situation is tense. Lot of investors have lot of questions in mind. I am trying to provide my opinion for the same in the video. I am trying to give my Technical and Political commentary on the situation in this educational video. The political commentary is based on my 15+ years of experience in the Middle East and is my personal opinion. I hope this will answer a lot of questions for you. I have also tried to give Techincal support and resistance levels for Nifty. In the 10 minute I have tried to cover as many points as I can. Along with the list of things to do as an investor. I hope this will help many of you.
As it was expected there was a deep fall in the market due to Israel Vs Iran tensions. US is also a direct or indirect party to the situation and if there is further escalation other global powers will mostly get involved. Due to the this situation market opened gap down at 24473. What we saw post that is Indian market recovered smartly from that situation to close at 24718. That is a huge 245 point recovery to end the day. This is why colour of the candles throughout the day (As this is an hourly chart are green despite we ended in red. (That is a classic Technical lesson for understanding candle sticks analytics). The closing is above the father line support of 24674 which is a good sign as this will be our support (Strong support for Monday.) I have spent more than 15 years in the Middle East and happen to know a little bit out of my personal experience, having interacted with a lot of locals. Thus I am trying to answer a few questions that might be coming in the minds of may investors including myself.
Q&A
The Question now are we out of danger?
Answer: Not yet.
Question 2: Why we are not out of danger?
Ans: The geo-political situation is very tense. The scale of Israeli attack was massive and there are clear and present chances of Iran counter attack which has already begun. Israel will respond again and Trump has already said that the next attacks by Israel will be even more fierce. No Iran is no palestine and there would be many countries that might support Iran. Specially China has already hinted support. Russia another ally is busy with Ukraine but you never know.
Question 3: How it goes for the other Middle Eastern countries?
Ans: There are lot of countries with US and Western bases on them. If Iran attacks them there are chances of other Western countries getting into the act too. In addition to some Middle Eastern countries getting into the act for the purpose of self defence. Thus over the weekend the things can get either very tense.
Question 4: What happens to India and Indian markets?
Ans: Today Indian markets have shown a lot of resilience. Global meltdown can affect us to for sure. But as we are neutral (As of now as it seems). The damage to our market hopefully will be minimal. Moreover recovery will be swift once the situation becomes less tense.
Question 5: What should investors do?
Ans: Long term investors can hold on to their long term positions in blue chip stocks. Keep stop losses and trailing stop losses in place for the mid-cap and small cap stocks. If some stop losses are hit or trailing stop losses are hit, you can always buy again as market is not going anywhere. The dip that we might potentially see can be an opportunity for long term investors for bottom fishing again and recalibrating their portfolios. (You can use the current situation to realign your portfolio for buying the trending stocks which have giving good results this quarter or have been giving good results since last few quarters.) Get rid of the stocks that have been dragging your portfolio down. Market has provided another opportunity for a fresh start.
Things you can do:
1) Gold and Silver are always a great option when it comes to uncertain times.
2) Do not give a knee jerk reaction in selling off your winners.
3) Watch the global updates and keep stop losses and trailing stop losses accordingly.
4) Re-calibrate your portfolio
5) If you are sitting on cash use the dip for investing in stocks with long term perspective.
The support for Nifty Remain at: 24674 (Father line support), 24640 (Mid-channel support), 24492 (Trend line support), 24382, 24208 and finally 24077 (Channel Bottom Support). a closing below 24077 will enable and empower bears to Pull Nifty further down.
Resistances for Nifty remain at: 24752, 24818, 24906 (Mother line Resistance), 25043, 25138 and finally 25223 (Channel top Resistnace). Above 25223 Bulls will potentially take over the market.
To know more about Mother Father and Small Child theory, Parallel Channel, Technical and Fundamental analysis and to learn it to master it. Read my book. The Happy Candles Way To Wealth Creation available on Amazon in Paperback and Kindle version. The book is one of the highest rated books in the category and many readers consider it as a Hand Book for Equity investment.
Disclaimer: The above information is provided for educational purpose, analysis and paper trading only. The political commentary is based on personal views and analysis. Please don't treat this as a buy or sell recommendation for the stock or index. The Techno-Funda analysis is based on data that is more than 3 months old. Supports and Resistances are determined by historic past peaks and Valley in the chart. Many other indicators and patterns like EMA, RSI, MACD, Volumes, Fibonacci, parallel channel etc. use historic data which is 3 months or older cyclical points. There is no guarantee they will work in future as markets are highly volatile and swings in prices are also due to macro and micro factors based on actions taken by the company as well as region and global events. Equity investment is subject to risks. I or my clients or family members might have positions in the stocks that we mention in our educational posts. We will not be responsible for any Profit or loss that may occur due to any financial decision taken based on any data provided in this message. Do consult your investment advisor before taking any financial decisions. Stop losses should be an important part of any investment in equity.

Tensions in the Middle East.(Geopolitical and Technical updates)As it was expected there was a deep fall in the market due to Israel Vs Iran tensions. US is also a direct or indirect party to the situation and if there is further escalation other global powers will mostly get involved. Due to the this situation market opened gap down at 24473. What we saw post that is Indian market recovered smartly from that situation to close at 24718. That is a huge 245 point recovery to end the day. This is why colour of the candles throughout the day (As this is an hourly chart are green despite we ended in red. (That is a classic Technical lesson for understanding candle sticks analytics). The closing is above the father line support of 24674 which is a good sign as this will be our support (Strong support for Monday.) I have spent more than 15 years in the Middle East and happen to know a little bit out of my personal experience, having interacted with a lot of locals. Thus I am trying to answer a few questions that might be coming in the minds of may investors including myself.
The Question now are we out of danger?
Answer: Not yet.
Question 2: Why we are not out of danger?
Ans: The geo-political situation is very tense. The scale of Israeli attack was massive and there are clear and present chances of Iran counter attack which has already begun. Israel will respond again and Trump has already said that the next attacks by Israel will be even more fierce. No Iran is no palestine and there would be many countries that might support Iran. Specially China has already hinted support. Russia another ally is busy with Ukraine but you never know.
Question 3: How it goes for the other Middle Eastern countries?
Ans: There are lot of countries with US and Western bases on them. If Iran attacks them there are chances of other Western countries getting into the act too. In addition to some Middle Eastern countries getting into the act for the purpose of self defence. Thus over the weekend the things can get either very tense.
Question 4: What happens to India and Indian markets?
Ans: Today Indian markets have shown a lot of resilience. Global meltdown can affect us to for sure. But as we are neutral (As of now as it seems). The damage to our market hopefully will be minimal. Moreover recovery will be swift once the situation becomes less tense.
Question 5: What should investors do?
Ans: Long term investors can hold on to their long term positions in blue chip stocks. Keep stop losses and trailing stop losses in place for the mid-cap and small cap stocks. If some stop losses are hit or trailing stop losses are hit, you can always buy again as market is not going anywhere. The dip that we might potentially see can be an opportunity for long term investors for bottom fishing again and recalibrating their portfolios. (You can use the current situation to realign your portfolio for buying the trending stocks which have giving good results this quarter or have been giving good results since last few quarters.) Get rid of the stocks that have been dragging your portfolio down. Market has provided another opportunity for a fresh start.
Things you can do:
1) Gold and Silver are always a great option when it comes to uncertain times.
2) Do not give a knee jerk reaction in selling off your winners.
3) Watch the global updates and keep stop losses and trailing stop losses accordingly.
4) Re-calibrate your portfolio
5) If you are sitting on cash use the dip for investing in stocks with long term perspective.
The support for Nifty Remain at: 24674 (Father line support), 24640 (Mid-channel support), 24492 (Trend line support), 24382, 24208 and finally 24077 (Channel Bottom Support). a closing below 24077 will enable and empower bears to Pull Nifty further down.
Resistances for Nifty remain at: 24752, 24818, 24906 (Mother line Resistance), 25043, 25138 and finally 25223 (Channel top Resistnace). Above 25223 Bulls will potentially take over the market.
To know more about Mother Father and Small Child theory, Parallel Channel, Technical and Fundamental analysis and to learn it to master it. Read my book. The Happy Candles Way To Wealth Creation available on Amazon in Paperback and Kindle version. The book is one of the highest rated books in the category and many readers consider it as a Hand Book for Equity investment.
Disclaimer: The above information is provided for educational purpose, analysis and paper trading only. The political commentary is based on personal views and analysis. Please don't treat this as a buy or sell recommendation for the stock or index. The Techno-Funda analysis is based on data that is more than 3 months old. Supports and Resistances are determined by historic past peaks and Valley in the chart. Many other indicators and patterns like EMA, RSI, MACD, Volumes, Fibonacci, parallel channel etc. use historic data which is 3 months or older cyclical points. There is no guarantee they will work in future as markets are highly volatile and swings in prices are also due to macro and micro factors based on actions taken by the company as well as region and global events. Equity investment is subject to risks. I or my clients or family members might have positions in the stocks that we mention in our educational posts. We will not be responsible for any Profit or loss that may occur due to any financial decision taken based on any data provided in this message. Do consult your investment advisor before taking any financial decisions. Stop losses should be an important part of any investment in equity.

Nifty 23500 Either buying opportunity or just short covering !today on 13 June nifty again support on 23500 which is talking by us very important support level, look at here ultra-high volume appear on 9.15 candle, and we are seeing bounce back from here. it could become a good opportunity buy on dips but if really smart money pending order near 23500 so why this bounce back come with falling volume, I cleared on chart it might be just short covering. what is your opinion comment please.

Review and plan for 13th June 2025Nifty future and banknifty future analysis and intraday plan.
This video is for information/education purpose only. you are 100% responsible for any actions you take by reading/viewing this post.
please consult your financial advisor before taking any action.
----Vinaykumar hiremath, CMT

Things heating up between Iran and US. Market takes a nose dive.There is a news of things heating up between Iran and US with regards to Nuclear negotiations. It seems US has asked for reduction of staff at few embassies across the Middle East. In addition to the tragic plane crash in Ahmedabad also might have affected the sentiment. Market had already nosedived before the tragedy struck so it is hard to say it had any effect. Only logical explanation seems to be the Iran related escalation. On the technical Nifty was not able to hold above 25200 levels even after multiple attempts. This suggests upside-down there were currently no takes for the upside such scenario only leads to a correction and market diving to find a concrete bottom before beginning the next upward movement. The geo-political developments should be closely watched to speculate about further moves of market.
The zone between 24818 to 24672 has multiple supports including trend line support and mid-channel support and Father line support at 24672 as it can be seen in the chart. A closing below 24672 will only give the advantage to the bears who can further drag the Nifty towards 24492, 24382 or 24208 (Channel bottom support). Things get worse beyond this point but we will only talk about it if we get a closing below this level.
Resistance on the upside remain at 24902, 24974 (Mother line Resistance), 25043, 25138 and 25223. If we get a closing above 25223 then the channel top will be around 25337. Regarding the levels above 25337 we will post once we reach that stage.
Disclaimer: The above information is provided for educational purpose, analysis and paper trading only. Please don't treat this as a buy or sell recommendation for the stock or index. The Techno-Funda analysis is based on data that is more than 3 months old. Supports and Resistances are determined by historic past peaks and Valley in the chart. Many other indicators and patterns like EMA, RSI, MACD, Volumes, Fibonacci, parallel channel etc. use historic data which is 3 months or older cyclical points. There is no guarantee they will work in future as markets are highly volatile and swings in prices are also due to macro and micro factors based on actions taken by the company as well as region and global events. Equity investment is subject to risks. I or my clients or family members might have positions in the stocks that we mention in our educational posts. We will not be responsible for any Profit or loss that may occur due to any financial decision taken based on any data provided in this message. Do consult your investment advisor before taking any financial decisions. Stop losses should be an important part of any investment in equity.

Review and plan for 12th June 2025Nifty future and banknifty future analysis and intraday plan.
Positional/short term stock ideas.
This video is for information/education purpose only. you are 100% responsible for any actions you take by reading/viewing this post.
please consult your financial advisor before taking any action.
----Vinaykumar hiremath, CMT

Nifty Facing resistnace above 25200 zoneToday Nifty closing above 25141 is a positive sign but it is evidently facing resistnace above 25200 zone. Nifty made a high of 25222 today but could not sustain at those levels and fell but eventually closed in the positive. The daily candle formed is an indecisive Doji.
IT Sector seems to be on the verge of a Reverse Head and Shoulder Breakout. If this breakout happens and Nifty gets support from other heavy weights we can see it growing further.
The resistances for Nifty now are at 25222, 25270 and 25310.
The supports for Nifty are at 25104, 25044, 24977 (Mother line support of Daily chart and 24953 Channel bottom. Things are in balance with shadow of the candle slightly positive.
Disclaimer: The above information is provided for educational purpose, analysis and paper trading only. Please don't treat this as a buy or sell recommendation for the stock or index. The Techno-Funda analysis is based on data that is more than 3 months old. Supports and Resistances are determined by historic past peaks and Valley in the chart. Many other indicators and patterns like EMA, RSI, MACD, Volumes, Fibonacci, parallel channel etc. use historic data which is 3 months or older cyclical points. There is no guarantee they will work in future as markets are highly volatile and swings in prices are also due to macro and micro factors based on actions taken by the company as well as region and global events. Equity investment is subject to risks. I or my clients or family members might have positions in the stocks that we mention in our educational posts. We will not be responsible for any Profit or loss that may occur due to any financial decision taken based on any data provided in this message. Do consult your investment advisor before taking any financial decisions. Stop losses should be an important part of any investment in equity.
GAIL 1H Chart Analysis (Trendline Breakout Setup)NSE:GAIL GAIL 1H Chart Analysis (Trendline Breakout Setup)
The 1-hour chart of GAIL (India) Ltd shows a clean descending trendline breakout followed by higher lows, indicating strength building up. The price is consolidating just below a horizontal resistance around ₹193, forming a potential ascending triangle pattern.
Trendline Breakout:
Price has broken a long-standing descending trendline.
Retest and higher lows have followed the breakout, showing bullish intent.
Ascending Triangle Pattern:
Horizontal resistance near ₹193 is tested multiple times.
Rising trendline support suggests buyers are becoming aggressive.
Volume Confirmation Needed:
A breakout above ₹193.10 with volume would validate the bullish setup.
Trade Setup:
Buy Entry: Above ₹193.10 (confirmed breakout
Stop Loss: Below ₹190.00 (below rising trendline) CLOSING BASIS
Target 1: ₹196.85 (resistance zone)
Target 2: ₹204.50 (swing high)
The combination of trendline breakout and ascending triangle formation indicates a strong bullish continuation setup. Entry above ₹193.10 is ideal after confirmation, with targets up to ₹204 and risk well-managed below ₹190.
Disclaimer: I am not a SEBI-registered advisor. The analysis shared is purely for educational and informational purposes only. Please consult your financial advisor before making any investment or trading decision. Trading and investing in the stock market involves financial risk. The author will not be held responsible for any losses incurred.
@thetradeforecast
NSE:GAIL NSE:NIFTY
