Nifty facing trendline resistance and RSI cooling down. Nifty had come close to overbought zone. Not that it was immensely overbought. It is also facing a trendline resistance which is hampering it's further progress. Bears are trying their best to bring it down while Bulls are trying to pull it above the trend line. The trade is in perfect balance right now. Once during the day Nifty had broken the trendline resistnace too as it made a high of 25199 but could not sustain the levels and was pulled down immediately. 25055 provided support and kept it Flat.
Supports for Nifty now remain at 25052, 24957, 24917 (Mother line of hourly chart), 24846 is another trend line support. Father line support is at 24614. Below this level bears will take over.
Resistances for Nifty remain at 25118, 25199 (Trend line resistance), A closing above 25199 will enable and empower bears as this will be a closing above mid channel resistance too. In such a scenario Bulls can further full Nifty upwards towards 25298 and 25387 levels.
Disclaimer: The above information is provided for educational purpose, analysis and paper trading only. Please don't treat this as a buy or sell recommendation for the stock or index. The Techno-Funda analysis is based on data that is more than 3 months old. Supports and Resistances are determined by historic past peaks and Valley in the chart. Many other indicators and patterns like EMA, RSI, MACD, Volumes, Fibonacci, parallel channel etc. use historic data which is 3 months or older cyclical points. There is no guarantee they will work in future as markets are highly volatile and swings in prices are also due to macro and micro factors based on actions taken by the company as well as region and global events. Equity investment is subject to risks. I or my clients or family members might have positions in the stocks that we mention in our educational posts. We will not be responsible for any Profit or loss that may occur due to any financial decision taken based on any data provided in this message. Do consult your investment advisor before taking any financial decisions. Stop losses should be an important part of any investment in equity.
NIFTY

BANKNIFTY - 1 Day Time Frame Analysis📈 NSE:BANKNIFTY - 1 Day Time Frame Analysis
This chart shows a classic Inverse Head and Shoulders pattern forming on the daily timeframe of BankNifty. This is a bullish reversal pattern, generally indicating a potential shift from a downtrend to an uptrend.
Left Shoulder: Formed around April 23rd–25th, marked by a short-term low.
Head: The lowest point in the pattern, formed around May 8th.
Right Shoulder: Formed around May 28th, indicating buyers are stepping in earlier, showing strength.
The neckline resistance lies near 55,913, which the price is currently testing. A decisive breakout above this level, with good volume, could signal a further upward move towards the higher resistance zones like 56,526, 56,907, and possibly 57,292.
Key Support Zones:
55,167
54,791
54,479
Traders may look for a daily candle close above 55,913 for confirmation. Risk management is crucial as a failed breakout may lead to a retest of support levels.
TRADE PLAN:
🔹 Entry:
On a daily candle close above 55,913 (neckline resistance).
Preferably with strong volume confirmation.
🔹 Targets (Upside Levels):
Target 1: 56,526
Target 2: 56,907
Target 3: 57,292
🔹 Stop Loss:
Below 55,167 (recent support and right shoulder low)
Conservative traders can use a tighter stop below 55,400 (previous candle low).
🔹 Risk Management:
Use appropriate position sizing (risk only 1-2% of capital).
Wait for candle close above breakout level, not just intraday movement.
🔹 Invalidation:
If price fails to hold above neckline and breaks below 55,167, pattern becomes invalid.
This setup favors bulls as long as price sustains above the neckline.
Disclaimer: This analysis is for educational and informational purposes only. Please consult your financial advisor before making any trading or investment decisions.

Review and plan for 10th June 2025 Nifty future and banknifty future analysis and intraday plan.
Positional ideas.
This video is for information/education purpose only. you are 100% responsible for any actions you take by reading/viewing this post.
please consult your financial advisor before taking any action.
----Vinaykumar hiremath, CMT

#nifty - 1 hour time frameAll these arrows show strong buyer reactions from support zones (mostly around 24,430–24,590).
The chart indicates a bullish bias at lower levels, but the price is still struggling to break the falling channel trendline (which acts as resistance).
A break above the purple line (24,760) and the upper trendline would confirm a trend reversal or breakout.
NSE:NIFTY
Only for educational purposes.
This content is not a recommendation to buy and sell.
Not SEBI REGISTRAR.
@Tradeforecast
#NIFTY #BANKNIFTY #SENSEX #STOCKMARKET

Nifty Gave Breakaway Gap Strong Bullish SignalWhat is Breakaway GAP?
A breakaway gap refers to the situation in the market where there is a strong price movement that crosses support or resistance. Breakaway gaps are formed after substantial periods of consolidation of prices in the market. It signifies a break from the previous trading range or pattern, and it suggests that a new trend or direction is emerging.
Nifty was trading in a range for 5 days and today 6/09/2025 it gap up and sustained above 25000 crucial level, the importance of break-away gap is that it's very strong sign of bullishness in market this also strong support too so if nifty come to retrace it would become support around 25000 level,
if nifty break today opening rang then it's very likely that it will go further so there are possibly Two entry Sign for Long: - first, OR breakout, second: -retracement on 15 Min chart near 20 Ema -50 Ema. Thats My opinion

Review and plan for 9th June 2025Nifty future and banknifty future analysis and intraday plan.
Positional idea.
This video is for information/education purpose only. you are 100% responsible for any actions you take by reading/viewing this post.
please consult your financial advisor before taking any action.
----Vinaykumar hiremath, CMT


50 bps Repo Rate Cut boosts Nifty. Can it fly further now?The market was expecting a Repo Rate Cut From RBI. The expectation was for 25bps but what we got today from RBI was a bumper 50 bps rate cut. This propelled Nifty to close above much coveted level of 25K as Nifty managed to close at 25003. Now Nifty has entered a critical resistance zone. This zone starts from around 25037 to 25146. Closing above 25146 is mandatory for Nifty to fly further and gain further momentum. Last 4 weeks or so Nifty has been returning back from this zone. We can see this in the weekly chart of Nifty. With rate cut the chances for Nifty to fly above this most important levels has increased a lot.
The resistances for Nifty Now Remain at: 25037, 25146 (Important Trend line Resistance, Bulls will be very active above this level.), 25473, 25804 and 26277. Further levels will be given once we get a closing above 26277.
The supports for Nifty remain at: 24642, 24425, 23904, 23597 (Most important Mother Line of Weekly Candles). Below this level Nifty will become very week again and bears can drag Nifty further down towards 23201 (Important Trend Line Support). If this is broken in unlikely global or local geo-political event then Nifty can further fall to 22169 or even 21671 levels in unlikely scenario of major geo-political event unfolding.
Disclaimer: The above information is provided for educational purpose, analysis and paper trading only. Please don't treat this as a buy or sell recommendation for the stock or index. The Techno-Funda analysis is based on data that is more than 3 months old. Supports and Resistances are determined by historic past peaks and Valley in the chart. Many other indicators and patterns like EMA, RSI, MACD, Volumes, Fibonacci, parallel channel etc. use historic data which is 3 months or older cyclical points. There is no guarantee they will work in future as markets are highly volatile and swings in prices are also due to macro and micro factors based on actions taken by the company as well as region and global events. Equity investment is subject to risks. I or my clients or family members might have positions in the stocks that we mention in our educational posts. We will not be responsible for any Profit or loss that may occur due to any financial decision taken based on any data provided in this message. Do consult your investment advisor before taking any financial decisions. Stop losses should be an important part of any investment in equity.

Review and plan for 6th June 2025 Nifty future and banknifty future analysis and intraday plan.
Positional ideas.
This video is for information/education purpose only. you are 100% responsible for any actions you take by reading/viewing this post.
please consult your financial advisor before taking any action.
----Vinaykumar hiremath, CMT

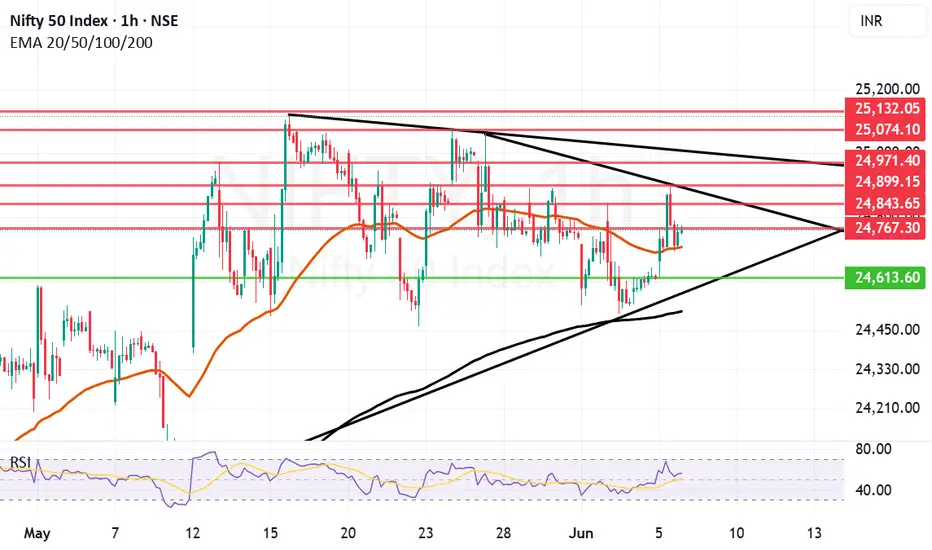
Nifty bounce between Trendline resistance and Mother lineWe Saw a jump of 130 points in Nifty today. The jump could have been higher if trend line resistance would not have come into play. This trend line resistance which came into effect is exactly around 24899 as it can be seen in the chart which was also the day's high. After making this high Nifty fell again until Mother line support present near 24706 again came into act for Nifty to close near 24750.
Thus the supports for Nifty now remain at: 24706 (Mother Line Support), 24613 (Low of today) and Father line Support near 24508. Below 24508 there will be further weakness and Bears will take control of the market.
The Resistances for Nifty now remain at: 24767, 24843, 24899 (trend line resistance), and 24971(Another Trend line resistance). Above 24971 closing Nifty will gain strength again and Bears can pull the market upwards towards 25074 or 25132. Closing above 25132 will be very good for the market as there seems to be a pure Bull territory above this zone.
Disclaimer: The above information is provided for educational purpose, analysis and paper trading only. Please don't treat this as a buy or sell recommendation for the stock or index. The Techno-Funda analysis is based on data that is more than 3 months old. Supports and Resistances are determined by historic past peaks and Valley in the chart. Many other indicators and patterns like EMA, RSI, MACD, Volumes, Fibonacci, parallel channel etc. use historic data which is 3 months or older cyclical points. There is no guarantee they will work in future as markets are highly volatile and swings in prices are also due to macro and micro factors based on actions taken by the company as well as region and global events. Equity investment is subject to risks. I or my clients or family members might have positions in the stocks that we mention in our educational posts. We will not be responsible for any Profit or loss that may occur due to any financial decision taken based on any data provided in this message. Do consult your investment advisor before taking any financial decisions. Stop losses should be an important part of any investment in equity.
nifty rangeHere’s a professional and engaging **TradingView post description** for a **Nifty range-bound market** scenario:
---
📊 **Nifty Index – Range-Bound Consolidation Ahead?** 🧭
Nifty is currently trading within a defined range, indicating indecision in the market. The index is facing resistance near **25000** and finding support around **24500**.
📌 **Key Observations:**
* Price action suggests a sideways trend with no clear breakout yet.
* Volumes are relatively lower, reinforcing the consolidation phase.
🛑 **Resistance:** 25000
✅ **Support:** 24500
🔍 A breakout on either side could trigger the next directional move. Until then, traders should focus on **range-bound strategies** like buying near support and selling near resistance, with tight stop-losses.
💬 What’s your view on Nifty's next move? Drop your analysis in the comments!
\#Nifty50 #NiftyAnalysis #NiftyRange #StockMarketIndia #TradingView #TechnicalAnalysis #NiftyOutlook #NSEIndia #BankNifty #PriceAction #NiftyLevels

Review and plan for 5th June 2025 Nifty future and banknifty future analysis and intraday plan.
Positional ideas.
This video is for information/education purpose only. you are 100% responsible for any actions you take by reading/viewing this post.
please consult your financial advisor before taking any action.
----Vinaykumar hiremath, CMT

Review and plan for 4th June 2025Nifty future and banknifty future analysis and intraday plan.
Positional ideas.
This video is for information/education purpose only. you are 100% responsible for any actions you take by reading/viewing this post.
please consult your financial advisor before taking any action.
----Vinaykumar hiremath, CMT

Bull Rally Losing steam as international factors weigh in. The Bull rally that we saw in Nifty in the last one month or so is losing a little steam as international factors related to escalating Russia and Ukraine war and International Tariff war start to weigh in. This made it difficult for Nifty to hold on to levels above 25000 after making a high of 25116 in the current rally. After making a high it is any substantial rally would try to consolidate and find a reasonable bottom from where it can launch again. Verifying a solid support is necessary for rally to move forward.
The supports for Nifty currently are at: 24515, 24185 (Mother line important support), 23945, 23689 (Father line important support). If 23689 is broken the bears will be very active again and can potentially drag down nifty to 23214, 22902 or even 22666. So 24185 and 23689 are important levels for Nifty to hold.
The Resistances for Nifty currently are at: 24838, 25116 (Important Resistance level, recent high). Sustaining above 25116 and Nifty closing above it can enable next leg of the rally which can take us in future to next resistance levels of 25438, 25641, 25845 and 26K+ levels.
The market might be speculating Russian response to Ukraine Drone attack. The scale of Russian attack if it happens will determine the movement of market. The local factors are mostly in favour of Indian markets. So long term investors should not worry. Traders and short term investors should avoid taking unnecessary risk as situation on international front. Geo-Political risk in the subcontinent, at Israel front and Between Russia and other EU nations should be on the hindsight of any decision making. Additionally there are rising number of COVID cases in India which can also become a factor which can effect market sentiment.
Disclaimer: The above information is provided for educational purpose, analysis and paper trading only. Please don't treat this as a buy or sell recommendation for the stock or index. The Techno-Funda analysis is based on data that is more than 3 months old. Supports and Resistances are determined by historic past peaks and Valley in the chart. Many other indicators and patterns like EMA, RSI, MACD, Volumes, Fibonacci, parallel channel etc. use historic data which is 3 months or older cyclical points. There is no guarantee they will work in future as markets are highly volatile and swings in prices are also due to macro and micro factors based on actions taken by the company as well as region and global events. Equity investment is subject to risks. I or my clients or family members might have positions in the stocks that we mention in our educational posts. We will not be responsible for any Profit or loss that may occur due to any financial decision taken based on any data provided in this message. Do consult your investment advisor before taking any financial decisions. Stop losses should be an important part of any investment in equity.

Review and plan for 3rd June 2025Nifty future and banknifty future analysis and intraday plan.
This video is for information/education purpose only. you are 100% responsible for any actions you take by reading/viewing this post.
please consult your financial advisor before taking any action.
----Vinaykumar hiremath, CMT

Nifty Bounces from Channel Bottom. Amidst escalation in Ukraine and Russia tussle with Ukraine going on major Drone offensive and Russia likely to respond anytime this week. The escalation can lead to NATO involvement and this can spell a major downside for Global market. The above is just speculation and things can take a different trajectory as well. During such global negative news Indian markets made a low of 24526 but recovered 190 points to close near 24716. This shows the strength of Indian market and shows that we are quiet buoyant.
Resistance for Nifty Remain near: 24763 (Mother Line of Hourly Chart), 24887, 25041 (Mid channel resistance and 25151.
Supports For Nifty Currently remain at: 24637, 24519 (Parallel Channel Bottom) and 24474 (Father Line of Hourly Chart).
If we get a closing below 24474 Bears will have an upper hand and can drag market further down we give the downside levels if we reach there. If we get a closing above 25151 Bulls Will have an Upper hand and can pull the index further upwards we give further upside levels once we reach there.
Disclaimer: The above information is provided for educational purpose, analysis and paper trading only. Please don't treat this as a buy or sell recommendation for the stock or index. The Techno-Funda analysis is based on data that is more than 3 months old. Supports and Resistances are determined by historic past peaks and Valley in the chart. Many other indicators and patterns like EMA, RSI, MACD, Volumes, Fibonacci, parallel channel etc. use historic data which is 3 months or older cyclical points. There is no guarantee they will work in future as markets are highly volatile and swings in prices are also due to macro and micro factors based on actions taken by the company as well as region and global events. Equity investment is subject to risks. I or my clients or family members might have positions in the stocks that we mention in our educational posts. We will not be responsible for any Profit or loss that may occur due to any financial decision taken based on any data provided in this message. Do consult your investment advisor before taking any financial decisions. Stop losses should be an important part of any investment in equity.

RELIANCE LTD – 1H TIME FRAME ANALYSIS📊 NSE:RELIANCE – 1H TIME FRAME ANALYSIS
A symmetrical triangle pattern is forming on Reliance's 1-hour chart, showing a consolidation phase. This pattern is neutral in nature, meaning a breakout can occur in either direction, but the setup provides a great opportunity for a breakout trade.
The price is now at the apex of the triangle, indicating a potential breakout in the upcoming sessions. Watch for a strong move backed by volume.
TRADE PLAN :
Chart Pattern: Symmetrical Triangle
Timeframe: 1 Hour
Stock: Reliance Industries Ltd (NSE)
🔼 Long Trade (Breakout above 1430.55)
Entry: Above 1,430.55 (candle close with volume confirmation)
Target 1: 1,458.35
Target 2: 1,479.35
Stop Loss: Below 1,417
🔽 Short Trade (Breakdown below trendline):
Entry: Below triangle breakdown with strong red candle
Target 1: 1,397.55
Target 2: 1,368.25
Stop Loss: Above 1,430
Note: Avoid entering during the triangle zone. Trade only post-confirmation of breakout/breakdown with volume.
Disclaimer: This analysis is for educational purposes only. Please consult your financial advisor before making any trading decisions.

Review and plan for 2nd June 2025 Nifty future and banknifty future analysis and intraday plan in kannada.
This video is for information/education purpose only. you are 100% responsible for any actions you take by reading/viewing this post.
please consult your financial advisor before taking any action.
----Vinaykumar hiremath, CMT

INFY 1H Chart Analysis (Bullish Bat + Falling Wedge)NSE:INFY
INFY 1H Chart Analysis (Bullish Bat + Falling Wedge)
In this 1-hour chart of Infosys Ltd (NSE: INFY), a Bullish Bat Harmonic Pattern has completed at point D, suggesting a potential reversal zone. Additionally, a falling wedge formation adds to the bullish confluence.
1. Pattern Structure:
The chart displays a complete Bullish Bat Pattern (X-A-B-C-D).
Point D aligns with the PRZ (Potential Reversal Zone), with a CD leg extending \~1.618 of BC, supporting a bullish reversal.
2. Falling Wedge Pattern;
A falling wedge, generally a bullish pattern, has formed from point C to D.
A breakout above the wedge trendline may confirm a bullish move.
3. Price Action:
The price is testing the upper boundary of the wedge.
Buying interest is visible at the P,R,Z near ₹1,540–₹1,545.
Trade Plan:
Buy Entry: Above ₹1,555 (confirmation breakout above wedge)
Stop Loss: Below ₹1,538 (beneath point D and wedge support)
Target 1: ₹1,568 (previous resistance)
Target 2: ₹1,611 (mid-term resistance)
Target 3: ₹1,631 (major swing high)
A strong bullish confluence exists with the harmonic pattern and falling wedge. Wait for confirmation above ₹1,555 before entering. Maintain proper risk-reward with a stop below ₹1,538.
NSE:INFY NSE:NIFTY NSE:CNXIT

Review and plan for 30th May 2025Nifty future and banknifty future analysis and intraday plan.
Quarterly results.
This video is for information/education purpose only. you are 100% responsible for any actions you take by reading/viewing this post.
please consult your financial advisor before taking any action.
----Vinaykumar hiremath, CMT

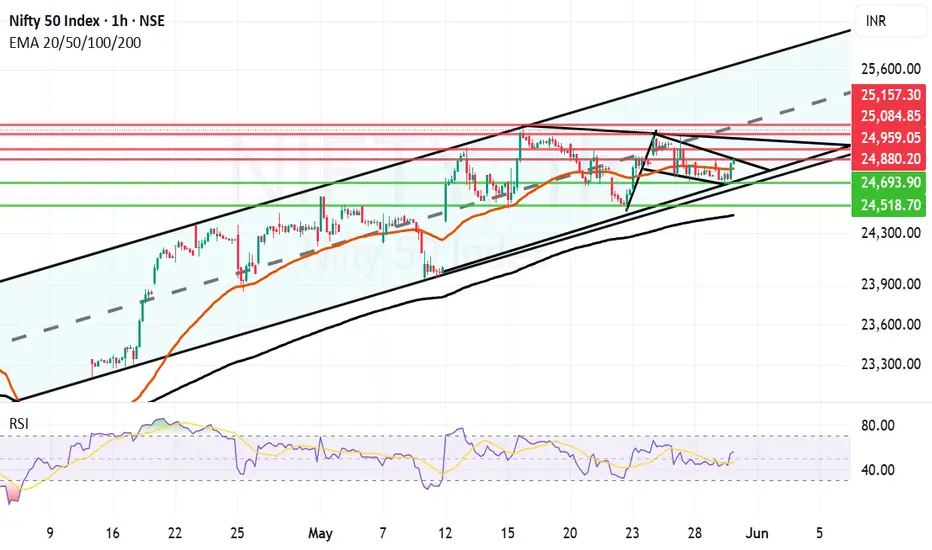
Flag and Pole kind of structure forming in Nifty. There is a very positive looking flag and pole kind of structure forming in Nifty hourly chart. This is within a parallel channel which Nifty has been following since April 15th 2025. This Flag and Pole breakout will come into effect if and only if we get a closing above 24880.
In case of flag and pole breakout happening the future resistances will be near 24959, 25084 and 25157. 25157 again will be a major resistance as it will be the mid of the channel.
The supports for Nifty in case the flag and pole breakout does not take effect are at 24804 (Mother line of hourly chart) 24693, 24518 and finally 24439.
Below 24439 bears can take over the market. Above 25157 Bulls can take over the market. Shadow of the candle is effectively neutral to positive.
Disclaimer: The above information is provided for educational purpose, analysis and paper trading only. Please don't treat this as a buy or sell recommendation for the stock or index. The Techno-Funda analysis is based on data that is more than 3 months old. Supports and Resistances are determined by historic past peaks and Valley in the chart. Many other indicators and patterns like EMA, RSI, MACD, Volumes, Fibonacci, parallel channel etc. use historic data which is 3 months or older cyclical points. There is no guarantee they will work in future as markets are highly volatile and swings in prices are also due to macro and micro factors based on actions taken by the company as well as region and global events. Equity investment is subject to risks. I or my clients or family members might have positions in the stocks that we mention in our educational posts. We will not be responsible for any Profit or loss that may occur due to any financial decision taken based on any data provided in this message. Do consult your investment advisor before taking any financial decisions. Stop losses should be an important part of any investment in equity.
Review and plan for 29th May 2025 Nifty future and banknifty future analysis and intraday plan.
Quarterly results.
.
This video is for information/education purpose only. you are 100% responsible for any actions you take by reading/viewing this post.
please consult your financial advisor before taking any action.
----Vinaykumar hiremath, CMT

NIFTY 50
1. Ascending Channel:
Nifty is trending within a clear upward (ascending) channel, indicating a bullish trend as long as the price stays within this channel.
2. Support & Resistance:
There is a strong support zone in the range of 24,000–24,200, highlighted by a red-shaded area on the chart.
The current level (24,752.45) is near the middle of the channel and showing signs of minor correction.
3. Two Possible Scenarios (Arrows):
Scenario 1: From the current level, the market could move towards the upper boundary of the channel (around 25,500–26,000).
Scenario 2: There could be a short-term correction (downward movement) first, followed by a bounce from the support zone and then an upward move.
If you find this helpful and want more FREE forecasts in TradingView, Hit the 'BOOST' button
Drop some feedback in the comments below! (e.g., What did you find most useful?
How can we improve?)
Your support is appreciated!
Now, it's your turn!
Be sure to leave a comment; let us know how you see this opportunity and forecast.
Have a successful week
DISCLAIMER: I am NOT a SEBI registered advisor or a financial adviser. All the views are for educational purpose only
