Review and plan for 28th May 2025 Nifty future and banknifty future analysis and intraday plan.
Quarterly results.
This video is for information/education purpose only. you are 100% responsible for any actions you take by reading/viewing this post.
please consult your financial advisor before taking any action.
----Vinaykumar hiremath, CMT
NIFTY

Nifty feeling pressure, unable to sustain above 25K levels.Nifty not able to sustain levels above 25K is not a good news. Nifty has to sustain above 25094 level on daily and 25208 on weekly closing for further upward move. Market is not showing confidence due to daily tariff related news coming for global Power house US. So Volatility will remain for a while till everything falls in place.
Right now Nifty is resting near trend line support levels of 24731. If 24731 is broken Bears can drag Nifty towards 24469, 24067 (Mother line Support), 23899 or even 23637 (Father line support). If Nifty can sustain above 25094 then there is a possibility for up move towards 25208 or even 25446 levels. Things are delicately poised right now and proper Bear Vs Bull Tussle is going on.
Shadow of the candle is neutral to negative but any positive news on global front can change the tide in favour of Bulls.
Disclaimer: The above information is provided for educational purpose, analysis and paper trading only. Please don't treat this as a buy or sell recommendation for the stock or index. The Techno-Funda analysis is based on data that is more than 3 months old. Supports and Resistances are determined by historic past peaks and Valley in the chart. Many other indicators and patterns like EMA, RSI, MACD, Volumes, Fibonacci, parallel channel etc. use historic data which is 3 months or older cyclical points. There is no guarantee they will work in future as markets are highly volatile and swings in prices are also due to macro and micro factors based on actions taken by the company as well as region and global events. Equity investment is subject to risks. I or my clients or family members might have positions in the stocks that we mention in our educational posts. We will not be responsible for any Profit or loss that may occur due to any financial decision taken based on any data provided in this message. Do consult your investment advisor before taking any financial decisions. Stop losses should be an important part of any investment in equity.

Review and plan for 27th May 2025Nifty future and banknifty future analysis and intraday plan in kannada.
This video is for information/education purpose only. you are 100% responsible for any actions you take by reading/viewing this post.
please consult your financial advisor before taking any action.
----Vinaykumar hiremath, CMT

Nifty Trying to Forge ahead after taking Mother Line Support.Nifty is trying to move upwards after taking Mother line support. However there are strong resistances which Nifty needs to conquer in order to move ahead substantially. These resistances are near 25094 and 25208.
Closing above 25208 will confirm the current trend which can tae Nifty close to 26K with other resistances at 25446, 25649 and 25810. Supports for Nifty currently are near 24820 (Mother line support), 24469, 24356 (Father line support) and 23899.
The direction of arrow is clear for medium term unless the arrow is broken on the down side. Nifty is currently forming a positive higher highs, higher lows pattern which is again a positive sign.
Disclaimer: The above information is provided for educational purpose, analysis and paper trading only. Please don't treat this as a buy or sell recommendation for the stock or index. The Techno-Funda analysis is based on data that is more than 3 months old. Supports and Resistances are determined by historic past peaks and Valley in the chart. Many other indicators and patterns like EMA, RSI, MACD, Volumes, Fibonacci, parallel channel etc. use historic data which is 3 months or older cyclical points. There is no guarantee they will work in future as markets are highly volatile and swings in prices are also due to macro and micro factors based on actions taken by the company as well as region and global events. Equity investment is subject to risks. I or my clients or family members might have positions in the stocks that we mention in our educational posts. We will not be responsible for any Profit or loss that may occur due to any financial decision taken based on any data provided in this message. Do consult your investment advisor before taking any financial decisions. Stop losses should be an important part of any investment in equity.

NIFTYi Observed these Levels based on Price Action and Demand & Supply which is my own Concept "PENDAM CONCEPTS"... Please don't take any trades based on this chart/post... Because this chart is for educational purpose only not for Buy or Sell Recommendation... Thank Q

#NIFTY Intraday Support and Resistance Levels - 26/05/2025Today, Nifty is expected to open with a gap-up near the 24950 level. If it sustains above the 24950–25000 zone, it can lead to bullish momentum with upside targets of 25150, 25200, and 25250+. A breakout above 25000 will act as a strong confirmation for further rally.
However, if Nifty fails to sustain above 24950 and slips below the 24900–24850 zone, a short trade opportunity may emerge with downside targets at 24800 and 24750.
Further weakness will be confirmed only if it breaks below 24700, which may drag the index down to 24600, 24550, and 24500.

Review and plan for 26th May 2025 Nifty future and banknifty future analysis and intraday plan.
Quarterly results.
This video is for information/education purpose only. you are 100% responsible for any actions you take by reading/viewing this post.
please consult your financial advisor before taking any action.
----Vinaykumar hiremath, CMT

Review and plan for 23rd May 2025 Nifty future and banknifty future analysis and intraday plan.
Quarterly results
This video is for information/education purpose only. you are 100% responsible for any actions you take by reading/viewing this post.
please consult your financial advisor before taking any action.
----Vinaykumar hiremath, CMT

Nifty 50 Technical Analysis: Key Levels to Watch This Week!📈 Timeframe: Daily Chart
📍 Instrument: NSE:NIFTY
🔍 Chart Overview:
Nifty 50 has been trading in a consolidation range between and . We are now approaching a critical breakout zone that could define the next short-term trend.
🔑 Key Levels:
Immediate Resistance: 25071
Immediate Support: 24488
Breakout Above: 25071
Breakdown Below: 24488
🔔 Trading Plan:
🔼 Bullish Scenario: Wait for a breakout above 25071 with volume confirmation.
🔽 Bearish Scenario: Breakdown below 24488 may invite selling pressure.
💡 Risk Management: Use proper stop-loss below support/resistance
📌 Disclaimer:
This is for educational purposes only. Do your own research before taking any trade.
📢 Hashtags:
#Nifty50 #TradingView #ChartAnalysis #TechnicalAnalysis #NSEIndia #NiftyBreakout #PriceAction #StockMarketIndia #SwingTrade #NiftyToday

Review and plan for 22nd May 2025 Nifty future and banknifty future analysis and intraday plan.
Quarterly results.
This video is for information/education purpose only. you are 100% responsible for any actions you take by reading/viewing this post.
please consult your financial advisor before taking any action.
----Vinaykumar hiremath, CMT

Parallel Channel and other Technicals Explained on a Nifty ChartWe have tried to draw a parallel channel on Nifty hourly chart. The chart indicates that we are just below the mid channel line. The mid channel line will act as a resistance if the price is below the same and will act as a support if the price is above it. Right now it is acting as a resistance. Top of the channel always acts as a resistance and bottom of the channel always acts as a support. Additionally there are historic resistances and supports which indicate the other levels which may act as support or resistance. There are also Mother and Father lines (50 and 200 EMA)(EMA = Exponential Moving Average).
To understand in detail how parallel channel works or how supports and resistance are derived or what is Mother, Father and Small Child theory. I would recommend you my book The Happy Candles Way to Wealth creation. By reading this book you can understand all these concepts with ease. You can additionally understand what is fundamental and technical analysis and how to do it. You will also get to understand the dos and the don'ts of investment in equity by reading various chapters on Behavioural Finance. Overall it is a value for money book available on Amazon in Paperback and Kindle version. The book is also available on Google play book and other E-book stores. You can also contact us for getting the copy of it. The Happy Candles way is one of the highest rated books in the category and you can go through the reviews of the book on Amazon before purchasing it.
Based on Parallel Channel, Supports and Resistances, Mother Father and Small child theory resistances and supports of Nifty remain at.
Nifty Resistances Remain at: 24815, 24909, 24977, 25045 and 25116. The channel top resistance for the current parallel channel is around 25372.
Nifty Supports Remain at: 24780 (Mother Line Support), 24679 and 24537. The Channel Bottom support is currently around 24396. 24247 is the most important Father line support.
Shadow of the candles currently is neutral. Indicating Nifty can still go in any direction. A pennant like structure (Triangle is also formed). This indicates that Breakout or Breakdown of this triangle or pennant can take Nifty a long way on either side. Nifty is currently squeezing in the pennant with limited space. Usually when the space is limited a Breakout can happen in either direction.
Disclaimer: The above information is provided for educational purpose, analysis and paper trading only. Please don't treat this as a buy or sell recommendation for the stock or index. The Techno-Funda analysis is based on data that is more than 3 months old. Supports and Resistances are determined by historic past peaks and Valley in the chart. Many other indicators and patterns like EMA, RSI, MACD, Volumes, Fibonacci, parallel channel etc. use historic data which is 3 months or older cyclical points. There is no guarantee they will work in future as markets are highly volatile and swings in prices are also due to macro and micro factors based on actions taken by the company as well as region and global events. Equity investment is subject to risks. I or my clients or family members might have positions in the stocks that we mention in our educational posts. We will not be responsible for any Profit or loss that may occur due to any financial decision taken based on any data provided in this message. Do consult your investment advisor before taking any financial decisions. Stop losses should be an important part of any investment in equity.

Nifty 22 May StrangleSELL 25100 CE @ 38 and 24500 PE @ 30
Combined premium 68, SL 98 combined premium
playing on theda decay, should be able to book at opening bell.
Naked strangle - headge buy each side leg at 60% of sell price

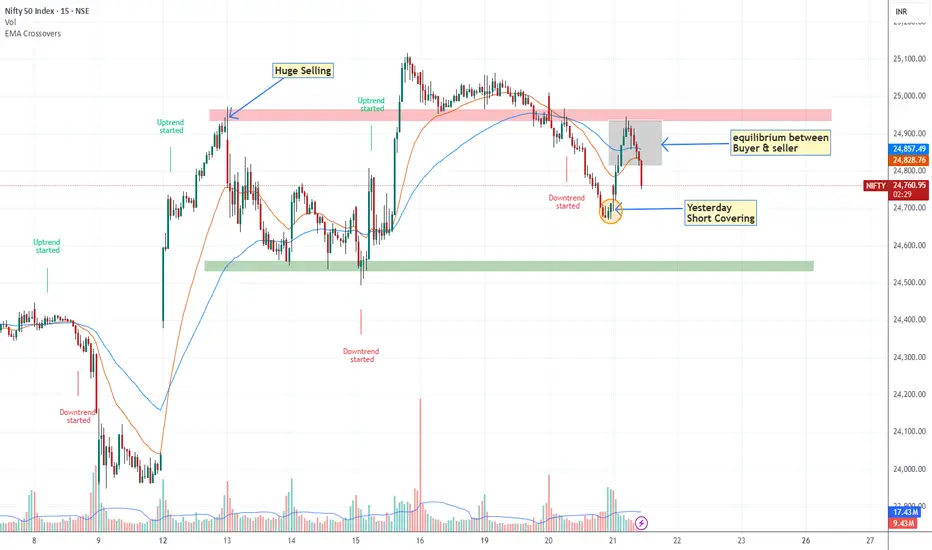
Nifty Might Range-Bound until it doesn't break 24950 levelToday 21/05/2025 around 11 O clock Nifty Tested 24950 the push was not above average volume driven that's why market was going to pullback although something absence of sellers comparatively had seen on 13 may u can see on chart but still it required to break 24950 level with good volume for being upward journey, until we expect market may range between 24500-25000.
strong Resistance- 24950-25000
Strong Support -24500
Review and plan for 21st May 2025 Nifty future and banknifty future analysis and intraday plan.
Quarterly results.
This video is for information/education purpose only. you are 100% responsible for any actions you take by reading/viewing this post.
please consult your financial advisor before taking any action.
----Vinaykumar hiremath, CMT

Multiple Resistances and Profit bookingMultiple resistances, trend line resistances are acting on Nifty and hampering it's progress. Also there is Profit booking seen across the board in all sectors. Additionally there is a new COVID scare that is spreading in China, Singapore and Hong Kong. These are the factors currently facing Nifty and not allowing it to fly above 25K levels and forcing it in downward spiral.
The resistances for Nifty remain now at: 25234, 25064, 24937, 24780, However we are entering into support zone now.
The supports for Nifty remain at: 24664, 24509, 24259, 23900 (Strong Mother line support of daily chart) and 23576 (Strong Father line support of daily chart).
To know more about importance of Father and Mother line supports and resistances read my book the Happy Candles Way to Wealth Creation. The book is available on Amazon in Paperback and Kindle Version. You can learn about Fundamental and Technical analysis from the book. The book also gives you knowledge about the art of Profit booking and novel ways of stock data analysis. Lot of reviewers consider it a hand book to investing in stock market. Everything is explained in simple jargon free language with examples of Cricket and day to day life which makes understanding of difficult investing concepts very easy. You will not regret buying the book that we can assure you.
As the multiple resistances were very strong this fall / correction / consolidation was bound to happen. As of now this should be seen as a regular market phenomenon only. Bear will become more active only if Father line support is broken. Bulls will become more active only when we get a closing above 25064. Above 25234 is a pure bull territory. Below 23576 is pure bear territory. Right now we are in no man's land.
Disclaimer: The above information is provided for educational purpose, analysis and paper trading only. Please don't treat this as a buy or sell recommendation for the stock or index. The Techno-Funda analysis is based on data that is more than 3 months old. Supports and Resistances are determined by historic past peaks and Valley in the chart. Many other indicators and patterns like EMA, RSI, MACD, Volumes, Fibonacci, parallel channel etc. use historic data which is 3 months or older cyclical points. There is no guarantee they will work in future as markets are highly volatile and swings in prices are also due to macro and micro factors based on actions taken by the company as well as region and global events. Equity investment is subject to risks. I or my clients or family members might have positions in the stocks that we mention in our educational posts. We will not be responsible for any Profit or loss that may occur due to any financial decision taken based on any data provided in this message. Do consult your investment advisor before taking any financial decisions. Stop losses should be an important part of any investment in equity.

Review and plan for 20th May 2025 Nifty future and banknifty future analysis and intraday plan.
Quarterly results.
This video is for information/education purpose only. you are 100% responsible for any actions you take by reading/viewing this post.
please consult your financial advisor before taking any action.
----Vinaykumar hiremath, CMT

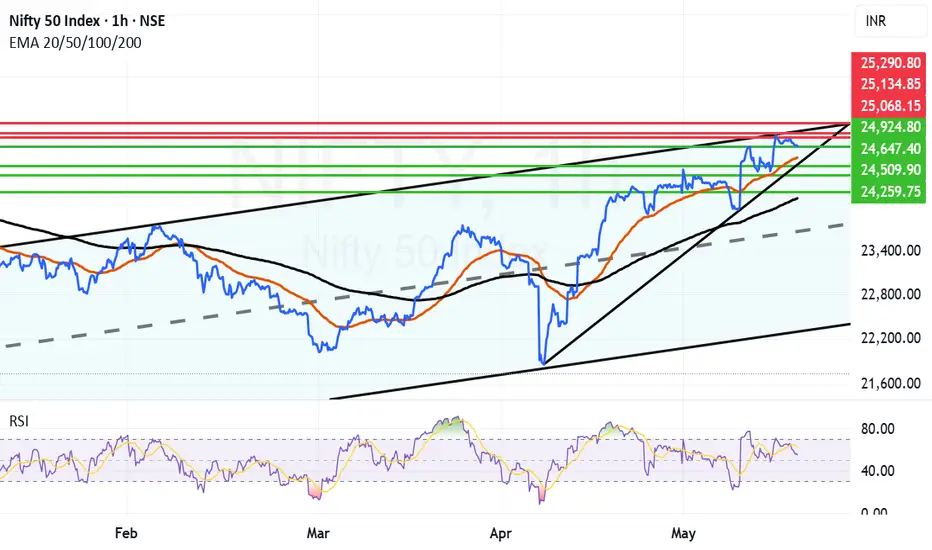
Nifty Still near the top of Parallel Channel. Nifty is consolidating near the top of the parallel channel and searching for momentum for getting a clear breakout. Till it regains the momentum and Mojo the upside looks limited. The current resistances it is facing is near 25068. Once we get a closing above the same there is possibility of some upside. In case we get a closing above 25068 the next resistances will be near 25134 and 25290. 25290 is the point above which we have a clear channel top Breakout. We will wait for that to happen for giving further resistances. The supports for Nifty are currently near 24924, 24761 (Mother Line Support of Hourly chart). If we get a closing below 24761 the bears will come back into the game and can drag the Nifty further towards the levels of 24647, 24509, 24259 or even 24162. 24162 is a Father line support of hourly chart. A closing below this levels can bring Bears in a total action mode. We will comment about further supports if by chance we get a closing below this level.
Disclaimer: The above information is provided for educational purpose, analysis and paper trading only. Please don't treat this as a buy or sell recommendation for the stock or index. The Techno-Funda analysis is based on data that is more than 3 months old. Supports and Resistances are determined by historic past peaks and Valley in the chart. Many other indicators and patterns like EMA, RSI, MACD, Volumes, Fibonacci, parallel channel etc. use historic data which is 3 months or older cyclical points. There is no guarantee they will work in future as markets are highly volatile and swings in prices are also due to macro and micro factors based on actions taken by the company as well as region and global events. Equity investment is subject to risks. I or my clients or family members might have positions in the stocks that we mention in our educational posts. We will not be responsible for any Profit or loss that may occur due to any financial decision taken based on any data provided in this message. Do consult your investment advisor before taking any financial decisions. Stop losses should be an important part of any investment in equity.
Review and plan for 19th May 2025Nifty future and banknifty future analysis and intraday plan.
Quarterly results.
This video is for information/education purpose only. you are 100% responsible for any actions you take by reading/viewing this post.
please consult your financial advisor before taking any action.
----Vinaykumar hiremath, CMT

Maruti Suzuki Chart Breakout Watch | Ascending Triangle PatternNSE:MARUTI
Maruti Suzuki is currently forming a bullish ascending triangle pattern on the 1-hour chart, indicating potential for an upside breakout.
1. Pattern Formation: The price is making higher lows while facing horizontal resistance near the 12,700 zone — forming a classic ascending triangle.
2. Support Zone: Trendline support is holding well, currently near 12,550.
3. Breakout Levels: A confirmed breakout above 12,700 could trigger a sharp move toward the next resistances at 12,888, 13,075, and possibly 13,454.
4. Bullish: Post-breakout, price action is expected to retest and then rally — as shown by the projection arrows on the chart.
5. Volume Confirmation : Watch for volume expansion on breakout to confirm strength.
Trading Plan:
Buy on Breakout : Enter long above 12,700 with targets of 12,888 - 13,075 - 13,454. Use SL below 12,550.
Wait-and-Watch : If price fails to break out, stock may stay range-bound or retest trendline support.
Conclusion:
Price action suggests strength building up. A breakout from this pattern could lead to a fresh rally — ideal setup for short-term swing trades

Review and plan for 16th May 2025 Nifty future and banknifty future analysis and intraday plan.
Quarterly results.
This video is for information/education purpose only. you are 100% responsible for any actions you take by reading/viewing this post.
please consult your financial advisor before taking any action.
----Vinaykumar hiremath, CMT

NIFTY Resumes Its Bullish TrendHello traders! Today we will talk about an Indian stock market exchange NIFTY 50, as we see nice and clean pattern from technical and Elliott wave perspective.
As you can see, NIFTY is in an impulsive bullish rise on the weekly basis, which looks like a higher degree wave 3 of an ongoing five-wave bullish impulse by Elliott wave theory.
After recent corrective slowdown in subwave (4), which perfectly tested channel support line and 38,2% Fibonacci retracement, we can now see it extending even higher, ideally for subwave (5) of a higher degree wave 3 that can push the price even up to 28k-30k area this year, just watch out on short-term pullbacks.

Major Breakout For Nifty But a Lot of Resistances Await.We saw a major Breakout for Nifty today but there are a few resistances ahead of us. Three things could happen now:
1) Nifty Rampages ahead towards 26K If the Bull Rally has real substance.
2) We might see some consolidation in this range and and after consolidating, Nifty retesting some important support the rally begins again.
3) Bears That are trapped throw a counter punch.
Scenario 1) Nifty has some resistance ahead near 25116 and 25221. We already hit 25116 and then closed at 25062. But if these 2 resistances are cleared and we get a closing above them Nifty can move swiftly towards 25352, 25453, 25662, 25882 and then regain 26K+ levels.
Scenario 2) As the Nifty has been rampaging ahead post ceasefire news there is practically need of a consolidation here. If Nifty chooses Consolidation then it may come down to test the bottom and the supports from where it can launch again remain at 24864, 24525, 24369 and then Mother and Father Line supports at 23775 and 23536 respectively.
Scenario 3) Bears who are trapped badly with the shorts can also throw a counter punch. This punch however will be effective only if we get a closing below 23536. In such a scenario Bears can pull back the Nifty towards 23942, 23401, 22805 or even 22K levels. (This however looking at the momentum looks less likely but you can never say never in stock market.)
Disclaimer: The above information is provided for educational purpose, analysis and paper trading only. Please don't treat this as a buy or sell recommendation for the stock or index. The Techno-Funda analysis is based on data that is more than 3 months old. Supports and Resistances are determined by historic past peaks and Valley in the chart. Many other indicators and patterns like EMA, RSI, MACD, Volumes, Fibonacci, parallel channel etc. use historic data which is 3 months or older cyclical points. There is no guarantee they will work in future as markets are highly volatile and swings in prices are also due to macro and micro factors based on actions taken by the company as well as region and global events. Equity investment is subject to risks. I or my clients or family members might have positions in the stocks that we mention in our educational posts. We will not be responsible for any Profit or loss that may occur due to any financial decision taken based on any data provided in this message. Do consult your investment advisor before taking any financial decisions. Stop losses should be an important part of any investment in equity.

Review and plan for 15th May 2025 Nifty future and banknifty future analysis and intraday plan.
Quarterly results.
This video is for information/education purpose only. you are 100% responsible for any actions you take by reading/viewing this post.
please consult your financial advisor before taking any action.
----Vinaykumar hiremath, CMT
