Nifty on the verge of Trendline Breakout. There is a major possibility of a Trendline Breakout amidst the rumblings on conflict with enemy nations. The main reason for Market rally today was Superb results posted by Reliance and a rally in PSU, Capital goods and defense related stocks. A lot of stocks that were oversold in the knee-jerk reaction on Friday also tried to catch-up. As the situation on the border remains tense we can have a sudden major decline as a reaction to the Geo-Political proceedings. Thus investors are asked to remains cautious and not to carry heavy derivative positions overnight. Even in the eventuality of a war actually happening one think of remaining invested in companies that can bounce back faster once the situation de-escalates.
Major Supports for Nifty on daily chart now remain at: 23988, 23708, 23415 (Major Father line support), 23325 (Major Mother Line Support) in case of Mother and Father line failing Bears can drag Nifty further down to 22875, 22142 and 21844.
Major Resistances For Nifty remain at: 24359 (Major Trend line resistance), 24538, 24816 (Is another major resistance on Fibonacci scale), If we get a closing above 24816 Nifty can easily flow towards 25183, 25399 and 25603.
Disclaimer: The above information is provided for educational purpose, analysis and paper trading only. Please don't treat this as a buy or sell recommendation for the stock or index. The Techno-Funda analysis is based on data that is more than 3 months old. Supports and Resistances are determined by historic past peaks and Valley in the chart. Many other indicators and patterns like EMA, RSI, MACD, Volumes, Fibonacci, parallel channel etc. use historic data which is 3 months or older cyclical points. There is no guarantee they will work in future as markets are highly volatile and swings in prices are also due to macro and micro factors based on actions taken by the company as well as region and global events. Equity investment is subject to risks. I or my clients or family members might have positions in the stocks that we mention in our educational posts. We will not be responsible for any Profit or loss that may occur due to any financial decision taken based on any data provided in this message. Do consult your investment advisor before taking any financial decisions. Stop losses should be an important part of any investment in equity.
NIFTY

Live buying signal in Nifty 24275Live Khareedo (Buying) signal in Nifty at 24275, lets see how long it will go up.
Note: This is not a buy/sell trade call. trade at your own will and analysis. Use stop loss.

let it be cross & sustained above 24350 leveltoday 28 April market showing strengths after little correction on Friday, yeah ofc market mode is still bullish but see BULLISH LEG 1 mention on chart below avg. traded volume not supporting price same Today BULLISH LEG 2 also have below avg. volume noticed, same you can noticed on 23 April when market was going up below avg. volume before falling , so if nifty really bullish pls let it be cross and sustained above 24350 level

Review and plan for 28th April 2025 Nifty future and banknifty future analysis and intraday plan.
Quarterly results.
This video is for information/education purpose only. you are 100% responsible for any actions you take by reading/viewing this post.
please consult your financial advisor before taking any action.
----Vinaykumar hiremath, CMT

Despite Geo-Political tensions, Nifty closes above Mother line. It was quite remarkable for Nifty to close above the Mother line (50 Hours EMA) despite the Geo-Political tensions and brewing storm of escalations at border. This shows the character of not only Indian market but the resilience of India as a nation. In yesterday's post itself we had mentioned that strong technical resistance has been reached. Add the tension and intent of India to fight against terrorism so it was a perfect recipe for a major fall. Which may happen if things escalate further next week but recovering from 23847 and to close above 24K at 24039 shows that when things will be back to normal the indices will bounce back. Resistance for Nifty now remain at 24096, 24335 and 24504. Supports for Nifty remain at 23914 (Major Mother line support) of 50 Hours EMA, 23800, 23530 and finally 23363.
While Long term players, FII, HNI and DII look at such opportunities to invest for Retail trader it becomes very difficult to control their emotions in such an environment of Geo-political pressure and then we saw a huge fall in the market. The opportunity was seized by both DII and FII with both hands as both turned net buyers for Rs.6492+ Crores. So traders / investors should always avoid knee jerk reactions. Who knows what happens during the weekend the support and resistance levels to watch out for are already mentioned in the message.
Disclaimer: The above information is provided for educational purpose, analysis and paper trading only. Please don't treat this as a buy or sell recommendation for the stock or index. The Techno-Funda analysis is based on data that is more than 3 months old. Supports and Resistances are determined by historic past peaks and Valley in the chart. Many other indicators and patterns like EMA, RSI, MACD, Volumes, Fibonacci, parallel channel etc. use historic data which is 3 months or older cyclical points. There is no guarantee they will work in future as markets are highly volatile and swings in prices are also due to macro and micro factors based on actions taken by the company as well as region and global events. Equity investment is subject to risks. I or my clients or family members might have positions in the stocks that we mention in our educational posts. We will not be responsible for any Profit or loss that may occur due to any financial decision taken based on any data provided in this message. Do consult your investment advisor before taking any financial decisions. Stop losses should be an important part of any investment in equity.
Review and plan for 25th April 2025 Nifty future and banknifty future analysis and intraday plan.
Quarterly results.
This video is for information/education purpose only. you are 100% responsible for any actions you take by reading/viewing this post.
please consult your financial advisor before taking any action.
----Vinaykumar hiremath, CMT

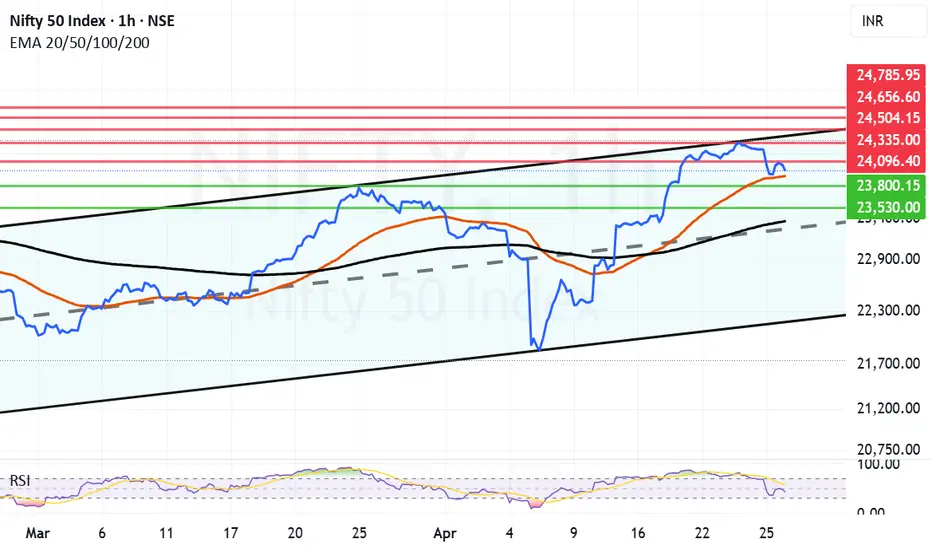
Nifty has hit a channel top with geopolitical events unravellingNifty was swiftly recovering after the Tariff war induced fall. On technical front Nifty has hit a channel top In the hourly line chart. Chanel tops are not easy to conquer and we saw Nifty retrieving today from there. Adding pressure to the rally is the Geo-Political situation after the Dastardly Pahalgam Terrorist Attack. If there is any action by India like Balakot (Swift and fast) any way it will be denied by Pakistan so nothing much will happen to Index. If there is only Political/Geopolitical long term steps taken again it will have less effect on the market. Market may decline drastically only if there is a full blown war between the 2 countries or more than 2 countries. (Possibility of that happening is less but we never know). Not much is in our hand if such a scenario arises. FIIs were seen buying big today so that is something to watchout in the coming days.
Technical Supports for Nifty remain at: 24096, 23882 (Mother Line Support), 23800 and 23316 (Father Line Support). (Mid channel support is also around 23300) so this zone presents a strong support zone.
Technical Resistances Remain at: 24335 (Major Channel Top Resistance), 24504, 24656 and 24785.
Disclaimer: The above information is provided for educational purpose, analysis and paper trading only. Please don't treat this as a buy or sell recommendation for the stock or index. The Techno-Funda analysis is based on data that is more than 3 months old. Supports and Resistances are determined by historic past peaks and Valley in the chart. Many other indicators and patterns like EMA, RSI, MACD, Volumes, Fibonacci, parallel channel etc. use historic data which is 3 months or older cyclical points. There is no guarantee they will work in future as markets are highly volatile and swings in prices are also due to macro and micro factors based on actions taken by the company as well as region and global events. Equity investment is subject to risks. I or my clients or family members might have positions in the stocks that we mention in our educational posts. We will not be responsible for any Profit or loss that may occur due to any financial decision taken based on any data provided in this message. Do consult your investment advisor before taking any financial decisions. Stop losses should be an important part of any investment in equity.

Review and plan for 24th April 2025 Nifty future and banknifty future analysis and intraday plan in kannada.
Quarterly results.
This video is for information/education purpose only. you are 100% responsible for any actions you take by reading/viewing this post.
please consult your financial advisor before taking any action.
----Vinaykumar hiremath, CMT

1/A wave done on the upside. 2/B down underway?Too early to say but NSE:NIFTY seem to have completed wave 1/A and has potentially started wave 2/B down which should hit 23400-23300 zone at the minimum, which happens to be 38.6% retracement of the rise 1/A.

INDIA WAVE B OR 2 TOP EXIT NOW !!The Chart posted is the nifty 50 India market .I am now turning Bearish As we seem to be ending my alt Wave count for wave C up in the ABC rally . We are now at HIGH RISK if this turns Down . Best of Trades WAVETIMER

Review and plan for 23rd April 2025 Nifty future and banknifty future analysis and intraday plan in kannada.
This video is for information/education purpose only. you are 100% responsible for any actions you take by reading/viewing this post.
please consult your financial advisor before taking any action.
----Vinaykumar hiremath, CMT

Nifty - moderation of +ve momentum seen on short period charts.Nifty closed with over 1% 21 VWMA was rising, Nifty respected SD+2 resistance today.
23298, 23395 resistance levels for tomorrow.
SD+1 or 23057 acted as major support today, any breach below this and sustaining lower will signal some weakness.
23730 major pivot, as long as this is help, uptrend is intact, and Nifty is in buy on dips.
24060, 23930, 23875, 23790, 23760 major support levels.

Review and plan for 22nd April 2025 Nifty future and banknifty future analysis and intraday plan in kannada.
This video is for information/education purpose only. you are 100% responsible for any actions you take by reading/viewing this post.
please consult your financial advisor before taking any action.
----Vinaykumar hiremath, CMT

Nifty - Ready to ride to 30k?Alright guys, I’ve been getting this a lot — ‘What’s up with Nifty 50- Though am a pure crypto guy but onto the request i would analyse the index, and i feel its very bullish! And i searched some problem is there if someone analyse it - Its just a educational chart!! So the alleged doesnt disturb me lol.
This is a market profile
After a sharp correction earlier in April, the index formed a base with tightly packed POCs and balanced value areas between 22,400–23,400 levels. This region acted as a strong accumulation zone. Post that, a sharp breakout above the previous VAH (Value Area High) occurred, and price has now cleanly auctioned above 24,000. What’s impressive is the most recent structure: the POC, VAL, and VAH have all shifted higher in alignment, suggesting that acceptance at higher prices is taking place. The current POC at around 24,100 further validates that market participants are comfortable building volume at elevated levels. Unless we fall back below 23,800–23,900 (which is now a key demand zone), Nifty 50 is showing strength and could attempt the 24,400–24,600 range in the upcoming sessions.

Another remarkable leap by Nifty. Channel top approaching. Nifty gained some serious ground again today closing 273.9 points up from previous close. The zone between 24202 and 24479 is the zone which stand between full blown Bull rally and some consolidation. The regressing parallel channel which started after Nifty made a high 26277 can be overcome if we get a closing above 24366. Immediate resistance is near 24202 before we reach there. Once we get a weekly closing above 24479 Bulls will take total control of the market. In such a scenario the Nifty can find resistance near 24830 before it can regain 25K levels.
If Nifty fails to conquer 24202, 24366 or 24479 then the supports will be near 23786. Bears can come back in picture if we get a closing above 23786. In such a scenario Mother and Father lines of hourly chart will play the supporting role at 23411 and 23101. Again near 23101 in addition to the Father line there is also Mid-Channel support thus this level should be considered a major support zone.
Since RSI of hourly chart is above 80 there is a chance of slight correction and consolidation which should also be looked at while taking fresh positions. RSI above 80 indicates that the positions might be just slightly be in the overbought zone.
Disclaimer: The above information is provided for educational purpose, analysis and paper trading only. Please don't treat this as a buy or sell recommendation for the stock or index. The Techno-Funda analysis is based on data that is more than 3 months old. Supports and Resistances are determined by historic past peaks and Valley in the chart. Many other indicators and patterns like EMA, RSI, MACD, Volumes, Fibonacci, parallel channel etc. use historic data which is 3 months or older cyclical points. There is no guarantee they will work in future as markets are highly volatile and swings in prices are also due to macro and micro factors based on actions taken by the company as well as region and global events. Equity investment is subject to risks. I or my clients or family members might have positions in the stocks that we mention in our educational posts. We will not be responsible for any Profit or loss that may occur due to any financial decision taken based on any data provided in this message. Do consult your investment advisor before taking any financial decisions. Stop losses should be an important part of any investment in equity.

Nifty Weekly Wrap – 3rd Week of April ’25📉📈 Nifty Weekly Wrap – 3rd Week of April ’25 🔍
Bulls Charge Ahead – A 1,000+ Point Weekly Rally!
📌 Market Recap
What a week! Nifty 50 delivered a massive +1023 point gain – up 4.4% on a weekly closing basis – breaching the crucial 23,800 level and closing strong.
The rally was powered by a duo of positive triggers:
✅ Tariff relief
✅ Cooling inflation
This combination boosted sentiment and attracted strong institutional buying across the board.
📊 Technical Overview
Weekly & Monthly Candles: Bullish ✅
PCR Ratio: At 1.15, signaling a bullish tilt
RSI: Holding steady at 54 – trend and momentum both aligned
200 SMA on Daily Chart: At 24,050 – a crucial level to watch.
🔼 A breakout and close above this may trigger fresh buying and a possible shift in long-term sentiment.
📌 Bank Nifty Leadership
Bank Nifty almost hit its all-time high, clearly outperforming Nifty this week.
The rally wasn’t limited to just PSU or private players – both segments showed strong participation, giving more legs to this uptrend.
📍 Key Bank Nifty Level:
➡️ As long as 52,000 holds, the uptrend structure remains intact.
📉 Volatility Update – India VIX
India VIX cooled off by a sharp 24%, settling near 15 – further reinforcing the low fear + high confidence mood in the market.
📌 Market Sentiment Snapshot
Everything is aligning for the bulls:
✅ Sectoral rotation
✅ Robust earnings
✅ Institutional buying
✅ Easing macro concerns
🎯 Momentum is real, and as long as levels hold, dips might continue to be bought.
📌 Key Levels to Watch (Nifty)
🔼 Resistance Zones
▶️ 24,050 (200 SMA – critical level)
▶️ 24,190 ~ 24,225
▶️ 24,450
🔽 Support Zones
▶️ 23,820
▶️ 23,660 ~ 23,710
▶️ 23,400
▶️ 23,200
📋 Strategy Heading into Next Week
🧘 Stay with the trend, but don’t get complacent.
📌 Watch for a clean breakout above 24,050 with volume – it could set the tone for a fresh leg higher.
📌 On the downside, 23,660–23,820 is a key demand zone to track.
Let the structure develop – no need to predict every move. Follow price, stay flexible.

Review and plan for 21st April 2025Nifty future and banknifty future analysis and intraday plan in kannada.
Quarterly results.
This video is for information/education purpose only. you are 100% responsible for any actions you take by reading/viewing this post.
please consult your financial advisor before taking any action.
----Vinaykumar hiremath, CMT

Trading Mindset
I Am a Software Developer and a Passionate Trader
Over the past five years, I have explored nearly every aspect of trading—technical analysis, intraday trading, MTF, pre-IPO investments, options selling, F&O, hedging, swing trading, long-term investing, and even commodities like gold and crude oil.
Through this journey, I realized that **technical analysis is only about 20% of the equation**. The real game is **psychology and mindset**.
I have distilled my learnings into concise points below—insights that have shaped my approach and will continue to guide me in my version 2.0 of trading. I hope they prove valuable to you as well.
---
### **Position Sizing**
One of the most important aspects of trading is choosing the right position size. Your trade should never be so large that it causes stress or worry. Keep it at a level where you can stay calm, no matter how the market moves.
### **Set Stop-Loss and Target Before Placing a Trade**
Decide in advance when you will exit a trade—both at a loss (**stop-loss**) and at a profit (**target**). This helps maintain emotional balance, preventing extreme excitement or frustration.
### **How to Calculate Position Size**
- Use **technical analysis** to identify your **stop-loss** and **target**.
- Example: If CMP is ₹100 and your stop-loss is at ₹94 (₹6 risk per share), determine your risk tolerance:
- ₹3,000 risk ➝ **500 shares** (₹3,000 ÷ ₹6)
- ₹1,200 risk ➝ **200 shares** (₹1,200 ÷ ₹6)
- Adjust quantity based on how much you're willing to risk.
### **Setting Target Price & Risk-Reward Ratio**
The most important factor in setting a target is the **risk-reward ratio**. If your stop-loss is ₹6, your target should be at least **₹6, ₹9, or ₹12**.
### **Why Is Risk-Reward Important?**
Let’s say you take **10 trades**—5 go in your favor, and 5 go against you. If your risk-reward ratio isn’t favorable, you could end up in a loss.
Example:
- You **lose ₹6** in two trades → ₹12 total loss
- You **gain ₹3** in three trades → ₹9 total profit
- **Net result: -₹3 loss**
To ensure profitability, your **reward should be equal to or greater than your risk**. A **1.5x or 2x risk-reward ratio** is ideal.
### **Flexibility in Targets**
Even when the price reaches **Target 1**, you can **book partial profits** and let the rest run with a **trailing stop-loss**.
---
### **Managing Multiple Trades**
This is **very important**. If you're a beginner, **limit yourself to 2 trades**, and even if you're a pro, **avoid more than 3-5 positions**.
**Example:** If you have **₹2 lakh**, make sure you have **only 2 trades open at a time**. Add a third stock **only when you close another position**.
---
### **How to Deploy Capital**
Patience is key. If you have **₹1 lakh**, **divide it into 4-5 parts** and buy **in small chunks over time**.
**Why?**
The **nature of stocks** is to move in waves—rising, facing profit booking, then breaking previous highs. Instead of investing everything at once, **buy in staggered amounts** to ensure your **average price stays close to CMP**.
---
### **Avoid Market Noise**
When trading, **stay in your zone**.
Social media posts can make you feel **slow compared to others**, but they don't show the full picture. Avoid distractions like:
- Direct stock tips from **news channels**
- P&L snapshots from traders
- Following too many **analysts on social media**
Instead, **listen to expert views**, but stay disciplined with **your own strategy**.
---
### **Stock Selection**
Stock selection has **two elements—technical and fundamental** (I'll write a separate post on this).
Always **buy a stock that you can hold even in your darkest times**.
**Example:**
- Choose **blue-chip stocks** with **high market caps & strong promoter holdings**
- Never **buy a stock just because it’s in momentum**
- If a stock **turns into a forced SIP**, it’s not a good buy
Pick stocks with **a long-term story**—even if you fail to exit at the right time, you should be comfortable holding them.
---
### **Accept That It’s the Market, Not You**
Many traders fail because they **don’t admit that the market is unpredictable**.
Losses happen because of volatility, not necessarily poor strategy. **Example:**
- You lose a trade and **try improving your method** but face another hit
- Some losses **are simply beyond your control**
Most of what happens in the market is **not in your hands**—including stop-loss triggers. **Accept this reality,** and focus on **risk management** instead of revenge trading.
---
### **Keep Separate Trading & Investment Accounts**
Trading and investing **are different**. If you keep them **in the same account**, you’ll:
- **Book small profits** on investments
- **Hold short-term trades in losses**
Having **separate accounts** keeps **your goals clear**.
---
### **Don’t Let the Market Dominate You**
Even full-time traders **shouldn’t obsess over the market**.
Limit your **screen time to 2-3 hours during market hours**.
**Why?**
- You can’t **act on global markets until 9:15 AM IST**
- Even if a **war or tariff issue** arises, **you can’t do anything until market open**
- Overthinking leads to **over-trading**, which drains money
Instead, **invest time in developing new skills**.
---
### **Do What Suits You, Not Others**
If you're good at **swings, stick to swings**. If you're good at **intraday, do intraday**.
Don't follow **what works for a friend—trade based on what suits you**.
---
### **Avoid FOMO**
Don't **stress** if a stock jumps **20% in a day**.
Stock **accumulation zones, demand/supply areas, profit booking**, and **retests** happen **regularly**—opportunities will always come.
Even traders who claim they made **20% in a day** **don’t share how often they got trapped chasing stocks**.
---
### **Stop-Loss Is Your Best Friend**
No, stop-loss is your **best friend for life**.
**Example:**
- Suppose you **enter 10 trades in a month**.
- **6 do well** and you book profits.
- **4 go against you**, but instead of exiting, **you hold** because you believe they’ll recover.
- Next month, you **repeat this cycle**—adding more positions.
Over time, **this builds a portfolio of lagging stocks**, and suddenly, **your losses dominate your portfolio**.
---
Even Experts Face Losses
Even professionals with **advanced research teams lose money**.
Retail traders often **believe they can avoid losses by analyzing a few ratios**, but **losses are part of trading**.
A stop-loss ensures **you stay in the game long-term**—instead of holding onto losing trades indefinitely.
---
Take a Break & Restart
Taking breaks is **crucial**. If everything is going wrong, **don’t hesitate to press the reset button**—step back, analyze, and refine your approach. A fresh mindset leads to better trading decisions. (I’ll write a detailed post on this soon.)

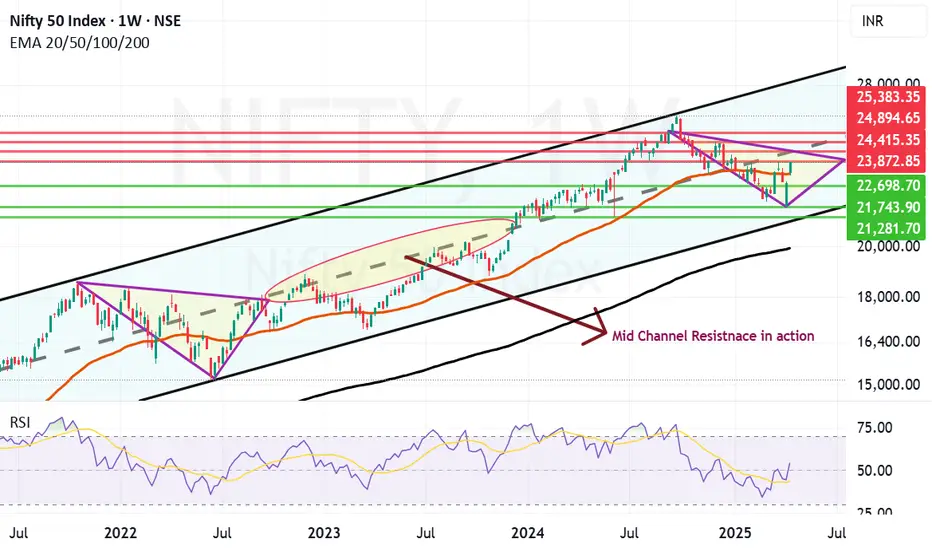
Nifty Parallel Channel and how things are shaping up. Nifty has closed strongly above the Mother line of Weekly chart this week. This should be considered a solid come back by Indian markets after the Trump Tariff induced fall. Indian economy is showing it's capability to bounce back on the back of strong rally in most of the sectors other than IT. Uncertainty in IT still looms as below par results that have started coming for might TCS and INfosys. We have a long weekend and uncertainties due to various announcements by global leaders regarding Tariffs can still spoil the party so one needs to be cautious in carrying huge positions over night and over the week especially in F&O trades.
Nifty travelling in a Parallel channel depicted above since 2020 is just below its Mid channel resistance at 24415. If you want to see the power of Mid Channel resistnace look at how it stopped Nifty between August 22 to December 23 below it. So Mid-channel resistnace should never be taken lightly. The area is depicted in the chart for your better understanding. Even before we reach that point of major resistance, Nifty has to counter strong resistance which was high of today and this week at 23872. Closing above 24415 can enable and empower Bulls to further push Nifty towards 24894, 25K and 25383 levels if the rally continues.
To know more about Parallel channel and how this Technical tool can be used to create wealth in stock market , you need to read my book The Happy Candles Way To Wealth creation. It is a highly rated book have a look at various reviews of the readers on Amazon. Both paperback and Kindle versions of the same are available on Amazon.
Nifty supports in case it is not able to cross and close above the resistnace zone of 23872 and 24415 will be 23272 (Strong Mother Line Weekly Support or 50 Weeks EMA) and 22698. A closing below 22698 in case of some adverse news or global development can empower the bears and can have potential to drag Nifty towards recent low of 21743 or 52 week low of 21281.
As of now things looking good but we have to wait and see the global and local developments over the weekend.
Disclaimer: The above information is provided for educational purpose, analysis and paper trading only. Please don't treat this as a buy or sell recommendation for the stock or index. The Techno-Funda analysis is based on data that is more than 3 months old. Supports and Resistances are determined by historic past peaks and Valley in the chart. Many other indicators and patterns like EMA, RSI, MACD, Volumes, Fibonacci, parallel channel etc. use historic data which is 3 months or older cyclical points. There is no guarantee they will work in future as markets are highly volatile and swings in prices are also due to macro and micro factors based on actions taken by the company as well as region and global events. Equity investment is subject to risks. I or my clients or family members might have positions in the stocks that we mention in our educational posts. We will not be responsible for any Profit or loss that may occur due to any financial decision taken based on any data provided in this message. Do consult your investment advisor before taking any financial decisions. Stop losses should be an important part of any investment in equity.
Nifty important FIbonacci levels from Previous year closeNIfty important FIbonacci levels from previous year close.
Todays closing was above previous year close.
Previously failed to break previous year close. Lets see what happens.

NIFTY 50 4hr analysis (bullish) (16/04/2025)Welcome back folks
havent been posting lately because of the hectic schedule,
the analysis is based majorly on the current emotions of the speculators that is relief bullish rally
- possible gap up tomorrow, if market makers decide to book profits tomorrow then its blood bath again imo
- either a follow up range or breakout above marked figures in the chart is expected
- i personally believe to not overthink this and be a part of the crowd and hope for the latter
trade cautiously, i wont be posting index charts anytime soon now, only stocks if schedule allows me
feel free to chat with me in the comments

Review and plan for 17th April 2025Nifty future and banknifty future analysis and intraday plan in kannada.
Result stocks, swing ideas.
This video is for information/education purpose only. you are 100% responsible for any actions you take by reading/viewing this post.
please consult your financial advisor before taking any action.
----Vinaykumar hiremath, CMT

Nifty near the trendline resistance now after another good day.Nifty has cleared the 200 days EMA or the Father line on Daily chart. But in the hourly chart depicted here has hit a resistance zone which happens to be a trend line resistance.
RSI of Nifty is currently above 73 and the scope for upside is there but limited. With a shortened week tomorrow we will have a weekly closing. So a positive closing tomorrow can place us in a good space for a next week. However with everchanging trade war scenario it is difficult to guess if investors will encash their long positions or carry them forward into the next week.
The next resistances for Nifty remain at 23456, 23621, 23713, 23784 and 23915 before Nifty regains 24K levels. The support zones for Nifty remain at 23292, 23156, (Mother and Father lines of hourly chart are close by near) 23017 and 22980. So this zone will be a strong support. A closing below 22980 can drag Nifty down towards 22771 or even 22361 region.
Also one must keep an eye on Reliance result tomorrow. As it is a index power house it can single handedly make or break the weekly closing. Flat or positive closing tomorrow will be very helpful for the bull run to continue.
Disclaimer:The above information is provided for educational purpose, analysis and paper trading only. Please don't treat this as a buy or sell recommendation for the stock or index. The Techno-Funda analysis is based on data that is more than 3 months old. Supports and Resistances are determined by historic past peaks and Valley in the chart. Many other indicators and patterns like EMA, RSI, MACD, Volumes, Fibonacci, parallel channel etc. use historic data which is 3 months or older cyclical points. There is no guarantee they will work in future as markets are highly volatile and swings in prices are also due to macro and micro factors based on actions taken by the company as well as region and global events. Equity investment is subject to risks. I or my clients or family members might have positions in the stocks that we mention in our educational posts. We will not be responsible for any Profit or loss that may occur due to any financial decision taken based on any data provided in this message. Do consult your investment advisor before taking any financial decisions. Stop losses should be an important part of any investment in equity.
