Review and plan for 1st April 2025Nifty future and banknifty future analysis and intraday plan in kannada.
This video is for information/education purpose only. you are 100% responsible for any actions you take by reading/viewing this post.
please consult your financial advisor before taking any action.
----Vinaykumar hiremath, CMT
NIFTY

Review and plan for 28th March 2025Nifty future and banknifty future analysis and intraday plan in kannada.
This video is for information/education purpose only. you are 100% responsible for any actions you take by reading/viewing this post.
please consult your financial advisor before taking any action.
----Vinaykumar hiremath, CMT

Nifty finds a support just above Mother line and Mid-channel.Nifty has today found a good support just above Mother line of the hourly chart and Mid-channel support zone as it bounced from lows of the day near 23412 to close at 23591. Tomorrow being the weekly closing, monthly closing and financial yearly closing it become very important or one of the most important days for investment enthusiasts. A positive closing tomorrow will empower bulls in a lot of ways.
The first support for Nifty will be at 23550. A very strong support zone for Nifty right now remains between 23412 and 23380. This zone includes today's low, mid channel support and mother line support. A closing below 23380 will bring bears back into action who can potentially drag Nifty again to 23145, 23003 or levels below 22801.
Resistance zone for Nifty remains at 23646 today's high, 23670, 23778 and 23900. A closing above 23900 will empower bulls to take Nifty to higher levels of 24046, 24169 or 24378.
As described earlier very important day tomorrow with shadow of the candle being neutral to positive.
Disclaimer:
The above information is provided for educational purpose, analysis and paper trading only. Please don't treat this as a buy or sell recommendation for the stock or index. The Techno-Funda analysis is based on data that is more than 3 months old. Supports and Resistances are determined by historic past peaks and Valley in the chart. Many other indicators and patterns like EMA, RSI, MACD, Volumes, Fibonacci, parallel channel etc. use historic data which is 3 months or older cyclical points. There is no guarantee they will work in future as markets are highly volatile and swings in prices are also due to macro and micro factors based on actions taken by the company as well as region and global events. Equity investment is subject to risks. I or my clients or family members might have positions in the stocks that we mention in our educational posts. We will not be responsible for any Profit or loss that may occur due to any financial decision taken based on any data provided in this message. Do consult your investment advisor before taking any financial decisions. Stop losses should be an important part of any investment in equity.

Review and plan for 27th March 2025Nifty future and banknifty future analysis and intraday plan.
This video is for information/education purpose only. you are 100% responsible for any actions you take by reading/viewing this post.
please consult your financial advisor before taking any action.
----Vinaykumar hiremath, CMT

Nifty Coming back to test its supports.After a proper breakout and a rally which stretched above 1900 points from the March 4 lows, Nifty was clearly overbought on the hourly chart. It might be coming down for one or more of the following reasons:
1) Retesting support from where it can launch fresh move.
2) Correcting the RSI which had gone into the overbought zone.
3) Pressure due to upcoming Monthly and Financial year closing approaching on 28th March 2025.
3) The rally might have fizzled out.
4) Tax harvesting being done by retail investors.
5) Pressure due to upcoming Monthly and Financial
The first 4 options seem to be more likely of the 5 points mentioned above. FII was again on the buying side today so DII and Retail were the major selling parties.
Nifty Supports currently remain at:
1) Strong support zone of 23398 and 23309 (Hourly Mother Line support). This zone also includes the formidable mid channel support.
2) Next support is at 23145.
3) The next critical support for the rally remains at (Father line of the hourly chart) which is at 22959.
4) Final support for the rally will be at Channel bottom which is at 22801.
Nifty Resistance currently are at:
1) 23602 which is now a resistance.
2) 23749 a formidable resistance.
3) Recent rally top at 23869.
4) The zone between 24071 and 24267. (The areas that can be new channel top).
If you want to learn more about Mother, Father and the Small child theory designed by me about the stock market, Parallel Channels, charts, Candlestick analytics, Fundamental analysis, Mother and Father line importance, How to book profits, how to find a balance between Technical and fundamental analysis through Happy Candles Numbers, understand Behavioral Finance and other interesting topics by learning which you can make your money work harder you should read my book THE HAPPY CANDLES WAY TO WEALTH CREATION which is available on Amazon in paperback and kindle version. E-version of the same is available on Google Play Books too.
More volatility can be expected int the next 2 days due to ongoing Ukraine-US-Russia announcements, Financial year expiry and Trump Tarif updates. Trade with caution.
Disclaimer: The above information is provided for educational purpose, analysis and paper trading only. Please don't treat this as a buy or sell recommendation for the stock. We do not guarantee any success in highly volatile market or otherwise. Stock market investment is subject to market risks which include global and regional risks. We will not be responsible for any Profit or loss that may occur due to any financial decision taken based on any data provided in this message.

levels to watch out In my post from last year, I highlighted the potential for a market top and a correction in both the index and most of the Nifty50 stocks.
My initial target was around 21,800, which the market hit as expected, and we also saw a bounce from those levels, just as I predicted. However, if those levels are breached, the decline could accelerate, bringing the market down to 19,000.
I closed my short positions around those levels and will look to re-enter shorts. A break and sustained close above 24,150 would signal the end of this correction, possibly pushing the market to new highs in the coming weeks.

Review and plan for 26th March 2025Nifty future and banknifty future analysis and intraday plan.
This video is for information/education purpose only. you are 100% responsible for any actions you take by reading/viewing this post.
please consult your financial advisor before taking any action.
----Vinaykumar hiremath, CMT

Good Trendline Breakout Candle by Nifty. Nifty has given a good break out above Father line (200 Days EMA) at 23399 and Long term trend line. This shows that Bulls have made a comeback and are out of Coma. However Bears can try to disrupt things later in the week. Important resistance zone of Nifty now is between 23708 and 23830. Crossing and closing above 23830 has potential for the rally to inch upwards towards next resistance levels at 24030 and 24215.
The supports for Nifty now remain at 23399, 23109 and 23036. The sectors that are driving the rally are Banking (Both Private and Public sector), Finance, Public Sector Industries. Midcap, Smallcap, Infra, Pharma, Consumer Goods and some other sectors are also trying to catch up. Overall it has been a V shaped recovery. This week's closing will decide if the rally can turn out into full blown Bull run or not. Signs are ominous.
Predicting exact top and exact bottom remains illusive. When People were calling for Doomsday scenario and 20K, 19K levels we have seen Nifty rising 1694 points from 4th March Low of 21964.
Disclaimer: The above information is provided for educational purpose, analysis and paper trading only. Please don't treat this as a buy or sell recommendation for the stock. No one can guarantee any success in highly volatile market or otherwise. There is also chance of bias in our opinion. The supports and resistances indicated are based on data which has a cycle time of being 3 months or older so it is not necessary that it will work. The author or Smart Investment will not be responsible for any Profit or loss that may occur due to any financial decision taken based on any data provided in this message.

NIFTY READY FOR CORRECTION: BOOK PROFITSCRIPT: NIFTY CURRENT CONTINIOUS FUTURS
Timeframe: Daily
Important Support and Resistance Zones:
Resistance Zone: 23,170 - 23,240 = 70 points (supply zone)
Support Zone: 22,910 - 22,825 = 85 points (Demand Zone)
Today's High: 23,232.60
RSI: 59.08
As per past data, we can observe, price has corrected from mentioned supply zone and importantly when RSI has reached 60 mark on daily timeframe.
Here, there are several factors joining hands to correct Nifty in coming days.
1) Nifty reaching its supply zone
2) RSI near to mark 60
3) Past 4 days Nifty is rising continuous
Takeaway:
Yesterday's Close: 22972.95
Today's Close: 23,191.00
Difference: 259.65
Half the Difference: (259.65/2 = 109.025)
Subtracting from Today's Close: 23191.00 - 109.025 = 23081.975
Now, If price crosses this level in coming days, we can expect further fall in Nifty.
Target Condition: Price must cross 23,081 level in coming couple of days. If so,
Target Price: We will see further correction in Nifty till our Support Zone which is at
22,910.00 - 22,825.00
Expected Time: Approximately 7 to 12 Days from today.

Review and plan for 26th March 2025Nifty future and banknifty future analysis and intraday plan.
This video is for information/education purpose only. you are 100% responsible for any actions you take by reading/viewing this post.
please consult your financial advisor before taking any action.
----Vinaykumar hiremath, CMT

Review and plan for 24th March 2025 Nifty future and banknifty future analysis and intraday plan.
Few stocks analysed.
This video is for information/education purpose only. you are 100% responsible for any actions you take by reading/viewing this post.
please consult your financial advisor before taking any action.
----Vinaykumar hiremath, CMT

Nifty 50 at the Monthly SR RANGE.Nifty 50 at the Monthly SR RANGE.
If it breaks the 18100 range then we may see a downfall for some time.

Solid Comeback by Nifty on Weekly Chart. 1 hurdle remaining. Nifty made a solid comeback gaining 4.26% this week. One major hurdle remaining which is 23403. If Nifty can close above this level the next resistances will be at 23809, 24030, 24215, 24443, 24667 and 24873 before Nifty can regain 25K levels. The supports for Nifty on the lower side if it is not able to cross the major hurdle at 23403 will be 23109, 22789, 22334 and 21974. As of now the Bulls have done well turning the shadow of the candle positive for the next week.
However there is also a small possibility of 23403 becoming Achilles heel for the rampant Bulls. Weekly RSI is at 48.89 which means it has entered the bullish territory. MACD or the Moving Average Convergence and Divergence has not fully moved into the Bullish territory but it has certainly taken the turn towards the convergence.
So overall it was a great week for bulls after a long time but one final hurdle of the Bear 'Chakravyuh' remains to be conquered.
Disclaimer: The above information is provided for educational purpose, analysis and paper trading only. Please don't treat this as a buy or sell recommendation for the stock or index. The Techno-Funda analysis is based on data that is more than 3 months old. Supports and Resistances are determined by historic past peaks and Valley in the chart. Many other indicators and patterns like EMA, RSI, MACD, Volumes, Fibonacci, parallel channel etc. use historic data which is 3 months or older cyclical points. There is no guarantee they will work in future as markets are highly volatile and swings in prices are also due to macro and micro factors based on actions taken by the company as well as region and global events. Equity investment is subject to risks. I or my clients or family members might have positions in the stocks that we mention in our educational posts. We will not be responsible for any Profit or loss that may occur due to any financial decision taken based on any data provided in this message. Do consult your investment advisor before taking any financial decisions. Stop losses should be an important part of any investment in equity.

Review and plan for 21st March 2025 Nifty future and banknifty future analysis and intraday plan.
Few stocks analysed.
This video is for information/education purpose only. you are 100% responsible for any actions you take by reading/viewing this post.
please consult your financial advisor before taking any action.
----Vinaykumar hiremath, CMT

NIFTY Trading Levels and Plan for 21-Mar-2025📅 NIFTY Trading Plan – 21-Mar-2025
📍 Reference Price: 23,190 (Close on 20-Mar-2025)
📊 Chart Structure: Price is nearing exhaustion at highs, so we need to observe for either continuation or reversal from resistance zones.
📌 Opening Scenario 1: GAP-UP Opening (100+ Points)
🟢 Expected Open Zone: 23,270 – 23,330
👉 If Nifty opens with a strong gap-up above 23,270: Watch for price action near 23,345 , marked as the last strong intraday resistance . If you see rejection (like wick rejections or bearish engulfing on 5m/15m), consider initiating short positions with a stop loss above 23,370. On clean breakout and sustained move above 23,345, target the Profit Booking Zone: 23,407–23,445+ . Be cautious chasing longs on a gap-up unless price consolidates and confirms breakout.
🎯 Key Tip: Don't short just because it's a gap-up. Let the candle give confirmation through rejection patterns.
📌 Opening Scenario 2: FLAT Opening
🟠 Expected Open Zone: 23,150 – 23,190
👉 In case of flat to mild gap open: Watch 23,185 as the immediate Opening Resistance / Support .
If price sustains above 23,185 with strength, you can look for a long entry targeting 23,345 and beyond.
However, if price struggles and fails to cross 23,185 with rejection patterns, short toward 23,068 and 22,994.
Breakdown below 23,068 may accelerate profit booking till the lower zone of 22,994–22,882.
🎯 Key Tip: The first 15–30 mins are crucial. Avoid rushing into trades. Use the breakout-retest model for safer entries.
📌 Opening Scenario 3: GAP-DOWN Opening (100+ Points)
🔻 Expected Open Zone: 23,050 – 22,950
👉 If Nifty opens with a significant gap-down: Observe price action near Opening Support Zone: 23,068 – 22,994 .
If bulls defend this zone with strong reversal patterns (hammer, bullish engulfing), it could be a dip-buying opportunity. Below 22,994, next major support lies at 22,882 . Breakdown of this zone could trigger sharp fall. Avoid shorting after a gap-down unless 22,882 breaks convincingly.
🎯 Key Tip: Never knife-catch a falling market. Let the base build before entering reversal trades.
🛡 Risk Management Tips for Options Traders 🧠 Use defined risk trades: Prefer vertical spreads (bull call/bear put) instead of naked options. Avoid buying OTM options post 11:00 AM unless momentum is strong. Always risk less than 2% of your capital per trade. Trail your stop loss once the trade moves in favor to protect capital. Don't overtrade – quality setups > quantity.
✅ Summary & Conclusion:
📍 Nifty is trading near crucial resistance levels.
📍 23,345 remains the make-or-break zone for bulls.
📍 Support zones: 23,068 → 22,994 → 22,882
📍 React to price action at key zones rather than predicting it.
📍 Let the first 15–30 minutes settle before jumping into trades for optimal RR setups.
⚠️ Disclaimer:
I am not a SEBI-registered analyst . This trading plan is shared for educational purposes only. Please consult your financial advisor before taking any trades based on this plan. Risk wisely and trade with discipline. 🙏

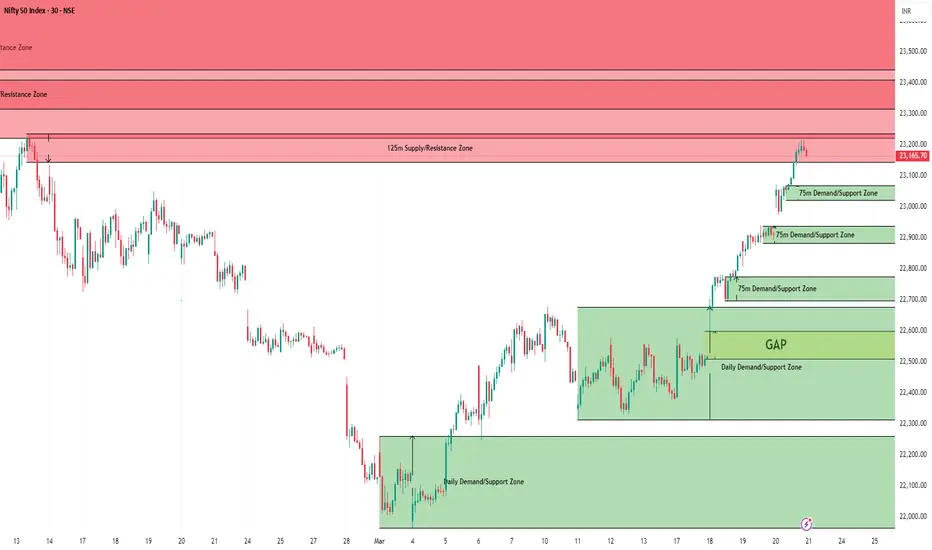
Nifty Intraday Support & Resistance Levels for 21.03.2025🔎 Market Recap:
On Thursday, Nifty opened gap-up, dipped to a low of 22,973.95, and surged to a high of 23,216.70, entering the 125m Supply Zone (23,144.05 - 23,235.50). It closed strong at 23,190.65, gaining 283 points from the previous close.
📉 Trend Analysis:
Weekly Trend (50 SMA): Negative
Daily Trend (50 SMA): Sideways
📉 Demand/Support Zones:
Near Demand/Support Zone (75m): 23,021.60 - 23,068.25
Far Demand/Support Zone (75m): 22,882.80 - 22,937.70
Far Demand/Support Zone (75m): 22,697.75 - 22,774.35
Far Demand/Support Zone (Daily): 22,314.70 - 22,676.75
Far Demand/Support Zone (Daily): 21,964.60 - 22,261.55
Far Support: 21,281.45 (Low of 4th June 2024)
Far Demand/Support Zone (Daily): 20,769.50 - 20,950.00
📈 Supply/Resistance Zones:
Near Supply/Resistance Zone (125m): 23,144.05 - 23,235.50 (Tested)
Near Supply/Resistance Zone (Weekly): 23,222 - 23,807.30
Far Supply/Resistance Zone (125m): 23,316.30 - 23,409.65 (Inside Weekly Supply)
Far Supply/Resistance Zone (Daily): 23,443.20 - 23,807.30 (Inside Weekly Supply)
Far Supply/Resistance Zone (Daily): 23,976 - 24,196.45
Far Supply/Resistance Zone (Daily): 24,601.75 - 24,781.25
📊 Outlook & Strategy:
Nifty continued its bullish momentum, respecting lower demand zones and pushing higher into the 125m Supply Zone.
🔹 Short-term Trend: Bullish but overbought
🔹 Key Watch: If Nifty sustains above 23,144, we could see an extension towards 23,443 - 23,807 in the coming sessions. However, profit booking is possible from these supply zones.
🔹 Caution: 23,222 - 23,807 (Weekly Supply Zone) could act as a strong resistance, leading to a pullback towards 23,021 - 22,882 if rejection is observed.
📢 Disclaimer:
This analysis is for educational and informational purposes only and should not be considered as financial advice. Trading and investing in the stock market involve risk, and past performance does not guarantee future results. Always conduct your own research and consult with a certified financial advisor before making any trading decisions. The author is not responsible for any financial losses incurred based on this analysis.
Review and plan for 20th March 2025 Nifty future and banknifty future analysis and intraday plan.
This video is for information/education purpose only. you are 100% responsible for any actions you take by reading/viewing this post.
please consult your financial advisor before taking any action.
----Vinaykumar hiremath, CMT

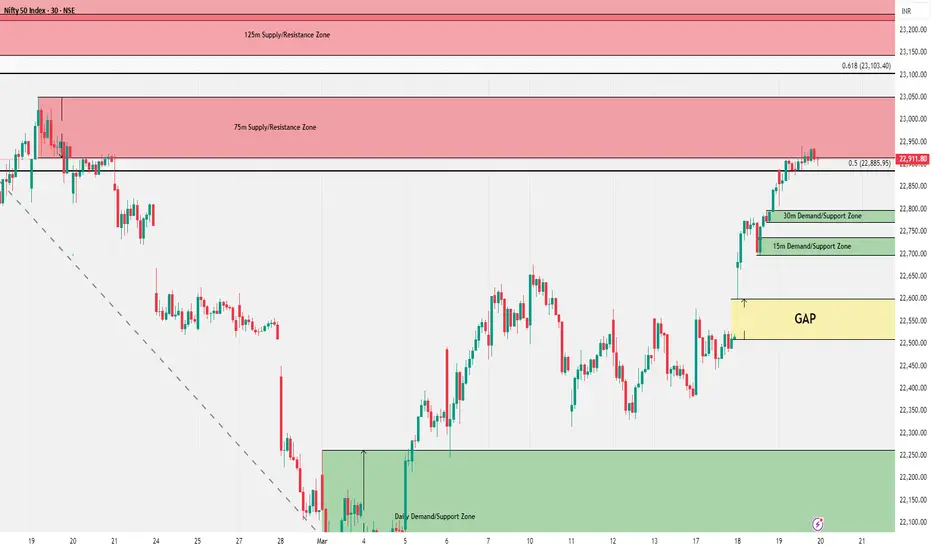
Nifty Intraday Support & Resistance Levels for 20.03.2025Market Recap:
On Wednesday, Nifty opened gap-up, dipped to a low of 22,807.95, and then rallied to a high of 22,940.70, entering the 75m Supply Zone (22,915.30 - 23,049.95). It closed at 22,907.60, gaining 73 points over the previous close. The Weekly Trend (50 SMA) remains negative, while the Daily Trend (50 SMA) has turned sideways from negative.
Demand/Support Zones
Near Demand/Support Zone (30m): 22,770.35 - 22,798.30
Near Demand/Support Zone (15m): 22,697.75 - 22,736.30
Far Demand/Support Zone (Daily): 21,964.60 - 22,261.55
Far Support: 21,281.45 (Low of 4th June 2024)
Far Demand/Support Zone (Daily): 20,769.50 - 20,950
Supply/Resistance Zones
Near Supply/Resistance Zone (75m): 22,915.30 - 23,049.95 (Tested)
Far Supply/Resistance Zone (125m): 23,144.05 - 23,235.50
Far Supply/Resistance Zone (125m): 23,316.30 - 23,409.65
Far Supply/Resistance Zone (Weekly): 23,222 - 23,807.30
Outlook
As expected, Nifty held the Daily Demand Zone and rallied past the 50% retracement level (22,885.95). The short-term trend remains bullish, and if the momentum sustains, Nifty could extend the rally towards 23,103 or even the Weekly Supply Zone at 23,222 in the coming days.
🚨 However, caution is advised as Nifty has touched the 75m Supply Zone today, which may lead to some selling pressure.
Make or Break 3 key Resistances Approaching. Nifty saw 3 good days of recovery. Now the real test begins as we are approaching the 3 big daddy resistances.
1) R1 Mother line Resistance (50 days EMA) 22988.
2) R2 Long Term Trend line Resistance 23237.
3) R3 Father Line Resistance 23399.
If these 3 are crossed the Nifty has potential to hit 23809 in the medium to short term.
If Nifty rally does not have steam it can again fall back to the support levels at 22638, 22334 or even 21974.
IT has not contributed to the current rally Infact it has remained laggard. RIL has not contributed. HDFC has remained range bond. If some IT counters or Heavy Weights like RIL or HDFC join the rally we can see Nifty flying otherwise there is a potential for this rally to fizzle out again. Things are in balance right now. Shadow of the candle neutral as I write this. Very important closing weekly closing awaits us on Friday.
Disclaimer: The above information is provided for educational purpose, analysis and paper trading only. Please don't treat this as a buy or sell recommendation for the stock or index. The Techno-Funda analysis is based on data that is more than 3 months old. Supports and Resistances are determined by historic past peaks and Valley in the chart. Many other indicators and patterns like EMA, RSI, MACD, Volumes, Fibonacci, parallel channel etc. use historic data which is 3 months or older cyclical points. There is no guarantee they will work in future as markets are highly volatile and swings in prices are also due to macro and micro factors based on actions taken by the company as well as region and global events. Equity investment is subject to risks. I or my clients or family members might have positions in the stocks that we mention in our educational posts. We will not be responsible for any Profit or loss that may occur due to any financial decision taken based on any data provided in this message. Do consult your investment advisor before taking any financial decisions. Stop losses should be an important part of any investment in equity.

Diamond Bottom Pattern in CreditAccess GrameenThis pattern is not a common but has a good strike rate if correctly identified. The breakout level is close 1020 and projected target is above 1500.

Plan for 19th March 2025 Nifty future and banknifty future analysis and intraday plan.
This video is for information/education purpose only. you are 100% responsible for any actions you take by reading/viewing this post.
please consult your financial advisor before taking any action.
----Vinaykumar hiremath, CMT

Excellent Break Out by Nifty. Will the momentum continue?Today the Nifty had a good leap after a lot of consolidation. The key question is will the momentum continue or FIIs will again take this opportunity to book profit. Today FII is on the net buying side after a long time. If the buying continues or even if FII remains neutral there is a good chance that we can see upside from here.
Key resistances for Nifty remain at 22857, 22921 and 22985. Above 22985 Nifty can gain more strength and may try to regain the levels of 23044, 23147 and 23249. 23404 as of now remains a mega resistance which is also the 200 days EMA of 200 days Father line. This zone as of now is little difficult to cross. Closing above 23404 can give might boost to the Bulls and a new Bull run can begin post closing above this point. Supports for Nifty at this juncture remain at 22726 (200 hours EMA or Father line of Hourly chart), 22594 and 22543. A closing below 22543 which is the Mother line support of the hourly chart or the (50 Hours EMA).
As there are small signs of reversal on the cards. It is a good time to read my book the Happy Candles Way to Wealth Creation. This is one of the highest rated books on Amazon. This book will teach you Behavioural Finance, Fundamental Analysis and Technical analysis. Every Bull Rally has a top and every Bear run has a bottom. If you can identify them. If you can understand the risk reward ratio. If you can understand the profit booking points, entry points the Mother, Father and the Small Child theory. The magic of Mother and Father lines. There is a lot of money to be made in the stock market. You need to learn, study and form your own strategy. If you want a ready made strategy then this book offers Happy Candles Number Strategy. All these things will help you in creating generational wealth. Do read my book and evolve into a Magnificent Investor and a Wealth creator. The Book is only priced at Rs.349 go ahead grab your copy.
Disclaimer: The above information is provided for educational purpose, analysis and paper trading only. Please don't treat this as a buy or sell recommendation for the stock or index. The Techno-Funda analysis is based on data that is more than 3 months old. Supports and Resistances are determined by historic past peaks and Valley in the chart. Many other indicators and patterns like EMA, RSI, MACD, Volumes, Fibonacci, parallel channel etc. use historic data which is 3 months or older cyclical points. There is no guarantee they will work in future as markets are highly volatile and swings in prices are also due to macro and micro factors based on actions taken by the company as well as region and global events. Equity investment is subject to risks. I or my clients or family members might have positions in the stocks that we mention in our educational posts. We will not be responsible for any Profit or loss that may occur due to any financial decision taken based on any data provided in this message. Do consult your investment advisor before taking any financial decisions. Stop losses should be an important part of any investment in equity.

Nifty holding above Hourly Mother line a good signalNifty holding above 50 Hours EMA or Mother line in the hourly chart is a good signal for the market if it holds above 22464 then there is a chance of further recovery. The supports for Nifty remain at 22464 (strong Mother line support), 22368 (Another strong trend line support), 22311 and 22205. If the support at 22205 is broken Nifty can go in a jiffy to 21976 or below. In case we get a closing above 22591 Nifty will become stronger and can jump to 22678 or 22722 levels. 22722 is a strong 200 Hours EMA or Father line resistance. A closing above 22722 can take us to next historical resistance levels of 22813, 22921, 23044, 23147 and 23249 levels. Closing above 23249 has potential to bring Bulls back out of ICU and Take Nifty further up.
Disclaimer: The above information is provided for educational purpose, analysis and paper trading only. Please don't treat this as a buy or sell recommendation for the stock or index. The Techno-Funda analysis is based on data that is more than 3 months old. Supports and Resistances are determined by historic past peaks and Valley in the chart. Many other indicators and patterns like EMA, RSI, MACD, Volumes, Fibonacci, parallel channel etc. use historic data which is 3 months or older cyclical points. There is no guarantee they will work in future as markets are highly volatile and swings in prices are also due to macro and micro factors based on actions taken by the company as well as region and global events. Equity investment is subject to risks. I or my clients or family members might have positions in the stocks that we mention in our educational posts. We will not be responsible for any Profit or loss that may occur due to any financial decision taken based on any data provided in this message. Do consult your investment advisor before taking any financial decisions. Stop losses should be an important part of any investment in equity.
