Nifty50 Trendline Retest – What’s Next for Traders?The Nifty50 is at a decisive point, retesting a key breakout level. Here's my take on the key levels to watch and how traders can approach the market
Nifty50 Analysis - 5th January
What's Happening?
Nifty 50 is at a make-or-break point. It recently broke out of a downward trendline, which is usually a good sign for bulls, but now the index is retesting that breakout. How it reacts at these levels will set the tone for the next move.
Key Levels to Watch:
- Resistance Zones:
- 24,222
- 24,347
- 24,528
- Support Zones:
- 23,990
- 23,897
- 23,790
- 23,592
Possible Scenarios:
1. The Bullish Path:
If Nifty holds above 24,057 and shows strength, we could see a move to 24,222, and if the momentum is strong enough, it might even test 24,347 or 24,528.
2. The Bearish Path:
If the price drops below 23,897, things could get dicey, with the index likely heading toward 23,790 and 23,592.
How to Trade This?
- For the Bulls:
Look for sustained buying above 24,057 to go long. Targets: 24,222, 24,347. Stop loss: Below 23,897.
- For the Bears:
If the price slips below 23,897, you might want to short. Targets: 23,790, 23,592. Stop loss: Above 24,057.
Final Thoughts:
This is one of those moments where patience pays off. Let Nifty show its hand before jumping in. Watch those key levels closely, and always trade with a plan (and a stop loss!).
NSE:NIFTY
Let me know your thoughts on this setup! Do you think bulls will hold, or will bears take over?
Nifty50

#nifty50 What Lies Ahead for Nifty & S&p500, 6-10th Jan 2025The Nifty Index this week staged a rally, closing at 24,004, a 200-point surge from the previous week. This bullish move, driven by a classic "W" pattern as predicted, saw highs of 24,226 and lows of 23,460. However, profit-taking by large players triggered a decline, confining the index within my anticipated range of 24,300-23,400.
For the upcoming week, I expect a trading range of 24,500-23,400 . A breach below 23,400 could find support at the 23,200-23,300 zone. A weekly close below this level would be a significant bearish signal, potentially triggering further selling pressure towards the 22,250 level. Conversely, a sustained move above 24,770 would signal a resumption of the uptrend, though this scenario currently appears challenging.
The S&P 500 also exhibited resilience this week, closing at 5,942 despite breaching the crucial support of 5,850. This formed a long-legged candle, indicating strong demand at lower levels. To reignite its upward momentum, the S&P 500 needs to close consecutively above 6,093. This bullish confirmation could propel it towards 6,142, 6,225, and even 6,376, providing a much-needed boost to global markets

Mid-Channel Resistance on Hourly charts Stops Nifty. The parallel channel is a channel in which the stock or index travels for a particular period of time. The upper frame of the channel acts as a strong resistance and the lower frame of the index acts as a support. Mid channel works in a dual way. If the price or the index level is above the Mid-Channel it acts as support if the price or the index level is below the Mid-Channel the line acts as resistance. Also on the daily chart of Nifty the level of 24212 was a Mother line Resistance of 50 day's EMA. Nifty today made a high of 24196 and retreated from there so it can be safely said that these 2 levels 24212(Mother line) and 24226 (Mid Channel resistance see in the chart will be most important resistances moving forward into the next week and probably full month. There is also a news of HPMV Virus outbreak in China as Trump resumes Presidency. Quarterly Results have already started flowing in and good results are expected this time around unlike traditionally weak October quarter. Additionally we are near the budget and there are news trickling in about relief to the Middle Class. Which can spark a pre-budget rally. So the signals from international market, technical analysis and on the local front. Next week is very important with perspective of full month of January.
Nifty Supports Remain at: 23989, 23902 (50 Hours Mother Line), 23797, 23540 (channel bottom Support) and finally 23279. Below 23279 closing Nifty has potential to fall totally into the bear grip. This does not look likely unless there is a catastrophic global event.
Nifty Resistances Remain at: 24086 (200 Hours EMA or the Father line Resistance), 24226 (Mid Channel Resistance), 24348, 24556, 24779, 24919 and finally 25025 (Channel top resistance).

Blue or Red - Which Alternative Would Play Out in NIFTY50?I see two major possibilities in NSE:NIFTY from Elliott Wave perspective, marked in red and blue.
As per blue counts, B of ABC down was done at 24857.75 and we are in C down. The downmove in C so far was corrective W (internally WXYXZ, or triple zigzag) so the bounce this week should be X. X has already retraced more than 50%, though less than 61.8%, so there is a possibility this X is complete and wave Y down within larger wave C will unfold next week. Having said that, X may not be over and might do 61.8% or more so that leaves some more room on the upside followed by Y down.
On the other hand, as per red counts, we are still in wave B of ABC down. 61.8% of the A is around 25125 so B might make an attempt towards or beyond that level. Once that's done, C should unfold on the downside.
Bigger picture is that, C down is still pending (or already in progress as per blue count) in both scenarios. If we break the low of 23460 then blue wave counts would likely play out. But if we break this week's high of 23226.70 then either blue or red counts could be in play as per the upside levels mentioned in both cases.
Let's see on which side camel will sit ...

INDIAN MARKET PILLER NIFTY 50 ANALYSIS Here we analyzed Nifty50 in hourly and 15/30 minutes time frame.
23968-23900 IS A LAST SUPPORT ZONE IF NIFTY BREAKS THAT THIS TRADE WILL BE TERMINATED
PRO ABOUT THIS TRADE :-
We analyzed Nifty50 Sector on that base we traded Nifty50
Britannia, Axis Bank, Bpcl and few others on favor
CONS:-
Nifty50 Got rejection from weekly supply zone Today.

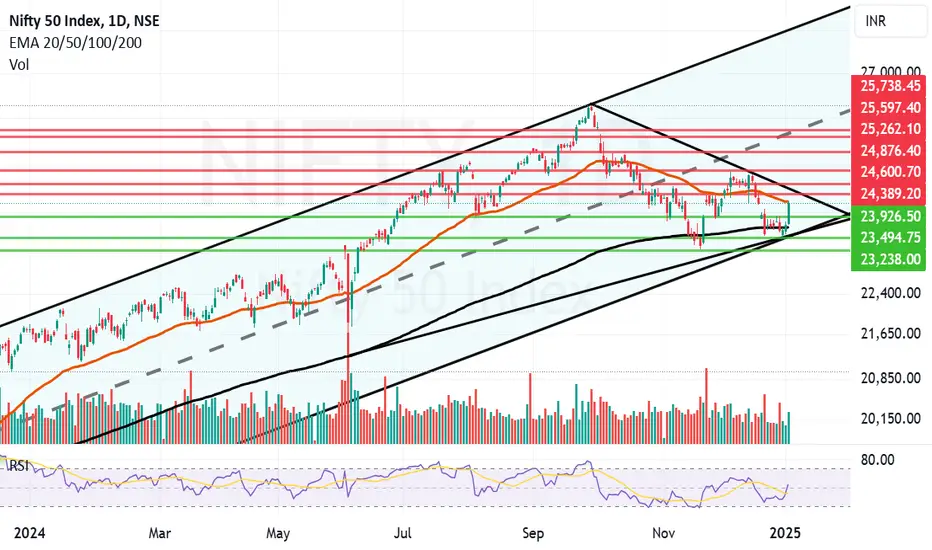
Nifty Stages Massive Comeback. But Will The Mother Line Relent? Nifty has staged a massive comeback today on the back of FII buying today. Nifty made a high of 24226 but Mother line Resistance (50 day's EMA at 24221) pushed it back a bit and it ended the day at 24188. If the mother line relents tomorrow and if we can get a weekly closing above 24221 tomorrow Bulls have potential to take the momentum forward into January with a possibility of Budget rally.
The supports for Nifty remain at 23926, 23698 (Father Line Support of 200 day's EMA), 23494 and finally 23238. Below 23238 all hell can break loose and bears will have potential to Pull Nifty further down.
Resistances on the upper side remain at 24221 (Mother Line Resistance of 50 day's EMA) followed by 24389, 24600 and 24876 before Nifty snatches back 25K levels.
Shadow of the candle remains neutral to positive but it can turn neutral or even negative if Mother line resistance comes into play again. The best possibility for Nifty remains if it can get a gap up opening above 24221. This can happen if we get good support from International indices and Gift Nifty tonight. Tomorrow's closing will be very important as it is the first weekly closing for the year.
Disclaimer:
The above information is provided for educational purpose, analysis and paper trading only. Please don't treat this as a buy or sell recommendation for the stock. We do not guarantee any success in highly volatile market or otherwise. Stock market investment is subject to market risks which include global and regional risks. We will not be responsible for any Profit or loss that may occur due to any financial decision taken based on any data provided in this message.
The Year that was and the year that can be. 2024/2025 story.Highlights of 2024:
a) Single digit return for Nifty in 2024. Nifty and Sensex rise 9% each.
b) Mid and Small Cap both rise 24% each.
c) Pharma and Real Estate both rise 40% each.
d) Trent, M&M and Bharti Airtel are the best performing Nifty stocks.
e) Asian Paints, Indusind Bank and Nestle are the worst performing Nifty stocks.
f) Dixon, BSE, OFSS and RVNL are the best performing Midcap stocks.
g) Vodafone Idea, AU SFB & Bandhan Bank are top Mid cap loosers.
Zones Where Nifty can form base and give closing in 2025.
Pessimistic Zone: In case of very negative year and some global catastrophe we can find Nifty forming a bottom between 19922 to 18476. *(Looks very unlikely as of now)*
Negative Zone: In case we have a negative closing for the year we may find Nifty closing the year between 21137 to 19922. *(Possible but we might get a bottom here and then the index might move upwards)*
Neutral Zone: The combination of Neutral to negative and neutral to Positive zone ranges from 26277 to 21137. Nifty can consolidate in this range. *(These are the lows and high of 2024).*
Positive Zone: We can see Nifty making a new high above 26277 and 27880. After which we can see a dip and further consolidation. *(A probable scenario)*
Optimistic Zone: In case we have a fantastic year we might see Nifty making a major peak between 27880 and 30060. *(This is a very optimistic scenario and less likely but you can never say never)*
Above assumptions of Nifty in 2025 are made based on Fibonacci Retracement applied from top to bottom and Bottom to top on the 2024 candle.
Disclaimer: The above information is provided for educational purpose, analysis and paper trading only. Please don't treat this as a buy or sell recommendation for the stock. We do not guarantee any success in highly volatile market or otherwise. Stock market investment is subject to market risks which include global and regional risks. We will not be responsible for any Profit or loss that may occur due to any financial decision taken based on any data provided in this message.

Nifty analysis for intraday 31/12/2024.Nifty has been trading in a range for the last 7 trading sessions.
Index is trading around the 20 EMA and giving sharp recovery on both sides.
Today it has closed below the moving averages. If the market starts trading below the No trading zone, bearish entry can be created for next support levels.
On the upper side the break out 23900 can clear the round number figure and test the Daily 20 EMA.
Wait for the price action near the levels before entering the trade.

Nifty after multiple efforts not able to close above 23900.Nifty again tried to climb up and made a high of 23915 however there was tremendous selling pressure at that level and not only it could not sustain 23900 but also it failed to sustain 23800 or even 23650 levs. Nifty closed at 23644 levels. This is a closing below the Father line (200 days EMA) which was at 23693. This closing is indicative of weakness. Shadow of the candle has turned negative as of now. There is a strong support at 23567. If this support is broken the door way towards 23273 or even 22800 will open up. Relative strength index is 37.40 and RSI support is at 30 and 27.54 levels. Incase of positive closing tomorrow which looks little difficult as of now the resistances will be at 23650, 23693 (Father Line), 23809, 23961 and finally 24159 and finally Mother line (50 Days EMA) Resistance at 24266.
So as of now it looks like we will have a modest close for the year. It has been an year for Nifty which Amplifies with 'what could have been'. Right now we are around 10% of the peak and at 9% yearly gains as compared to yearly closing. Hoping that law of averages catches up next year and we reach new highs next year and close the year robustly.
Disclaimer: The above information is provided for educational purpose, analysis and paper trading only. Please don't treat this as a buy or sell recommendation for the stock. We do not guarantee any success in highly volatile market or otherwise. Stock market investment is subject to market risks which include global and regional risks. We will not be responsible for any Profit or loss that may occur due to any financial decision taken based on any data provided in this message.

#Nifty50 Outlook for upcoming week 30-3rd Jan 2025The Nifty roared this week, gaining a solid 226 points, closing at a strong 23813! It reached a peak of 23938 before dipping to 23647. As predicted, the Nifty stayed within the 24100-23000 range, forming an interesting inside candle pattern. Excitingly, a bullish "W" pattern has emerged on the weekly chart!
If the Nifty can hold above the crucial 23900 level next week, we could see it trading between 24300 and 23400 . However, while a bounce is expected, the bearish Monthly chart might tempt big players to unload their positions. Stay alert!
Across the pond, the S&P500 took a 2.5% hit, closing at 5970 after reaching a high of 6049. The 5870-5850 support zone is critical. A breach could trigger a faster selloff, potentially testing the 5637/5551 support levels. For an upward move, the S&P500 needs to conquer 6050, paving the way for resistance levels at 6094/6142/6225.
Bottom line: Use any bounce next week as an opportunity to lock in profits. Stay informed and trade wisely!"
Wishing everyone a very happy & prosperous New Year.

Nifty on Weekly chart delicately placed. (Medium Term Outlook)Nifty is placed delicately on a weekly chart. Shadow of the candle is slightly positive but as the closing of the year looms large FIIs and the Bears might again try to sell on rise. On the positive side if FII will be on the buying side for the 2025 beginning and create fresh positive positions we might see a positive rally on the upside. The supports for Nifty remain at 23532, 23271 and 22724. 22724 is a very important support below which we might see a free fall which as of now can range till 21302 or even 20587. However there does not seem any trigger as of now which can bring Nifty to this levels but you never say never. On the positive side if there is a fresh buying trigger and a positive rally overall the resistances on the upper side seem to be near 23901, 24300, 24881 and finally 25409. 25409 is a strong resistance and closing above it will not only open the doors for touching the previous highs 26277 but also push Nifty towards making new highs.

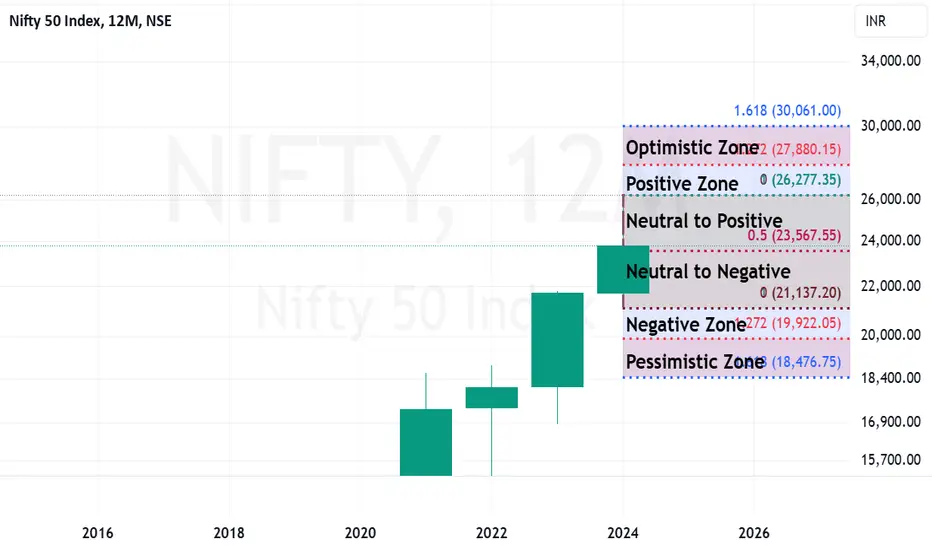
Fibonacci retracement on Yearly Candle gives us 2025 levels. We will continue out study of reading charts Today we will try to understand how to read the chart with the help of only 1 candle and Fibonacci series we will try to predict the range in which Nifty can move in the year 2025. First thing that one must understand that reading the charts is not a rocket science.
What we have done is very simple and anyone can do. The candle stick that we have take in a 12 Month Candle. That means, all movement of Nifty for the full year has been encompassed by a single candle. I have then applied Fibonacci retracement and reverse retracement. Which has given us various zones that determine levels of Nifty. In Case you do not know about Fibonacci Golden ration you may read about it in my previous articles about the subject in Smart Investment. Fibonacci series was seen in ancient Indian Sanskrit and Maths in the works of Pingala and Hemachandra few Thousand years ago. The series derives its name however from Italian mathematician who made it famous in the modern era.
Neutral Zone: The results that we got by applying Fibonacci and reverse Fibonacci on 12-month candle tell us that the neutral zone in case of sideways movement throughout the year would see Nifty moving between 21137 to 26277. Candles however seldom repeat on yearly scale but you never say never. These are the highs and lows of the current year.
Negative Zone: If something very negative happens in the budget or thereafter on local or global scale we might see Nifty pivot to this range or 21137 to 19922. Where it could find support and reembark its journey upwards.
Pessimistic Zone: In case of a catastrophe or some thing very negative on global or local / Macro or Micro economic front the range that we could see will be Nifty deteriorating towards 19922 to 18476. However, this looks unlikely as of now and even if it happens the upward journey might soon begin as PE investors might see a great value buying opportunity.
Positive Zone: If things fall in place and economic progress continues, there is no deterioration of GDP or inflation and if Rupee recovers swiftly the zone between 26277 pervious peak and 27880 is possible. We may see a new peak of Nifty in this range.
Optimistic Zone: In case the FII return enemas and economy continues to bloom with few elections and political stability / border stability and GDP growth continues it is quiet possible that we may see Nifty reaching new highs which will be in this range between 27880 and 30061. This seems a little distant dream as of now but you can never say never. At least if we hit the sweet spot of economy and Fibonacci golden ration even this ‘Everstsesque’ peak might be summited by Nifty.
Here we have given different hypothetical scenarios of Nifty based on Fibonacci and candlestick analytics. For indepth understanding of Techno-Funda investing you can read my book which is The Happy Candles Way to Wealth creation. This book is available on Amazon in paperback and Kindle version. The book contains valuable tips for you to maximise your profits from stock market and wealth creation. It also explains my much coveted Mother, Father and Small Child Theory.
Disclaimer: The above information is provided for educational purpose, analysis and paper trading only. Please don't treat this as a buy or sell recommendation for the stock. We do not guarantee any success in highly volatile market or otherwise. Stock market investment is subject to market risks which include global and regional risks. There is also chance of bias in our opinion. I, my family or my clients may have a long position in the stock. We will not be responsible for any Profit or loss that may occur due to any financial decision taken based on any data provided in this message.
Nifty IntradayPure technical levels...
if the early morning momentum continues during after noon session can test 24100 levels
currently forming a flag with lesser volume and also forming a base
Momentum has to be there for upside

Year 2025 and Beyond: Where to Place Your Bets?S&P 500:
US indices may continue their upward trend until the first quarter of 2025. The ultimate target appears to be above 6300, where they may peak and begin a significant correction. A global stock sell-off could potentially trigger a stock market crash similar to that of 2008.
India's Nifty 50:
India's Nifty 50 may find support around the 23,000–22,700 range and resume its upward movement in the final fifth wave, targeting a peak near 29,000. The Nifty 50 is likely to follow a trend similar to the S&P 500. The bullish cycle that began in 2009 is expected to conclude near the 29,000 level. Subsequently, a significant sell-off in Indian indices could trigger a major bear market, potentially erasing up to 50% of market capitalization from its peak.
Gold:
Gold may continue its consolidation for another month or two. A final surge toward the $3,000–$3,100 range is expected to mark the end of the rally that began in December 2015 at the $1,050 level. However, the bear market in equities is unlikely to spare even the perceived safe haven, leading to a pullback in gold prices as well.
Brent Crude:
Since March 2020, Brent crude experienced a remarkable rise, surging from $15 per barrel to $139 per barrel by March 2022. Over the past 33 months, it has already corrected by more than 47%. Brent crude is still expected to decline further, potentially reaching $50 per barrel within the next 3 to 6 months. However, the current inflationary trend could drive Brent prices beyond $160 per barrel later in 2025, before eventually succumbing to a deflationary trend that may persist for several years.
US Dollar Index:
The US Dollar Index peaked at around 114 in September 2022. Since then, it declined to 100 by July 2023 before starting to rise again in a corrective A-B-C pattern, forming part of a larger (A)-(B)-(C) decline. The Wave C of (B) is expected to conclude near 109, followed by another decline toward 98 by the first half of 2025. However, a renewed bullish trend in the US Dollar Index could reinforce the "Cash is King" narrative during a global equity market downturn.
USD/INR:
The bullish trend in USD/INR, which began in January 2008 at the 39 level, has seen the Indian Rupee weaken by over 60% against the US Dollar over the past 17 years. In the short term, USD/INR may peak around 86. However, the Rupee is likely to weaken further, reaching 90 against the US Dollar by the second quarter of 2025.
US Govt. 10 years bond yield:
The long-term yield on U.S. Government 10-year bond's yield indicates rising interest rates for this decade. In the short term, the yield may ease to 3%-2.6% by the second quarter of 2025. However, fears of a U.S. Government default could push the yield to 10% or higher over the next couple of years. The "Bond Ghost," along with a global equity rout, may haunt investors again in 2025-2026.
Bitcoin (BTC):
Bitcoin's bullish trend may continue until the first quarter of 2025, albeit at a slower pace. BTC still has the potential to reach around $115k-$120k, concluding the bullish run that began in November 2022 from the level of $15,500. Over the past decade and a half, BTC has significantly outpaced any other asset class globally. However, global risk aversion, which may start with an initial global equity market sell-off, could pause Bitcoin's bullish journey for the rest of 2025. Before the end of 2025, BTC might lose up to 50% of its value from its peak.
In the longer run, however, BTC has the potential to become the most valuable asset class globally, even after experiencing a 50% erosion in its value.

NIFTY 50 26th DECEMBER 2024Stop-Loss (Red Zone)(23670):
Your stop-loss is set below the recent swing low, which is a good strategy as it protects against potential downside movement if the price reverses.
Entry Zone:(23700)
It seems you are entering a long position (buy) in a consolidation phase after the price formed a possible higher low. This suggests you expect the price to move up toward the targets.
Target Levels (Green Lines):
1st Target (23,910.70):
This is a reasonable target, as it aligns with a previous resistance zone (from the left side of the chart). If the price reaches this level, a partial profit booking strategy can be applied.
2nd Target (23,965.75):
This is just above the 1st target, closer to the next resistance level. It's a logical continuation of the trend if momentum sustains.
3rd Target (24,010.20):

NIFTY 50 : Mapping the future through harmony.Timeframe : Monthly
Tool : Fibonacci
My view in simple terms if Fractals were really to follow, NIFTY is yet to see more 10% gutter movement before it rallies.
Just an opinion, Your inputs, Suggestions and views are always welcomed.
Thank you for dropping by.

A Smart Comeback by Nifty but is it a dead cat bounce?Today we saw a smart comeback by Nifty but a confirmation candle and a positive closing to the week an ensure if it is not a dead cat bounce (Only a Technical bounce before Nifty falls again). Further ground has to be covered by Nifty before we reach the Bull territory. The closing today was good above the Father line and indicates positivity but whether the bounce sustains or not is a question that will be answered later in the week.
Right now the supports for Nifty remain at: 23691 (200 days EMA) or the Father line, 23588, 23258 (Mid channel support), 22499 and 21572.
Resistances on the upper side are at: 23871, 24053, 24183, 24359 (50 day's EMA) or the Mother line resistance, 24552 and finally 24721 (Important Fibonacci resistance). Bulls can get a prominence only after we get a closing above this level.
Disclaimer: The above information is provided for educational purpose, analysis and paper trading only. Please don't treat this as a buy or sell recommendation for the stock. We do not guarantee any success in highly volatile market or otherwise. Stock market investment is subject to market risks which include global and regional risks. We will not be responsible for any Profit or loss that may occur due to any financial decision taken based on any data provided in this message.

#Nifty50 outlook for upcoming week 23-27th Dec 2024The Nifty experienced a tumultuous week, plummeting roughly 1200 points to close at 23587 after reaching a high of 24781 and a low of 23537. This sharp decline was largely attributed to a hawkish stance from the US Federal Reserve, triggering a sell-off in the US market and prompting significant Foreign Institutional Investor (FII) selling in India. The 5% correction from its peak has brought the Nifty dangerously close to the crucial WEMA50 support level at 23426. However, there are signs of a potential bullish reversal forming a 'W' pattern. Sustaining above 23426 will be critical for a market turnaround.
Next week, I expect a volatile trading range between 24100 and 23000 . A breach of these levels could lead to significant market moves. The monthly Nifty chart also indicates weakness, suggesting further downside potential towards the 22250 support level, representing a 5.7% decline from current levels.
This presents a valuable opportunity for investors to prepare a watchlist of their preferred stocks and strategically accumulate positions during any further market correction

Nifty Short Term Analysis. Nifty today has given a poor closing below 200 days EMA but the only saving grace can be that the closing is just above Mid-Channel support of 23500 and Important Fibonacci support of 23263.
These Two supports are broken then more hell can break loose and we can get to see the next Fibonacci supports being tested. The next Fibonacci supports can be near 22509 or 21585. On the positive side if either of the support is held and then we can see a new rally in Nifty wit resistances at 24718 and 25347. It looks like Nifty will take some time to reach new highs as the the mode is bottom searching and consolidation as of now.
Fresh rally and Bullish recovery can start only after we get a closing above these 2 levels. However, this can be a good time to go long by picking good blue chip stocks available at good valuations.
Disclaimer: The above information is provided for educational purpose, analysis and paper trading only. Please don't treat this as a buy or sell recommendation for the stock. We do not guarantee any success in highly volatile market or otherwise. Stock market investment is subject to market risks which include global and regional risks. We will not be responsible for any Profit or loss that may occur due to any financial decision taken based on any data provided in this message.

Three Year Parallel Channel of Nifty with Multiple indicators. We have tried to draw a Three Year Parallel Channel of Nifty with Multiple indicators. We will try to understand what is happening as per each indicator and try to get the jist of moves that may occur with a medium to long term perspective.
Indicator 1) Parallel Channel: The parallel channel indicates that after hitting the channel top at 26277 the Nifty is receding and is on a search of it's bottom from where it can launch forward again. That is the case when every time Nifty has it a channel top as you can see in the chart. The Future Channel Top once Nifty picks up the next Bull run seems to be around 29497 as per the parallel channel. Mid channel support of the parallel channel is around 23500 zone which can support Nifty. If we get a weekly closing below 23500 this level will become a resistance. In such a scenario of weekly closing below 23500 Channel bottom seems to be near 21296.
Indicator 2) Fibonacci Retracement: Fibonacci retracement suggests a bottom near 23263. If this level is broken there is a possibility of Nifty falling to the next fibonacci supports will be at 22506 and 21577. Once the Bull run begins the next resistance levels as per Fibonacci seem to be at 24725, 26777 (Previous high), 27162 and finally 28331.
Indicator 3) Bollinger Band: Support with respect to lower width of Bollinger Band seems to be near 23340. Mid Bollinger band resistance seems to be near 24660 and Bollinger band upper width resistances seems to be near 25981.
Indicator 4) RSI or the Relative Strength Index: RSI currently is at 44.41 and going downwards showing weakness. The RSI support can be found in the zone of 40, 38 or 36. Usually When RSI is below 30 the stock or index is considered oversold and when the stock or index RSI is above 70 it is considered overbought. RSI Below 20 is extremely oversold zone and RSI above 80 is considered extremely overbought.
Indicator 5) MACD or Moving Average Convergence and Divergence: MACD is a combination of Moving averages lines which tend to indicate direction in which stock or index will move and histograms indicate strength or weakness of a rally. As per MACD Nifty right now is in extreme Bear grip and will take a little time to recover. When the Blue line will start moving upwards and when it might cross the red line and continue to move upwards it can be considered as Nifty will come back to Bull Zone. Colour of histograms at that time will also start going Dark Green or light Green.
Indicator 6) 50 and 200 weeks EMA or the Mother and Father line: I have designed a theory called Mother, Father and Small Child Theory. As per this theory the movement of index or a stock in the chart is like a movement of a 3 year old child when it goes to a garden. The movement of 50 EMA is like movement of the mother and movement of the 200 EMA is like movement of a Father of that child. To know more about this theory or other indicators mentioned earlier you need to read my book THE HAPPY CANDLES WAY TO WEALTH CREATION. This book is available in Amazon in paperback or Kindle version. It is one of the Highest rated book in the category. Have a look at that book it will help you immensely in your wealth creation journey. Now as per this theory the Nifty right now is at 23587. 50 Weeks EMA is at 23403. 200 Weeks EMA is at 19335. as the Nifty is above these levels both these levels will work as a great support to Nifty and can help Nifty from falling further.
Conclusion: Nifty is approaching multiple supports from where it has potential to turnaround. Mid channel support is around 23500, 50 Weeks EMA support or the Mother line is at 23403. 23340 is the Bollinger band lower band width support. Fibonacci support is at 23263. We can see a turnaround mostly from either of these three supports. If these supports are broken by chance (looks less likely but you can never say never) then the next supports will be at 22507, 21296 or worst case scenario as of now looks like 19335. On the upper side resistances seem to be at 24660 Fibonacci mid resistance, 24725 is the Fibonacci resistance, 25981 is Bollinger band upper width resistance and 26277 is the Fibonacci resistnace which also the previous high of Nifty. Once this zone is crossed in a long term we can reach the targets of 27162 Fibonacci resistance, 28331 Fibonacci golden ratio resistnace and 29497 which is the approximate nex channel top. (This is the Medium to Long term outlook of Nifty).
This is how you can analyse any index or a stock using the 6 indicators mentioned in the writeup. I give top most priority to these 6 indicators in my analysis.
Disclaimer: Disclaimer: The above information is provided for educational purpose, analysis and paper trading only. Please don't treat this as a buy or sell recommendation for the stock. We do not guarantee any success in highly volatile market or otherwise. Stock market investment is subject to market risks which include global and regional risks. We will not be responsible for any Profit or loss that may occur due to any financial decision taken based on any data provided in this message.

Can The Major Support Zone Save Nifty From Falling Further?There is a triple Support zone that has been reached by Nifty. The Zone between today's low that is 23870 and 23692 has multiple supports of a trend line and Father Line of 200 day's EMA. Let us see if we have a revival from here. If that will be the case the next resistance zones will be 24019, 24175, 24416(Major Mother Line Resistance of 50 day's EMA) and 24529 (Major Trend Line Resistance).
If the support of 23870 is broken we will have to rely upon 23962 that is the major 200 day's EMa of Father line. If we get a closing below 23692 or the Father line. Bears will become more powerful and we may see them control the game. In such a scenario the supports will be at 23350, 23088 and 22828. So very critical weekly closing tomorrow. Shadow of the candle for tomorrow is neutral to negative.
Disclaimer: The above information is provided for educational purpose, analysis and paper trading only. Please don't treat this as a buy or sell recommendation for the stock. We do not guarantee any success in highly volatile market or otherwise. Stock market investment is subject to market risks which include global and regional risks. We will not be responsible for any Profit or loss that may occur due to any financial decision taken based on any data provided in this message.

As Expected Mother Line resistance has come into playAs we had expected in Yesterday's message the closing below Mother line yesterday meant that Mother line resistance was supposed to come into play today and it did. Nifty made a high of 24394 and ominous mother line resistance was near by as can be seen in the chart and Nifty got rejected from there. Now Nifty is tossed into bottom searching mode. Today's low that is 24149.85 was a support zone and we saw a closing above it at 24198 which is the silver lining in the cloud. If 24150 is respected tomorrow we can start seeing some range bound upside. If the support of 24150 is not respected and we get a closing below this level the further supports for Nifty will be at 23904, 23803 or Strong Father line support at 23689. If 23689 is broken we can see a low of 23291 or so as of now.
On the positive side if the support of 24150 is respected by Nifty the resistances on the upside will be near 24311, 24435 (Strong Mother line resistance), 24627, 24793 or even 24960. 24960 is a strong resistance to cross but if and when it is crossed we can see more upside as Bulls will start calling shots above this level.
Thus the most critical supports are 24150 and 23689. Most critical resistances will be 24435 as of now.
Disclaimer: The above information is provided for educational purpose, analysis and paper trading only. Please don't treat this as a buy or sell recommendation for the stock. We do not guarantee any success in highly volatile market or otherwise. Stock market investment is subject to market risks which include global and regional risks. We will not be responsible for any Profit or loss that may occur due to any financial decision taken based on any data provided in this message.

2 Red Candles throw Nifty back to support searching mode. 2 intensive Red Candles with big selling throw Nifty back to support searching mode. The strong support zone is round the corner. The chart shows Nifty is nearing 2 major trend line supports at 24257 and 24175. If these 2 supports are broken further supports for Nifty will be at 23904 and 23803. Final Mega support for Nifty will be 23684 (200 day's EMA or Father Line Support) and recent low of 23291. On the upper side resistances galore at 24445 (50 day's EMA or Mother line) followed by 24627, 24793, 24960 and finally 25209.
The selling has come on the back of Rupee hitting all time low and fears over US FED slowdown in the Rate Cuts in the year 2025 as inflation is not abetting and is continuing to grow. US Markets have already priced in 25bps rate cut for the ongoing FEd meeting. But more worry is regarding the commentary about 2025 and 1 or 2 more US FED meetings decisions before Trump administration takes over. With Nifty nearing critical support levels mentioned earlier volatility, bulls Vs bears FII Vs DII intense struggle is on cards. Bears have had an upper hand so far this week but Bulls can stage a fierce fight back any time within this week itself once Nifty confirms support.
Disclaimer: The above information is provided for educational purpose, analysis and paper trading only. Please don't treat this as a buy or sell recommendation for the stock. We do not guarantee any success in highly volatile market or otherwise. Stock market investment is subject to market risks which include global and regional risks. We will not be responsible for any Profit or loss that may occur due to any financial decision taken based on any data provided in this message.
