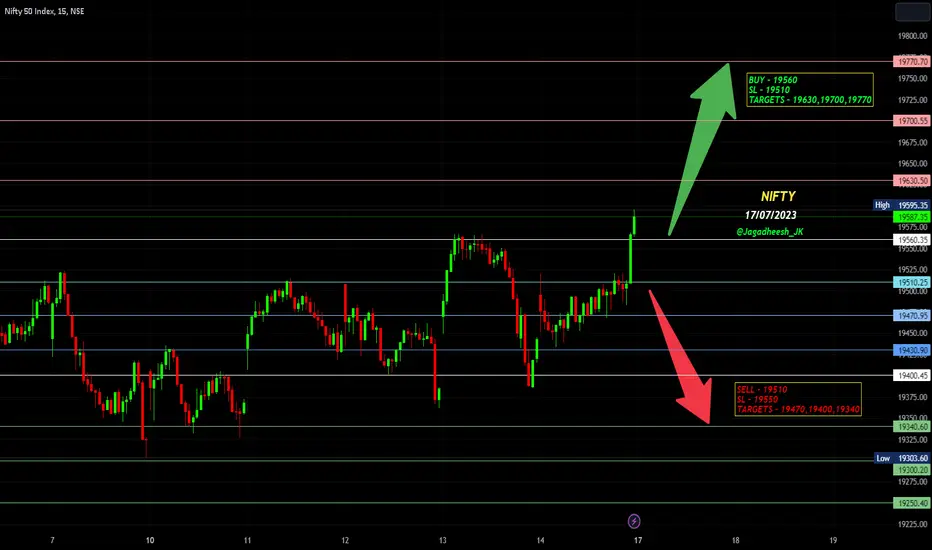
NIFTY INTRADAY ANALYSIS FOR 17/07/2023BUY ABOVE - 19560
SL - 19510
TARGETS - 19630,19700,19770
SELL BELOW - 19510
SL - 19550
TARGETS - 19470,19400,19340
SORRY! For the late posting guys.... 😔🤒🤧 I'm not feeling well
Disclaimer - All information on this page is for educational purposes only,
we are not SEBI Registered, Please consult a SEBI registered financial advisor for your financial matters before investing And taking any decision. We are not responsible for any profit/loss you made.
HAPPY TRADING 👍
Nifty50
BANKNIFTY/NIFTY ANALYSIS FOR TUESDAY18TH JULY-FOR EDUCATION PURPBANKNIFTY/NIFTY ANALYSIS FOR TUESDAY18TH JULY-FOR EDUCATION PURPOSE
This video is for educational purpose and my personal view . We are NOT SEBI registered Advisor, we only give the level on our practical trading experience. Kindly take the trade according to your risk and reward position and consulting your advisor. It is advisable to take the advice of SEBI registered advisor.
@vijayanjum
#nse
#nsebse
#Nifty
#niftyfifty
#bankniftytrading
#nfitybank
#niftypredictionfortomorrow
#niftyoptions
#NiftyBank
#nifty50
#nifty500
#niftytomorrow
#niftytoday
#NiftyCE
#bankniftyoptions
#sensex
#sensexindia
#sensextoday
#bankniftytips
#bankniftyanalysis
#bankniftytrading
#bankniftyoptions
#finnifty
#bankniftystrategies
#niftystrategies
#bse#bseindia
#bsesensex
#nsenifty
#nsebse
#nseindia
#STOCKMARKETEDUCATION
#STOCKMARKETUPTODATE
#STOCKMARKETTODAY
#stockmarkets
#tommorrowMarketPrediction
#nfityoutlookfornextweek
#bankniftyoutlookfornext week
#bankniftyoutlookformonday
#niftyforecast
#bankniftyforecast
#niftyshareprice
#bankniftyshareprice
#tommorrowniftyprediction
#tommorrobankniftypredicton
#niftytargettommrrow
#bankniftytargettommrrow
#bankniftylive
#banknifty
#bankniftyoptions
#bankniftystrategies
#bankniftyfuture
#bankniftyoptionstrategy
#bankniftycalls
#bankniftyintraday
#bankniftylivetrading
#bankniftyweeklyexpiry
#bankniftycrash
#bankniftytomorrow
#bankniftypredictions
#bankniftychart
#bankniftytips
#bankniftypremium
#bankniftyoptions
#bankniftyfuture
#bankniftytomorrowprediction
#bankniftyoption
#niftyweeklyexpiry
#stockmarketinindia
#derivatives
#niftypredictions
#niftytips
#bank nifty analysis,
#bank nifty prediction for tomorrow,
#bank nifty analysis for 13 july,
#bank nifty tomorrow,
#nifty prediction for tomorrow,
#nifty prediction,
#nifty analysis,
#banknifty tomorrow,
#bank nifty tomorrow analysis,
#nifty tomorrow,
#bank nifty analysis for tomorrow,
#nifty analysis for tomorrow,
#stock market crash,
#stock market latest news today,
#bank nifty live,
#live trading bank nifty,
#nifty live trading,
#live trading,
#bank nifty live trading

Keep Trading simple:Keep Trading simple:
Buy at support.
Short resistance.
Buy breakouts.
Shorts breakdowns.
Buy pullback in uptrend.
Short in downtrend.
Do these and you will imporove your trading, imensely.
Trading terms:
Buy at Support: Support refers to a price level at which a stock or any other financial instrument has historically had difficulty falling below. It is considered a level where buying interest typically outweighs selling pressure, leading to a potential rebound in price. Buying at support means entering a long position when the price reaches a support level, with the expectation that it will bounce higher.
Short at Resistance: Resistance is the opposite of support. It is a price level at which a stock or any other financial instrument has historically struggled to rise above. It is considered a level where selling pressure tends to outweigh buying interest, potentially leading to a reversal or a downward move. Shorting at resistance means entering a short position when the price reaches a resistance level, anticipating a decline in price.
Buy Breakouts: A breakout occurs when the price of a stock or any other financial instrument breaks through a significant resistance level or a well-defined trading range. Buying breakouts involves entering a long position once the price surpasses a resistance level, with the expectation that the breakout will lead to a sustained upward move.
Short Breakdowns: A breakdown happens when the price of a stock or any other financial instrument falls below a significant support level or a well-defined trading range. Shorting breakdowns involves entering a short position once the price breaches a support level, anticipating a continued downward move.
Buy Pullback in Uptrend: In an uptrend, prices tend to rise in a series of higher highs and higher lows. A pullback refers to a temporary decline in price within the overall uptrend. Buying pullbacks involves entering a long position when the price retraces to a support level or a previous level of consolidation, with the expectation that the uptrend will resume and the price will rise again.
Short in Downtrend: In a downtrend, prices tend to fall in a series of lower highs and lower lows. Shorting in a downtrend involves entering a short position when the price rallies to a resistance level or a previous level of consolidation, with the expectation that the downtrend will continue and the price will decline further.
It's important to note that these trading ideas are based on technical analysis, which focuses on historical price patterns and trends. However, successful trading involves a combination of technical analysis, fundamental analysis, risk management, and market knowledge. It's always advisable to thoroughly research and understand the market and seek professional advice before making any trading decisions.

Channel Top Resistance Approaching For NiftyNifty has yet again reached the region from where channel top is near by. Channel top resistance can be in the range of today's peak that is 19595 to somewhere in the range of 19661. Supports for Nifty in case of fall will remain near 19464, 19422 (50 Hours EMA), 19360 (Mid-channel support), 19233 and final major support is near 19133. Closing below 19037 and channel bottom around 19000 will awaken the bares and will have potential to change the trend.

N50 -Weekly view Target - 19575+++Nifty 50 -- after today good fall nifty will gives good recovery. still have more strength have in market
Technical analysis -
Harmonic and Price action also suggest long position

Higher High, Higher Low Pattern in Nifty. 50 Hours EMA is supporHigher High, Higher Low Pattern in Nifty. As soon as a new high is made lot of Profit booking is taking place due to which Spot-Nifty tends to come down but 50 Hours EMA is supporting the higher high, higher low pattern. If 50 Hours EMA is broken we may see some un-widing. If we see unwinding in Nifty the supports that will be activated will be 19393 (50 hours EMA), 19296 with mid channel support near by, 19233, 19133 and finally 19003. Below 19003 bears will be activated. Resistances on the upper side are 19477, 19514 and finally 19567.

KAMDHENU SWING TRADE🚀30%swing trade perfect symmetrical triangle short term opportunity for upside take trade after breakout from the trendline according to own risk this is not call just a analysis.

Nifty has taken support at 50 Hours EMANifty has plunged as expected but during the last hour of the day took fantastic support at 50 Hours EMA. This support will again help Nifty to have another go at the resistance range of 19450 to 19525 zone. Before reaching this zone Nifty has to cross important resistance of 19419. Supports at 19359 and 19296 are strong ones.

NIFTY TRADING ANALYSIS FOR 12/07/2023BUY ABOVE - 19470
SL - 19430
TARGETS - 19510,19560,19630
SELL BELOW - 19400
SL - 19430
TARGETS - 19340,19300,19250
Disclaimer - All information on this page is for educational purposes only,
we are not SEBI Registered, Please consult a SEBI registered financial advisor for your financial matters before investing And taking any decision. We are not responsible for any profit/loss you made.
I'm not well guys 🫀💉🩸So I'm not sure about Updating the market moment in the live market.... If possible I'll update at that time
If you like my levels then keep this levels into your Charts & Follow the levels Strictly
HAPPY TRADING GUYS

BANKNIFTY/NIFTY ANALYSIS FOR THURSDAY 14TH JULY-FOR EDUCATION PUBANKNIFTY/NIFTY ANALYSIS FOR THURSDAY 14TH JULY-FOR EDUCATION PURPOSE
This video is for educational purpose and my personal view . We are NOT SEBI registered Advisor, we only give the level on our practical trading experience. Kindly take the trade according to your risk and reward position and consulting your advisor.
@vijayanjum
#nse
#nsebse
#Nifty
#niftyfifty
#bankniftytrading
#nfitybank
#niftypredictionfortomorrow
#niftyoptions
#NiftyBank
#nifty50
#nifty500
#niftytomorrow
#niftytoday
#NiftyCE
#bankniftyoptions
#sensex
#sensexindia
#sensextoday
#bankniftytips
#bankniftyanalysis
#bankniftytrading
#bankniftyoptions #finnifty
#bankniftystrategies
#niftystrategies
#bse#bseindia
#bsesensex
#nsenifty
#nsebse
#nseindia
#STOCKMARKETEDUCATION
#STOCKMARKETUPTODATE
#STOCKMARKETTODAY
#stockmarkets
#tommorrowMarketPrediction
#nfityoutlookfornextweek
#bankniftyoutlookfornext week
#bankniftyoutlookformonday
#niftyforecast
#bankniftyforecast
#niftyshareprice
#bankniftyshareprice
#tommorrowniftyprediction
#tommorrobankniftypredicton
#niftytargettommrrow
#bankniftytargettommrrow
#bankniftylive
#banknifty
#bankniftyoptions
#bankniftystrategies
#bankniftyfuture
#bankniftyoptionstrategy
#bankniftycalls
#bankniftyintraday
#bankniftylivetrading
#bankniftyweeklyexpiry
#bankniftycrash
#bankniftytomorrow
#bankniftypredictions
#bankniftychart
#bankniftytips
#bankniftypremium
#bankniftyoptions
#bankniftyfuture
#bankniftytomorrowprediction
#bankniftyoption
#niftyweeklyexpiry
#stockmarketinindia
#derivatives
#niftypredictions
#niftytips

HDFC - Almost nearning demand zoneHDFC is nearing demand zone.
Good buy on the Banknifty and HDFC for short term once it touched the demand zone.
Note: This is for educational purpose.

Nifty for next 3 daysLong till 19300 breaks and closes below it
it can still bounce fem 19300
A small resistance near 19400 tested twice
My view is bullish if break 19400 and closes day high

BANKNIFTY/NIFTY ANALYSIS FOR WEDNESDAY 12TH JULY-FOR EDUCATION PBANKNIFTY/NIFTY ANALYSIS FOR WEDNESDAY 12TH JULY-FOR EDUCATION PURPOSE
This video is for educational purpose and my personal view . We are NOT SEBI registered Advisor, we only give the level on our practical trading experience. Kindly take the trade according to your risk and reward position and consulting your advisor.
@vijayanjum
#nse
#nsebse
#Nifty
#niftyfifty
#bankniftytrading
#nfitybank
#niftypredictionfortomorrow
#niftyoptions
#NiftyBank
#nifty50
#nifty500
#niftytomorrow
#niftytoday
#NiftyCE
#bankniftyoptions
#sensex
#sensexindia
#sensextoday
#bankniftytips
#bankniftyanalysis
#bankniftytrading
#bankniftyoptions #finnifty
#bankniftystrategies
#niftystrategies
#bse#bseindia
#bsesensex
#nsenifty
#nsebse
#nseindia
#STOCKMARKETEDUCATION
#STOCKMARKETUPTODATE
#STOCKMARKETTODAY
#stockmarkets
#tommorrowMarketPrediction
#nfityoutlookfornextweek
#bankniftyoutlookfornext week
#bankniftyoutlookformonday
#niftyforecast
#bankniftyforecast
#niftyshareprice
#bankniftyshareprice
#tommorrowniftyprediction
#tommorrobankniftypredicton
#niftytargettommrrow
#bankniftytargettommrrow
#bankniftylive
#banknifty
#bankniftyoptions
#bankniftystrategies
#bankniftyfuture
#bankniftyoptionstrategy
#bankniftycalls
#bankniftyintraday
#bankniftylivetrading
#bankniftyweeklyexpiry
#bankniftycrash
#bankniftytomorrow
#bankniftypredictions
#bankniftychart
#bankniftytips
#bankniftypremium
#bankniftyoptions
#bankniftyfuture
#bankniftytomorrowprediction
#bankniftyoption
#niftyweeklyexpiry
#stockmarketinindia
#derivatives
#niftypredictions
#niftytips

Resistance of ATH Zone works again today and stops Nifty.Resistance of ATH Zone works again today and stops Nifty. As expected the resistance zone between 19437 and 19523 again got activated. Nifty made a high of 19515.1 and returned closing the day at 19439.4. End was just above 19437 which should act as a support no.1 for tomorrow. Further supports will be at 19419, 19399, 19337, 19296 and 19232. Again 19500 to 19523 will act as resistance zone. Crossing and closing above 19525 will open the doors for 19600 or even 19700. All eyes on the Speech of FOMC member Bullard tonight.

Nifty Delicately placed between support and resistance zones. There are three major supports for Nifty on hourly channel near the current level. The supports being at 19354, 19295 and 19232. Falling below 19232 will take spot Nifty to the levels of 19065 or 18894. Below 18894 Nifty becomes very week and final major support for Bulls will be at 18651. Resistance for Nifty will be near the levels of 19437 and 19523. Crossing and closing above this zone is difficult but if Nifty closes above 19523 channel top resistance will be in the zone of 19590 to 19610.

BANKNIFTY/NIFTY ANALYSIS FOR TUESDAY 11TH JULY-FOR EDUCATION PURBANKNIFTY/NIFTY ANALYSIS FOR TUESDAY 11TH JULY-FOR EDUCATION PURPOSE
This video is for educational purpose and my personal view . We are NOT SEBI registered Advisor, we only give the level on our practical trading experience. Kindly take the trade according to your risk and reward position and consulting your advisor.
@vijayanjum
#nse
#nsebse
#Nifty
#niftyfifty
#bankniftytrading
#nfitybank
#niftypredictionfortomorrow
#niftyoptions
#NiftyBank
#nifty50
#nifty500
#niftytomorrow
#niftytoday
#NiftyCE
#bankniftyoptions
#sensex
#sensexindia
#sensextoday
#bankniftytips
#bankniftyanalysis
#bankniftytrading
#bankniftyoptions #finnifty
#bankniftystrategies
#niftystrategies
#bse#bseindia
#bsesensex
#nsenifty
#nsebse
#nseindia
#STOCKMARKETEDUCATION
#STOCKMARKETUPTODATE
#STOCKMARKETTODAY
#stockmarkets
#tommorrowMarketPrediction
#nfityoutlookfornextweek
#bankniftyoutlookfornext week
#bankniftyoutlookformonday
#niftyforecast
#bankniftyforecast
#niftyshareprice
#bankniftyshareprice
#tommorrowniftyprediction
#tommorrobankniftypredicton
#niftytargettommrrow
#bankniftytargettommrrow
#bankniftylive
#banknifty
#bankniftyoptions
#bankniftystrategies
#bankniftyfuture
#bankniftyoptionstrategy
#bankniftycalls
#bankniftyintraday
#bankniftylivetrading
#bankniftyweeklyexpiry
#bankniftycrash
#bankniftytomorrow
#bankniftypredictions
#bankniftychart
#bankniftytips
#bankniftypremium
#bankniftyoptions
#bankniftyfuture
#bankniftytomorrowprediction
#bankniftyoption
#niftyweeklyexpiry
#stockmarketinindia
#derivatives
#niftypredictions
#niftytips
