Nifty levels - Aug 07, 2025Nifty support and resistance levels are valuable tools for making informed trading decisions, specifically when combined with the analysis of 5-minute timeframe candlesticks and VWAP. By closely monitoring these levels and observing the price movements within this timeframe, traders can enhance the accuracy of their entry and exit points. It is important to bear in mind that support and resistance levels are not fixed, and they can change over time as market conditions evolve.
The dashed lines on the chart indicate the reaction levels, serving as additional points of significance to consider. Furthermore, take note of the response at the levels of the High, Low, and Close values from the day prior.
We hope you find this information beneficial in your trading endeavors.
* If you found the idea appealing, kindly tap the Boost icon located below the chart. We encourage you to share your thoughts and comments regarding it.
Wishing you success in your trading activities!
Niftylevels

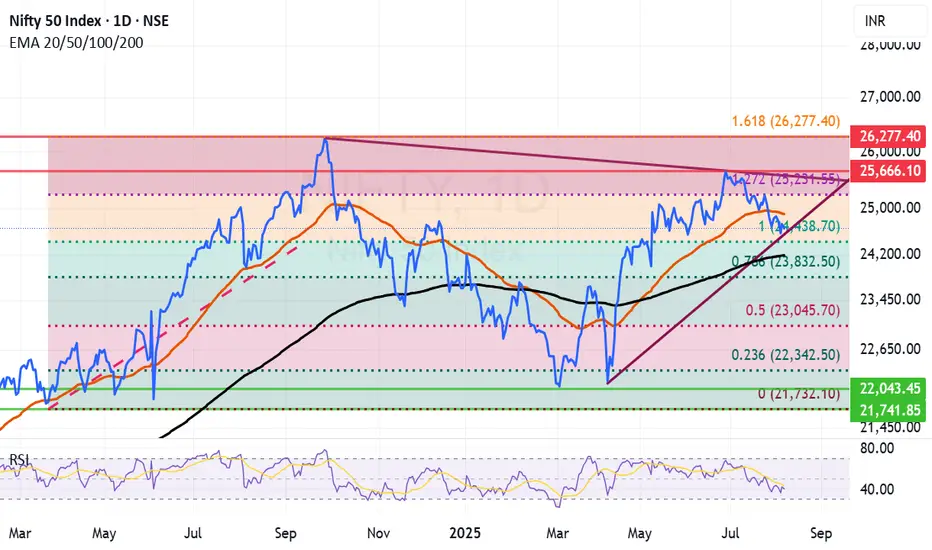
important Fibonacci retracement level approaching for NiftyVery important fibonacci retracement level for Nifty is arriving with ever increasing Trump tantrum and Indian defiance to toe US and EU line on Russian Crude and other trade practises. Market looks delicately placed at this juncture as investors fear that action from the West would undermine Indian growth story. The current fall can be utilized for shifting the balance of the portfolio towards goods that will be 100% made in India and will be consumed in India. For long term investors the current fall can be used to accumulate long term investment ideas with a horizon of 2 to 3 years.
Supports for Nifty remain at: 24438 (Important Fibonacci support), 24190 (Father line support, closing below this will enable bears to pull down Nifty towards next supports), 23832 (Next Fibonacci support), 23045 (Major Fibonacci support).
Resistance for Nifty remain at: 24896 (Mother Line Support), 25231 (Next Fibonacci resistance. A closing above this level will enable bulls to pull Nifty towards next trend line resistance), 25666 (Next Trend line resistance).
Disclaimer: The above information is provided for educational purpose, analysis and paper trading only. Please don't treat this as a buy or sell recommendation for the stock or index. The Techno-Funda analysis is based on data that is more than 3 months old. Supports and Resistances are determined by historic past peaks and Valley in the chart. Many other indicators and patterns like EMA, RSI, MACD, Volumes, Fibonacci, parallel channel etc. use historic data which is 3 months or older cyclical points. There is no guarantee they will work in future as markets are highly volatile and swings in prices are also due to macro and micro factors based on actions taken by the company as well as region and global events. Equity investment is subject to risks. I or my clients or family members might have positions in the stocks that we mention in our educational posts. We will not be responsible for any Profit or loss that may occur due to any financial decision taken based on any data provided in this message. Do consult your investment advisor before taking any financial decisions. Stop losses should be an important part of any investment in equity.
Nifty levels - Aug 06, 2025Nifty support and resistance levels are valuable tools for making informed trading decisions, specifically when combined with the analysis of 5-minute timeframe candlesticks and VWAP. By closely monitoring these levels and observing the price movements within this timeframe, traders can enhance the accuracy of their entry and exit points. It is important to bear in mind that support and resistance levels are not fixed, and they can change over time as market conditions evolve.
The dashed lines on the chart indicate the reaction levels, serving as additional points of significance to consider. Furthermore, take note of the response at the levels of the High, Low, and Close values from the day prior.
We hope you find this information beneficial in your trading endeavors.
* If you found the idea appealing, kindly tap the Boost icon located below the chart. We encourage you to share your thoughts and comments regarding it.
Wishing you success in your trading activities!

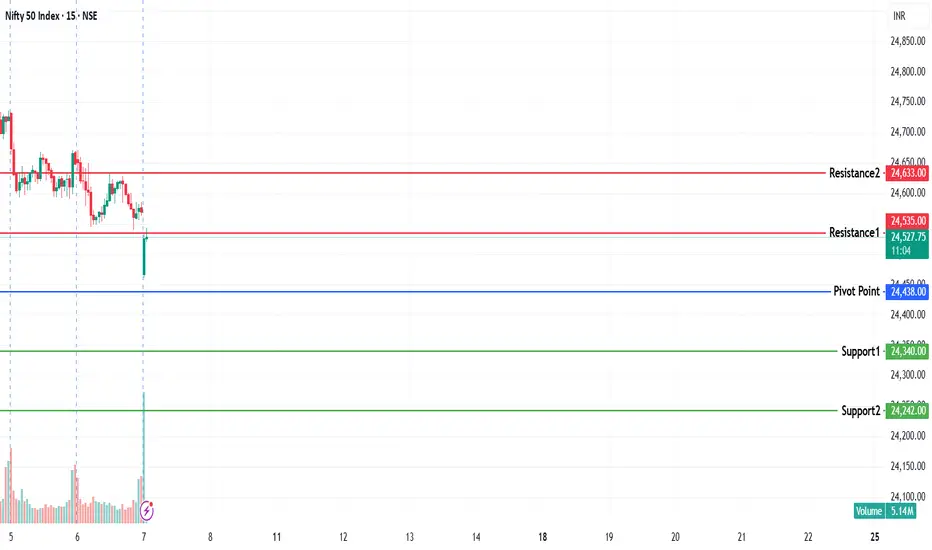
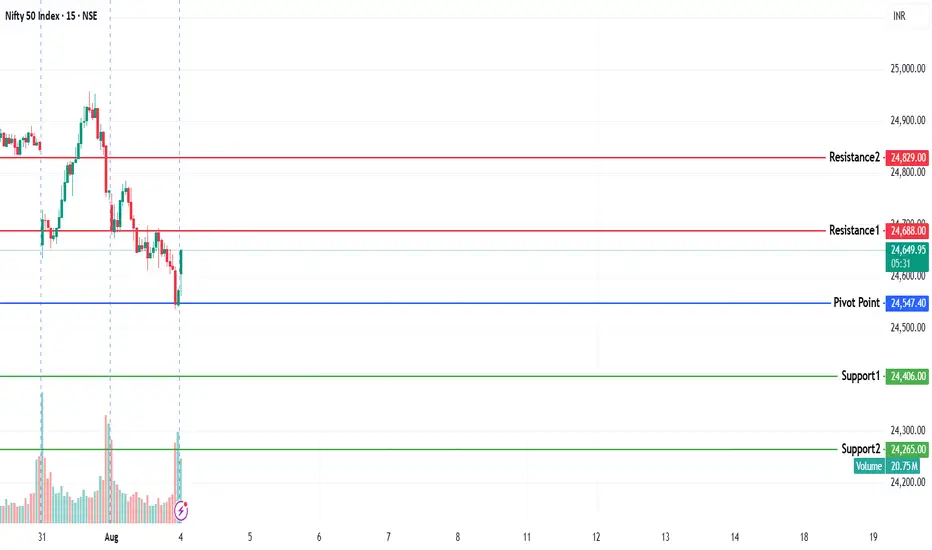
NIFTY KEY LEVELS FOR 07.08.2025NIFTY KEY LEVELS FOR 07.08.2025
If the candle stays above the pivot point, it is considered a bullish bias; if it remains below, it indicates a bearish bias. Price may reverse near Resistance 1 or Support 1. If it moves further, the next potential reversal zone is near Resistance 2 or Support 2. If these levels are also broken, we can expect the trend.
If the range(R2-S2) is narrow, the market may become volatile or trend strongly. If the range is wide, the market is more likely to remain sideways
📢 Disclaimer
I am not a SEBI-registered financial adviser.
The information, views, and ideas shared here are purely for educational and informational purposes only. They are not intended as investment advice or a recommendation to buy, sell, or hold any financial instruments.
Please consult with your SEBI-registered financial advisor before making any trading or investment decisions.
Trading and investing in the stock market involves risk, and you should do your own research and analysis. You are solely responsible for any decisions made based on this research.
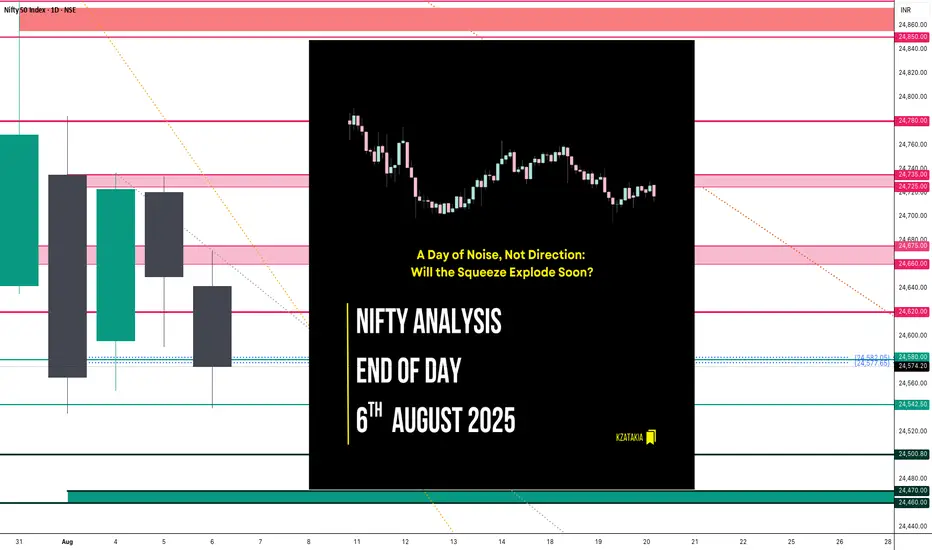
Nifty Analysis EOD – August 6, 2025 – Wednesday 🟢 Nifty Analysis EOD – August 6, 2025 – Wednesday 🔴
A Day of Noise, Not Direction: Will the Squeeze Explode Soon?
Nifty started flat with indecisive vibes, struggling initially around the 24,660 ~ 24,675 zone. After multiple failed attempts to hold, it slipped toward 24,580 — a cluster of PDL + S1 + Key Support — and broke below, forming the IB Low.
A quick bounce followed, but the index was firmly rejected near the VWAP + CPR + Fib zone, pushing it to a new day low at 24,544. Repeated intraday bounces faced selling pressure around 24,620, while 24,540 provided solid support — creating a tight intraday range.
Despite a perfect CPR setup for breakout, the market moved within just 132 points, the narrowest range in the last 4 sessions. A compression phase is building; breakout traders may soon get their moment.
📉 5 Min Time Frame Chart with Intraday Levels
🗣 Voice of the Intraday Option Buyer
Trend direction flipped multiple times — bearish to bullish and vice versa.
PDL + S1 zone experienced repeated fakeouts.
Low conviction moves on both sides frustrated momentum setups.
RBI event also not enough strong or trigger to guide directional bias.
Bank Nifty broke IB Low → IB High, closed strong; Nifty stayed muted.
Weekly expiry ahead — theta decay took control.
Many traders, including myself, anticipated a double inside bar breakout — but the trap continued.
Last 4 sessions (since Aug 1) have been painful for intraday option buyers — but it's all part of the game.
📉 Daily Time Frame Chart with Intraday Levels
🕯️ Daily Candle Breakdown
Open: 24,641.35
High: 24,671.40
Low: 24,539.20
Close: 24,574.20
Change: −75.35 (−0.31%)
Candle Structure:
Real Body: Red candle (67.15 pts)
Upper Wick: 30.05 pts
Lower Wick: 35.00 pts
Interpretation:
Attempted upside early on but couldn’t hold.
Both wicks show intraday tug-of-war; red close confirms sellers still in control.
Repeated rejection from 24,660–24,675 highlights weak bullish attempts.
Candle Type:
Bearish indecision candle — resembles an Inverted Hammer, indicating weakness despite dip buying attempts.
🔍 Nifty Short-Term View – As of August 6, 2025
Last 5 sessions show directional fatigue and failed bullish attempts above 24,700.
Two consecutive inside bars signal tight range and pending breakout.
Lower closes and long lower wicks = sellers dominate, but buyers defend dips.
Break below 24,535 = fresh selling.
Close above 24,660 = potential short-covering rally.
📌 Conclusion:
Nifty is coiling — a strong breakout may soon end this sideways-to-weak grind.
🛡 5 Min Intraday Chart
⚔️ Gladiator Strategy Update
ATR: 195.66
IB Range: 91.70 → Medium
Market Structure: Balanced
Trade Summary:
⏱ 10:35 AM – Short Entry → SL Hit
⏱ 12:15 PM – Long Entry → SL Hit
📏 Today's CPR Setup presenting...
Value Relationship: Inside Value → Breakout-Ready
Avg CPR Width: 37.54
Today’s CPR Width: 8.10 (🟠 21.58%)
CPR Type: Narrow → Perfect setup for big expansion
⚠️ Today’s setup didn’t deliver, but backtests show such narrow CPRs often explode in the following session.
📌 Support & Resistance Levels
🔼 Resistance Zones:
24,620
24,660 ~ 24,675
24,725 ~ 24,735
24,780 ~ 24,795
24,860 ~ 24,880
🔽 Support Zones:
24,542 ~ 24,535
24,500
24,470 ~ 24,460
🧠 Final Thoughts
The market is in consolidation mode with narrowing range. The double inside bar setup points to an imminent move — be prepared for a breakout trade soon. Don’t lose patience; big days often follow tough ones.
🛡 Disclaimer
This analysis is shared for educational purposes only. It is not trading advice. Please consult your financial advisor before making any trading decisions. Always trade with proper risk management.
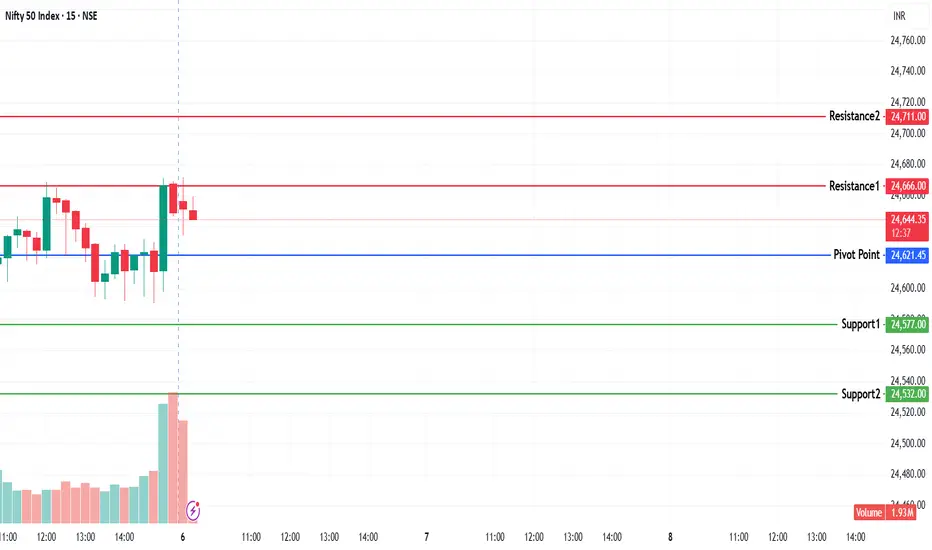
NIFTY KEY LEVELS FOR 06.08.2025NIFTY KEY LEVELS FOR 06.08.2025
If the candle stays above the pivot point, it is considered a bullish bias; if it remains below, it indicates a bearish bias. Price may reverse near Resistance 1 or Support 1. If it moves further, the next potential reversal zone is near Resistance 2 or Support 2. If these levels are also broken, we can expect the trend.
If the range(R2-S2) is narrow, the market may become volatile or trend strongly. If the range is wide, the market is more likely to remain sideways
📢 Disclaimer
I am not a SEBI-registered financial adviser.
The information, views, and ideas shared here are purely for educational and informational purposes only. They are not intended as investment advice or a recommendation to buy, sell, or hold any financial instruments.
Please consult with your SEBI-registered financial advisor before making any trading or investment decisions.
Trading and investing in the stock market involves risk, and you should do your own research and analysis. You are solely responsible for any decisions made based on this research.
Targets achieved ni NIFTY 50 THE RESULT
Follow for more Simple And accurate swing analysis on Indices, Currency, Commodities.
Targets Achieved in NIFTY 50 THE RESULT
Follow for more Simple And accurate swing analysis on Indices, Currency, Commodities.

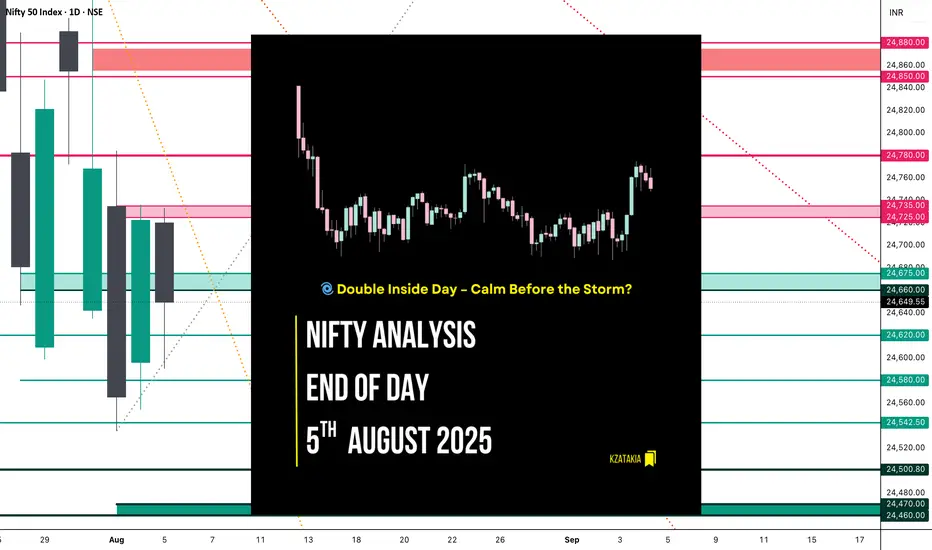
Nifty Analysis EOD – August 5, 2025 – Tuesday 🟢 Nifty Analysis EOD – August 5, 2025 – Tuesday 🔴
🌀 Double Inside Day – Calm Before the Storm?
📊 Nifty Summary
In the wind of negative news, yet Nifty starts neutral at the resistance zone of 24,725 ~ 24,735 but was unable to hold there and fell 140 points within the first 45 minutes.
After this initial sell-off, Nifty found support around 24,590, which coincided with yesterday's Fib 0.786 level, R1, and Previous Week Low (PWL).
These levels were well-defended throughout the session. Near the end, the index recovered ~80 points and closed at 24,649.55, close to yesterday’s Fib 0.5.
Can we consider today's move a retracement or a pullback of yesterday's move?
Same as Monday, today’s action stayed inside the previous session’s range, forming an Inside Bar. Now it appears as a Double Inside Bar on the daily chart.
📉 5 Min Time Frame Chart with Intraday Levels
📉 Daily Time Frame Chart with Intraday Levels
🕯 Daily Candle Breakdown
Open: 24,720.25
High: 24,733.10
Low: 24,590.30
Close: 24,649.55
Change: −73.20 (−0.30%)
Candle Structure Breakdown:
🔴 Red Candle (Close < Open):
24,720.25 − 24,649.55 = 70.70 points
🔼 Upper Wick:
24,733.10 − 24,720.25 = 12.85 points
🔽 Lower Wick:
24,649.55 − 24,590.30 = 59.25 points
Interpretation:
After a flat open, the index tried to move higher but faced resistance near 24,730, then reversed.
Buying interest was seen near the 24,590 zone, but sellers remained in control.
It closed below the open with a decent lower wick, indicating some buying support but overall weakness.
Candle Type:
🕯 A pullback candle with a moderate real body and long lower wick – suggests buyers attempted to support the fall, but sellers dominated.
🛡 5 Min Intraday Chart
⚔️ Gladiator Strategy Update
ATR: 202.71
IB Range: 139.95 → 🟠 Medium
Market Structure: Balanced
Trade Summary:
❌ No entry triggered by system
📌 Support & Resistance Levels
🔼 Resistance Zones:
24,725 ~ 24,735
24,780 ~ 24,795
24,860 ~ 24,880
🔽 Support Zones:
24,675 ~ 24,660
24,620
24,542 ~ 24,535
24,500
24,470 ~ 24,460
🧠 Final Thoughts
Today's double inside bar structure signals contraction and indecision — markets are waiting for a decisive breakout.
“The tighter the coil, the bigger the breakout.”
Keep an eye on these tight ranges. Patience before power!
✏️ Disclaimer
This is just my personal viewpoint. Always consult your financial advisor before taking any action.
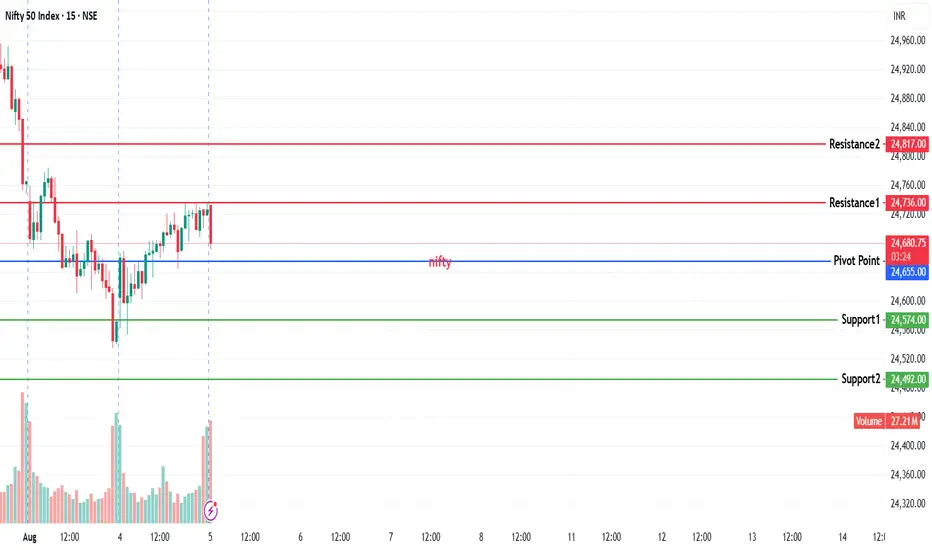
NIFTY KEY LEVELS FOR 05.08.2025NIFTY KEY LEVELS FOR 05.08.2025
If the candle stays above the pivot point, it is considered a bullish bias; if it remains below, it indicates a bearish bias. Price may reverse near Resistance 1 or Support 1. If it moves further, the next potential reversal zone is near Resistance 2 or Support 2. If these levels are also broken, we can expect the trend.
If the range(R2-S2) is narrow, the market may become volatile or trend strongly. If the range is wide, the market is more likely to remain sideways
📢 Disclaimer
I am not a SEBI-registered financial adviser.
The information, views, and ideas shared here are purely for educational and informational purposes only. They are not intended as investment advice or a recommendation to buy, sell, or hold any financial instruments.
Please consult with your SEBI-registered financial advisor before making any trading or investment decisions.
Trading and investing in the stock market involves risk, and you should do your own research and analysis. You are solely responsible for any decisions made based on this research.
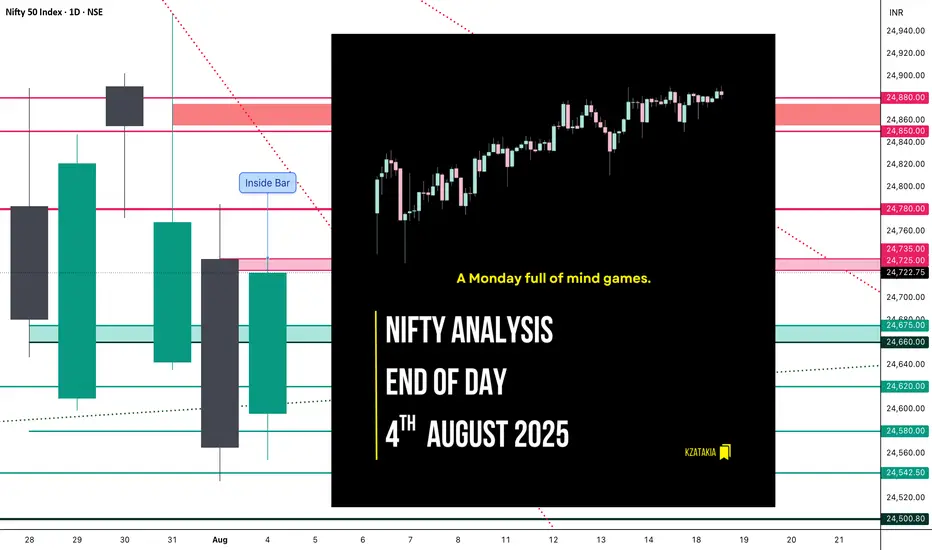
Nifty Analysis EOD – August 4, 2025 – Monday🟢 Nifty Analysis EOD – August 4, 2025 – Monday 🔴
A Monday full of mind games.
Nifty opened with a slight positive gap and immediately tested the TC of CPR, but that optimism didn’t last long — sharp rejection took it to day’s low (24,554). What followed was a rollercoaster: a 100-point recovery, a 50-point pullback — all within 10 minutes. This wild price action defined the rest of the day.
Throughout the session, Nifty remained trapped within the CPR zone. Both sides experienced multiple fakeouts, especially around initial balance (IB) zones. Even when prices nudged toward R1, repeated failed attempts to break above reflected the market’s indecisiveness. The day finally closed near the high, but conviction was still lacking.
Many option buyers likely struggled due to deceptive shadows and unexpected fractal breakouts. The entire price action stayed within Friday’s range — forming an Inside Bar structure on the daily chart. This suggests a potential range breakout trade tomorrow.
The market faced resistance near the Fibonacci 0.618–0.786 retracement of the prior fall — aligning with 24,740–24,780 zones. A close above 24,780 tomorrow could shift momentum back in the bulls’ favour. If not, bears still hold the upper ground.
📈 5 Min Time Frame Chart with Intraday Levels
📉 Daily Time Frame Chart with Intraday Levels
📊 Daily Candle Breakdown
Open: 24,596.05
High: 24,736.25
Low: 24,554.00
Close: 24,722.75
Change: +157.40 (+0.64%)
Candle Type:
🟢 Bullish Marubozu-like — reflects a strong control by buyers after early weakness.
Structure Breakdown:
Real Body: 126.70 pts (Bullish)
Upper Wick: 13.50 pts (Minor resistance near close)
Lower Wick: 42.05 pts (Early dip got bought aggressively)
Key Insight:
Closed near the high of the day — positive bias for tomorrow
Inside Bar formed – Expect a breakout trade
24,780+ closing will turn sentiment bullish
🛡 5 Min Intraday Chart
⚔️ Gladiator Strategy Update
ATR: 209.36
IB Range: 115.95 → Medium
Market Structure: Balanced
Trade Summary:
🕚 11:30 AM – Long Entry → SL Hit
🕛 12:30 PM – Long Entry → SL Hit
🕐 13:10 PM – Short Entry → SL Hit
Tough day — strategy got chopped in noise-heavy moves.
🔍 Support & Resistance Levels
Resistance Zones:
24,725 ~ 24,735
24,780 ~ 24,795
24,860 ~ 24,880
Support Zones:
24,675 ~ 24,660
24,620
24,542 ~ 24,535
24,500
24,470 ~ 24,460
💭 Final Thoughts
"Markets love to test your patience before they reward your conviction."
Today was a lesson in restraint — avoid overtrading when structure lacks clarity. Inside bar gives us a clean slate for tomorrow. Let price lead.
✏️ Disclaimer
This is just my personal viewpoint. Always consult your financial advisor before taking any action.
Good comeback candle by Nifty today. Nifty fought back against the Tariff odds today and gained 157.4 points. The combination of Friday's candle and today's candle are forming a Bullish Harami kind of pattern. Harami in Japanese means pregnant woman. Usually this is a Bullish pattern but it requires a follow up positive candle in its support. So if we get a positive candle tomorrow then we can consider Friday's low as a good temporary support.
Supports for Nifty currently remain at: 24482 (Important Trend line resistance), 24317, 24186 (Father line support on daily chart), The zone between 23932 (final support, below this level Bears can take total control of the index).
Resistances for Nifty currently remain at: 24802, 24906 (Mother line resistance on daily chart), 25007, 25249-25346 (Important trend line resistance zone, a closing above 25346 will give control of the index to Bulls).
Disclaimer: The above information is provided for educational purpose, analysis and paper trading only. Please don't treat this as a buy or sell recommendation for the stock or index. The Techno-Funda analysis is based on data that is more than 3 months old. Supports and Resistances are determined by historic past peaks and Valley in the chart. Many other indicators and patterns like EMA, RSI, MACD, Volumes, Fibonacci, parallel channel etc. use historic data which is 3 months or older cyclical points. There is no guarantee they will work in future as markets are highly volatile and swings in prices are also due to macro and micro factors based on actions taken by the company as well as region and global events. Equity investment is subject to risks. I or my clients or family members might have positions in the stocks that we mention in our educational posts. We will not be responsible for any Profit or loss that may occur due to any financial decision taken based on any data provided in this message. Do consult your investment advisor before taking any financial decisions. Stop losses should be an important part of any investment in equity.

Nifty levels - Aug 05, 2025Nifty support and resistance levels are valuable tools for making informed trading decisions, specifically when combined with the analysis of 5-minute timeframe candlesticks and VWAP. By closely monitoring these levels and observing the price movements within this timeframe, traders can enhance the accuracy of their entry and exit points. It is important to bear in mind that support and resistance levels are not fixed, and they can change over time as market conditions evolve.
The dashed lines on the chart indicate the reaction levels, serving as additional points of significance to consider. Furthermore, take note of the response at the levels of the High, Low, and Close values from the day prior.
We hope you find this information beneficial in your trading endeavors.
* If you found the idea appealing, kindly tap the Boost icon located below the chart. We encourage you to share your thoughts and comments regarding it.
Wishing you success in your trading activities!
NIFTY KEY LEVELS FOR 04.08.2025NIFTY KEY LEVELS FOR 04.08.2025
If the candle stays above the pivot point, it is considered a bullish bias; if it remains below, it indicates a bearish bias. Price may reverse near Resistance 1 or Support 1. If it moves further, the next potential reversal zone is near Resistance 2 or Support 2. If these levels are also broken, we can expect the trend.
If the range(R2-S2) is narrow, the market may become volatile or trend strongly. If the range is wide, the market is more likely to remain sideways
📢 Disclaimer
I am not a SEBI-registered financial adviser.
The information, views, and ideas shared here are purely for educational and informational purposes only. They are not intended as investment advice or a recommendation to buy, sell, or hold any financial instruments.
Please consult with your SEBI-registered financial advisor before making any trading or investment decisions.
Trading and investing in the stock market involves risk, and you should do your own research and analysis. You are solely responsible for any decisions made based on this research.
Nifty Extends Losing Streak: Is a Dead Cat Bounce Coming?The Nifty 50 dropped for the fifth week in a row, losing around 1.5%. Sectors like banks, IT, and consumer stocks are under pressure, and there are no big positive news to lift the market right now.
◉ Why is the Market Falling?
● Poor Q1 Results
Many big companies, especially in banking and IT, reported weaker-than-expected earnings. This disappointed investors and led to selling.
● U.S.–India Trade Trouble
The U.S. has added a 25% tax on Indian exports starting August 1. The two countries couldn’t agree on some trade issues, especially related to agriculture and dairy. This is bad news for export-focused companies.
● Weak Rupee
The rupee is near record lows against the U.S. dollar. This is because foreign investors are pulling money out of India. A weak rupee hurts sectors like IT and pharma, which earn in dollars.
◉ What the Charts Say?
The market has had a tough 5 weeks, but now it’s near a strong support level. This means a short-term bounce (dead cat bounce) is possible — a small recovery before another fall.
● Support at 24,500
There’s a large number of put option writers at this level. This means many traders are confident that Nifty won’t fall below 24,500 — so they’re willing to take that risk. This builds a strong support zone.
● Resistance at 24,700–24,800
There’s heavy call writing in this range. That means traders are betting Nifty won’t go above these levels. As a result, this area acts like a short-term ceiling or resistance.
Expect the Nifty to stay between these levels coming week unless some major news changes the game.
◉ Suggested Strategy
● For Traders: Stay cautious. Avoid aggressive long positions unless Nifty reclaims 25,000 decisively. Look for shorting opportunities near resistance zones with strict stop losses.
● For Investors: Stick to quality. Defensive pockets like FMCG, utilities, and select pharma may offer stability amid broader volatility.

Nifty levels - Jul 04, 2025Nifty support and resistance levels are valuable tools for making informed trading decisions, specifically when combined with the analysis of 5-minute timeframe candlesticks and VWAP. By closely monitoring these levels and observing the price movements within this timeframe, traders can enhance the accuracy of their entry and exit points. It is important to bear in mind that support and resistance levels are not fixed, and they can change over time as market conditions evolve.
The dashed lines on the chart indicate the reaction levels, serving as additional points of significance to consider. Furthermore, take note of the response at the levels of the High, Low, and Close values from the day prior.
We hope you find this information beneficial in your trading endeavors.
* If you found the idea appealing, kindly tap the Boost icon located below the chart. We encourage you to share your thoughts and comments regarding it.
Wishing you success in your trading activities!

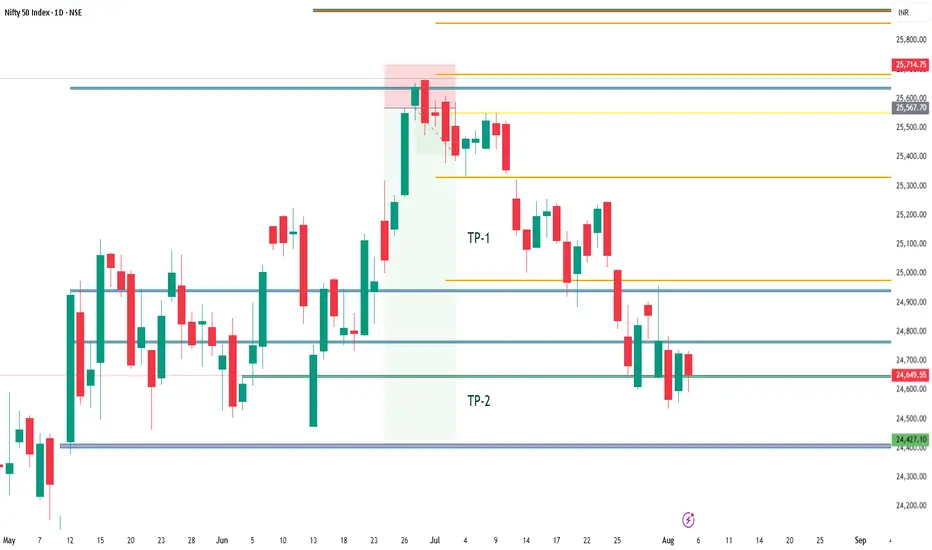
Nifty : Technical levels metAs shared last week the nifty support 24510 , 24850 levels were worked as support exactly.
Now we may see sideways market and range bounded moves.
Sharing fresh levels:
Support : 24460
Resistance: 24660, 24850

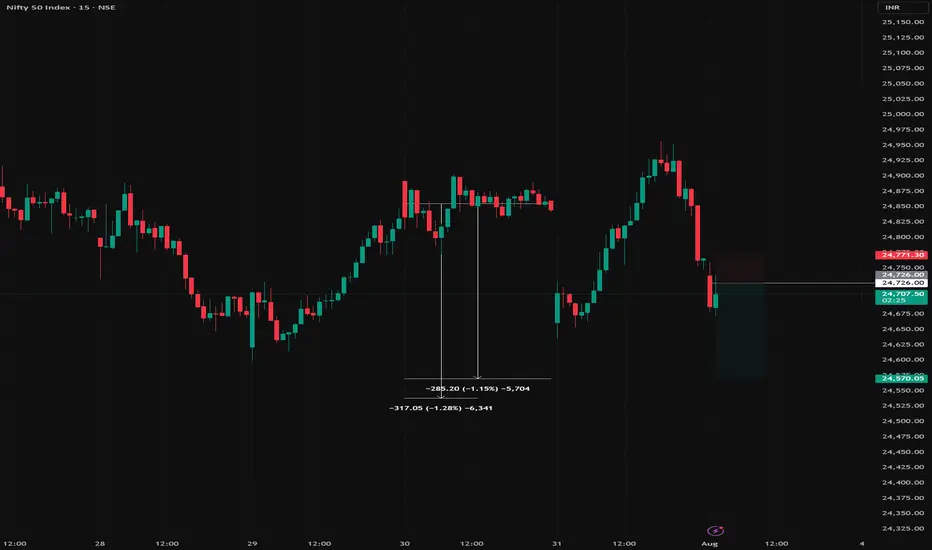
Nifty Analysis EOD – August 2, 2025 – Friday🟢 Nifty Analysis EOD – August 2, 2025 – Friday 🔴
Trapped at the Top, Slammed at the Close – Bulls Burnt Out!
🗓️ Nifty Summary
With the continuation of yesterday's hidden weakness, today's session gave early hope but ended with a bearish surprise. Nifty opened near the key support zone of 24,735 ~ 24,725, hovered indecisively, then suddenly rallied to 24,780, trapping bulls just under resistance.
But the trap was set.
A sharp reversal followed as Nifty broke not just the day’s low, but also the previous day’s support zone of 24,660 ~ 24,675, pulling the index lower into the 24,565.35 close — the second lowest close since May 12.
A fierce 2–3 hour tug-of-war between bulls and bears took place in a tight 40–50 point range until 2:50 PM, when bulls gave up—leading to a 100+ point fall in the last half-hour. shocked many traders, especially those fatigued from the earlier choppy action.
Much like yesterday, both sides of the trade were available today.
Did you catch them?
Zoom Out View :
Today’s close is just 23 points above the June 3 close, wiping out nearly 59 sessions (81 days) of gain.
Will the zone of 24460 ~ 24542 provide support again, or are we headed for a retest of the 24000 ~ 23800 and 23200 ~ 22800 (Pattern Target and Virgin) range?
Yes, you read correctly 23200 ~ 22800…!
Not so soon…but eventually…!
wish you tell me crazy and hope I am wrong…!
📈 5 Min Time Frame Chart with Intraday Levels
📉 Daily Time Frame Chart with Intraday Levels
🕯️ Daily Candle Breakdown
Open: 24,734.90
High: 24,784.15
Low: 24,535.05
Close: 24,565.35
Change: −203.00 (−0.82%)
Candle Structure
🔴 Large bearish body (169.55 pts)
☁️ Moderate upper wick (49.25 pts)
⬇️ Short lower wick (30.30 pts)
Interpretation
Opened lower, climbed early but failed at 24,780+.
Selling dominated the rest of the session, closing near lows.
Moderate upper wick shows early bullish attempt was rejected.
Candle Type
Bearish Marubozu-like – clear seller dominance.
Key Insight
Sellers defended 24,780–24,800 zone.
Closing near 24,560 keeps the short-term bias bearish.
Next support: 24,500, 24,470 ~ 24460
⚠️ Bulls must reclaim 24,735+ on closing basis to neutralize sentiment.
🛡 5 Min Intraday Chart
⚔️ Gladiator Strategy Update
ATR: 212.37
IB Range: 87.55 → Medium
Market Structure: Balanced
Trades Triggered
🕙 10:05 AM – Long Entry → 🎯 Target Hit (R:R – 1:1)
🕚 11:09 AM – Short Entry → 🎯 Target Hit (R:R – 1:2)
🔍 Trade Summary
Both sides were offered—clean hit on long and solid breakdown on short. A Gladiator’s delight.
📊 Support & Resistance Levels
🔼 Resistance Zones
24620
24660 ~ 24675
24725 ~ 24735
24780 ~ 24795
24860 ~ 24880
🔽 Support Zones
24,542 ~ 24,535
24,500
24,470 ~ 24,460
24,380
💬 Final Thoughts
"Traps are laid where confidence is highest. Stay alert, stay flexible."
A textbook day where patience paid off — those who didn’t force trades were rewarded with clean moves in both directions.
✏️ Disclaimer
This is just my personal viewpoint. Always consult your financial advisor before taking any action.

Long Term Nifty Analysis.(With Economic Commentary). We saw phenomenal resistance by Indian markets today after the Tariff announcements. Nifty bounced back and at one point was 330 points above low of the day. However there was Profit booking and selling on bounce due to prevailing Tariff uncertainties and Nifty came of the peak to close at 24768. Even after losing a lot of ground which it gained it ended up 133 points from the low of the day. Nifty ended the day in the negative losing 87.6 points from yesterday's close. This was much better than estimation of many experts. We might not be out of the woods yet but nevertheless fight back was phenomenal.
Now coming to Tariffs. I am not an expert in economy but let us assume the worst case scenario that trade negotiations fail and this is the tariff stays at 25% + Penalty. Again assuming that we loose 50% of our exports to US due to this decision. Say tariff would apply to 50b worth goods exported by us to USA and we 25b worth business. The impact on GDP will be as under.
GDP Impact = 25b/3.7T= 0.0067 = 0.67% of our GDP will be shaved off..(Rough Estimate). So say our is say 6.5. Then we continue to grow at 5.9 or 5.8. (Again I am not an expert and this estimate is based on a lot of assumption). This loss of GDP can be covered by increasing local consumption or exploring other market. Enhancing ties with markets outside USA. Thus it is not something which is going to kill Indian markets. We survived 1991, We survived Covid, We survived, Ukraine - Russia war, Israel-Iran conflict, Operation Sindoor Lows so we will survive this too and continue thriving. India is destined to become 3rd Largest Economy and unless there are local / internal political mishaps or mess-ups our growth will continue.
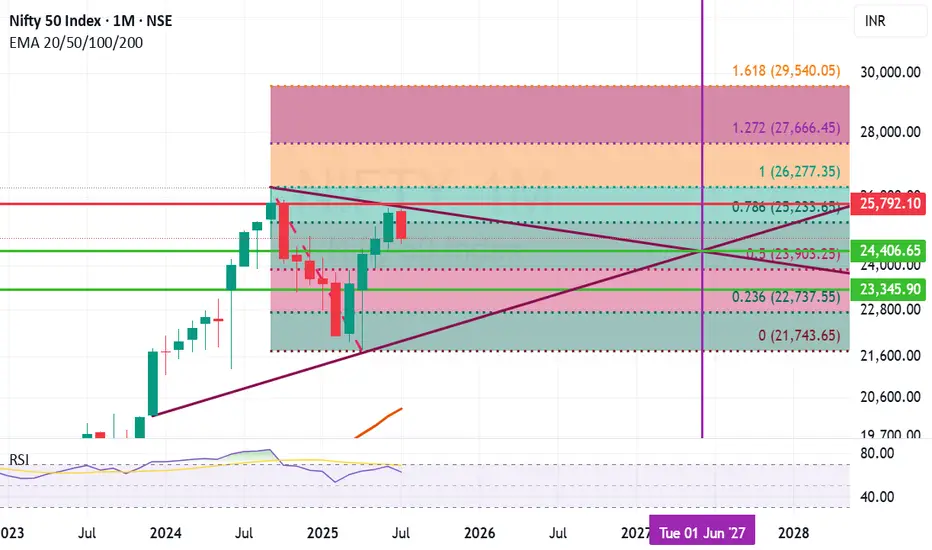
Fibonacci retracement of Nifty ant trend line analysis suggests few important support and resistance levels. The Horizontal line in the chart here suggests the cut off date. The chart suggests that:
Important Supports for Nifty remain at: 24406 (Mid Trend Support), 23903 (Important Fibonacci Support), 23345 (Important Candle support), (Below 23345 Nifty becomes very week and we will be in Bear grip where bears can drag Nifty down to 22737 or even 21742 in unlikely circumstances).
Important Resistance Levels: 25233 (Important Fibonacci resistance), 25792 (Important Candle resistance), 26277 (Previous All Time high), In the long term we might reach 27666 or even 29540 in close to 24 months time.
Conclusion:
Scenario 1) Indian Growth story continues and business thrive the optimistic range for Nifty by June 2027 seems to be the range between 26277 to 29540 or above.
Scenario 2) Indian economy faces changes and internal / external issues hamper progress the pessimistic range for Nifty by June 2027 seems to be anywhere between 23090 to 26277.
Scenario 3) Local or Global catastrophic events unfurl. Global and Indian economy takes a hit (Long drawn wars or local political leadership changes, Covid like events etc.) during this time frame 23090 to 21743 or below..(This does not seem likely but you never say never).
Disclaimer: The above information is provided for educational purpose, analysis and paper trading only. Please don't treat this as a buy or sell recommendation for the stock or index. The Techno-Funda analysis is based on data that is more than 3 months old. Supports and Resistances are determined by historic past peaks and Valley in the chart. Many other indicators and patterns like EMA, RSI, MACD, Volumes, Fibonacci, parallel channel etc. use historic data which is 3 months or older cyclical points. There is no guarantee they will work in future as markets are highly volatile and swings in prices are also due to macro and micro factors based on actions taken by the company as well as region and global events. Equity investment is subject to risks. I or my clients or family members might have positions in the stocks that we mention in our educational posts. We will not be responsible for any Profit or loss that may occur due to any financial decision taken based on any data provided in this message. Do consult your investment advisor before taking any financial decisions. Stop losses should be an important part of any investment in equity.
Nifty Analysis EOD – August 1, 2025 – Thursday🟢 Nifty Analysis EOD – August 1, 2025 – Thursday 🔴
🎢 Illusion Rally: What You See, Isn’t What It Was!
🧾 Nifty Summary
As we all expected, a negative gap-down opening occurred due to external news. Nifty opened 183 points lower, tested the 24,660–24,675 support zone, then rebounded sharply after a symmetrical triangle + VWAP breakout. The rally pierced through all key levels like a hot knife through butter, topping at 24,950, only to reverse with equal intensity. Closed at 24,765.
📌 Despite the technical structure, today’s move had no clear technical reasoning — more likely triggered by a mix of tariff news, confidence in Modi, weekly + monthly expiry, and manipulation.
📌 in spite of a bullish candle, strong upper rejection from 24,950 hints weakness. Candle appears bullish on colour, but bears dominated intraday close — forming a bearish Moboroshi Candle (illusion of strength).
📌 Bearish Moboroshi Candle Structure : close > open and close < Previous Close
🔍 Intraday Walk
📉 Gap down of 183 pts
🟢 Support held at 24,660–24,675
🔺 Symmetrical triangle + VWAP breakout
🚀 Sharp upmove to 24,950 zone
🔁 Reversal with same intensity
📉 Closed at 24,765 — below prior close
🖼 5 Min Time Frame Chart with Intraday Levels
📉 Daily Time Frame Chart with Intraday Levels
🕯 Daily Candle Breakdown
Open: 24,642.25
High: 24,956.50
Low: 24,635.00
Close: 24,768.35
Change: −86.70 (−0.35%)
Candle Structure:
✅ Green Candle (Close > Open) → +126.10 pts real body
⬆️ Upper Wick → 188.15 pts (Very Long)
⬇️ Lower Wick → 7.25 pts (Tiny)
Interpretation:
Opened near yesterday's low
Intraday sharp rally towards 24,950+
Faced strong selling at highs
Closed above open, but way below high — signals clear rejection
Candle Type:
📌 Bearish Moboroshi Candle — Appears bullish but hides weakness
🧠 Buyers strong initially, but sellers took control at the top
Key Insight:
Bulls need decisive close above 24,880–24,910
Else, expect drift back toward 24,660–24,675
🛡 5 Min Intraday Chart
⚔️ Gladiator Strategy Update
ATR: 208.29
IB Range: 93.95 → Medium
Market Structure: Unbalanced
Trades Triggered:
✅ 10:40 AM – Long Entry → Trailing Target Hit (R:R – 1:6.25)
📌 Trade Summary: Big R:R win today on breakout with trailing logic execution!
🧱 Support & Resistance Levels
🔺 Resistance Zones:
24,820 ~ 24,830
24,850
24,880 ~ 24,890
24,910
🔻 Support Zones:
24,780
24,725 ~ 24,715
24,660 ~ 24,650
24,620 ~ 24,600
💭 Final Thoughts
"When the move can’t be explained, the best position is caution."
Today's market behavior reinforces the idea that not all moves are technical. Keep your tools sharp, but don’t ignore contextual chaos.
✏️ Disclaimer
This is just my personal viewpoint. Always consult your financial advisor before taking any action.

Nifty levels - Aug 01, 2025Nifty support and resistance levels are valuable tools for making informed trading decisions, specifically when combined with the analysis of 5-minute timeframe candlesticks and VWAP. By closely monitoring these levels and observing the price movements within this timeframe, traders can enhance the accuracy of their entry and exit points. It is important to bear in mind that support and resistance levels are not fixed, and they can change over time as market conditions evolve.
The dashed lines on the chart indicate the reaction levels, serving as additional points of significance to consider. Furthermore, take note of the response at the levels of the High, Low, and Close values from the day prior.
We hope you find this information beneficial in your trading endeavors.
* If you found the idea appealing, kindly tap the Boost icon located below the chart. We encourage you to share your thoughts and comments regarding it.
Wishing you success in your trading activities!

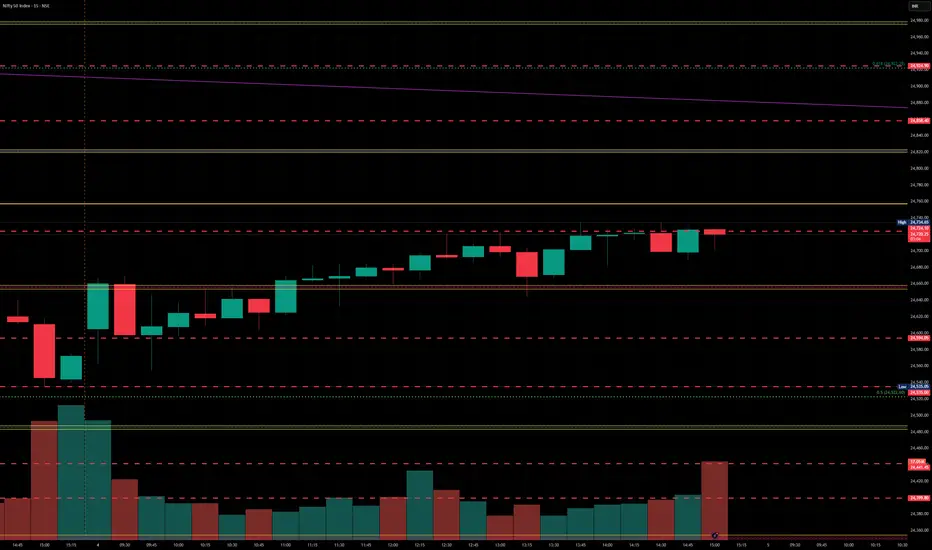
Nifty 24780 Pullback possible on next 1-2 days On 31 July, if someone watch closely price action he could capture Today up move coz Nifty gave almost same price action as 13 June let's try to find what is the Same thing: -
(A)31 July 2025: gap down is (-70%)
volume around 97 million
Bounce Back after gap down around +1%
(B) 13 June: gap down was (-80%)
Volume around 93 million
Bounce back after gap down around +1
On 13 June Nifty faced resistance of 24980 level then retraced. Due to such similarities, we can conclude that it could be pullback around 24780 level although I don't say market will behave same as before, I know every second of market is very dynamic and different from past days, but technical analysis always based on historical data. so, this is just assumption. take the trade on your own analysis & research.
