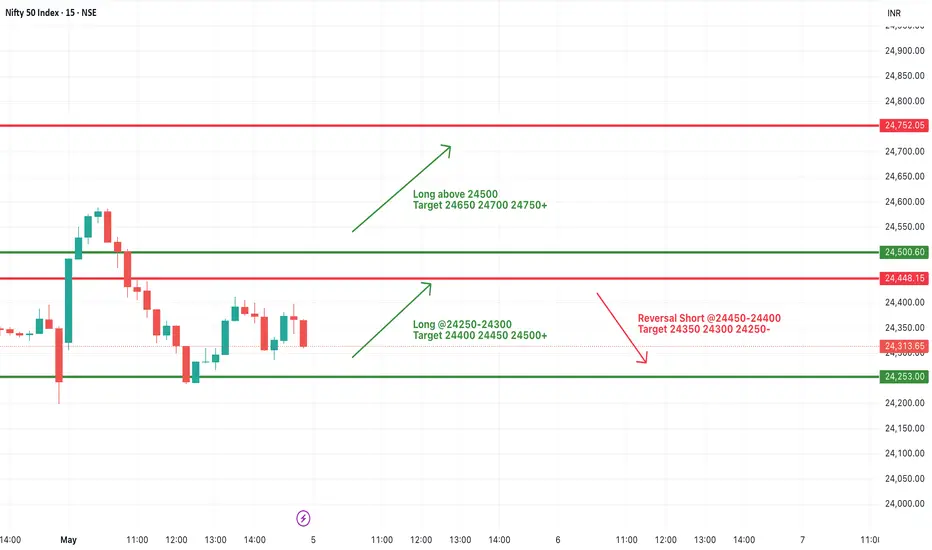
#NIFTY Intraday Support and Resistance Levels - 06/05/2025Flat opening in nifty in consolidation zone of 24450-24500 level. After opening any side breakout can gives strong rally in nifty. If nifty starts trading and sustain above 24500 level then expected upside rally upto 24750+ level in today's session. Downside below 24450 level there will be further downside possible upto the 24250 support level.
Niftylevels

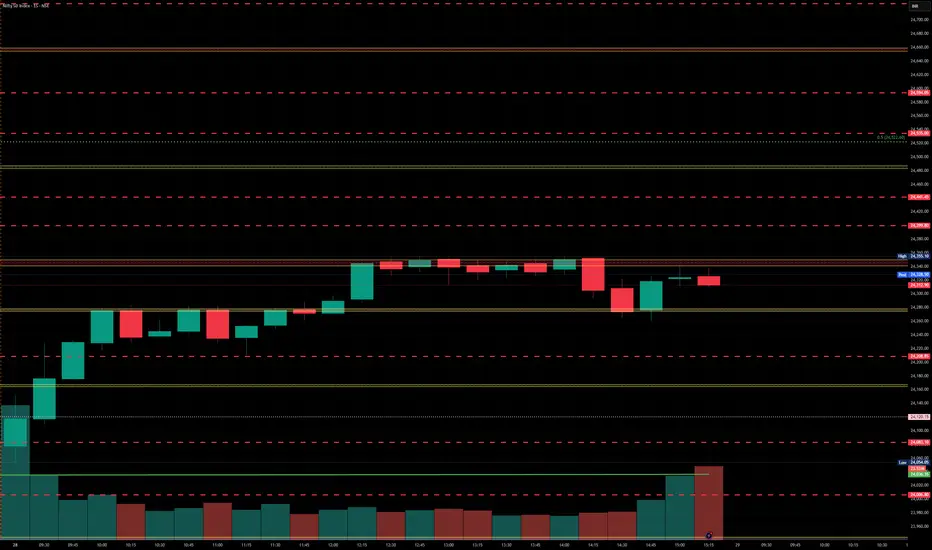
Nifty levels - May 06, 2025Nifty support and resistance levels are valuable tools for making informed trading decisions, specifically when combined with the analysis of 5-minute timeframe candlesticks and VWAP. By closely monitoring these levels and observing the price movements within this timeframe, traders can enhance the accuracy of their entry and exit points. It is important to bear in mind that support and resistance levels are not fixed, and they can change over time as market conditions evolve.
The dashed lines on the chart indicate the reaction levels, serving as additional points of significance to consider. Furthermore, take note of the response at the levels of the High, Low, and Close values from the day prior.
We hope you find this information beneficial in your trading endeavors.
* If you found the idea appealing, kindly tap the Boost icon located below the chart. We encourage you to share your thoughts and comments regarding it.
Wishing you success in your trading activities!

#NIFTY Intraday Support and Resistance Levels - 05/05/2025Gap up opening in nifty. Expected opening near 24450 level. After opening if nifty starts trading and sustain above 24500 level then possible strong upside rally in index upto 24750+ level in today's session. Downside 24250 level will act as a strong support for today session. Any major downside only expected below this support level.
Nifty 50 If you find this helpful and want more FREE forecasts in TradingView, Hit the 'BOOST' button
Drop some feedback in the comments below! (e.g., What did you find most useful?
How can we improve?)
Your support is appreciated!
Now, it's your turn!
Be sure to leave a comment; let us know how you see this opportunity and forecast.
Have a successful week
DISCLAIMER: I am NOT a SEBI registered advisor or a financial adviser. All the views are for educational purpose only

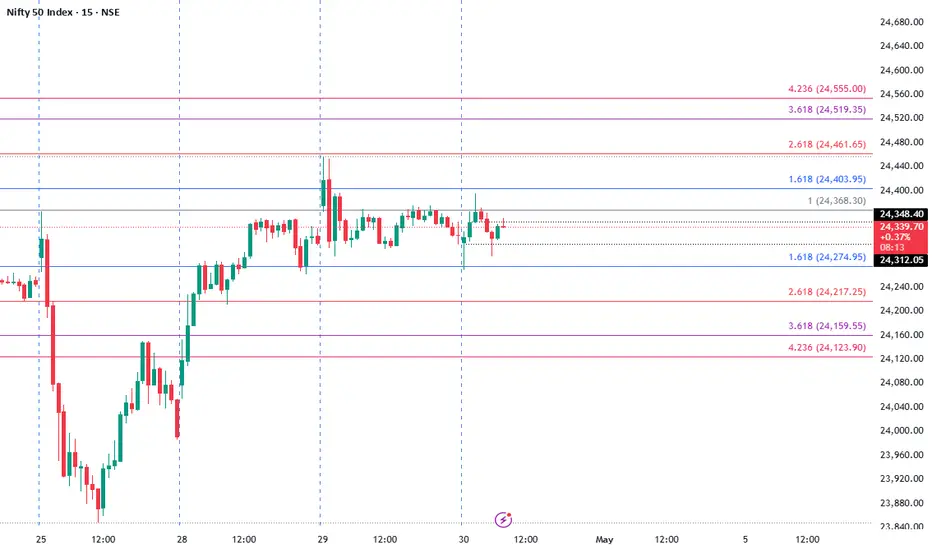
Nifty Important Fibonacci levels from previous month closeNifty Important levels for May 2025 from previous Month close price


Weekly Market Wrap Nifty, Mid & Small Caps, and S&P 500 OutlookNifty ended the week on a strong bullish note, closing at 24,346, up by 307 points from the previous week. The index traded within a tight range, hitting a high of 24,589 and a low of 24,054, aligning perfectly with my projected range of 24,650–23,400.
📌 Key Technical Levels to Watch:
Nifty closed just below a crucial Fibonacci resistance at 24,414.
A daily close above 24,414 next week could open the door for a sharp move towards the next major resistance at 24,770.
While my system suggests a broader range of 24,900–23,800, I personally hope for a healthy consolidation to cool off some momentum—paving the way for a stronger, faster rally in the coming weeks.
Caution Zone:
A break below 23,800 might signal the return of bears, potentially dragging the index down to test critical support at 23,200/23,100.
Midcap & Smallcap Watch:
I’ve received a lot of queries about Midcap and Smallcap indices, and here’s the honest truth—they remain in a 'no-trade' zone. Despite Nifty's strength, the rally hasn’t lifted most Mid & Small Cap stocks.
👉 Investors holding quality, fundamentally strong stocks in these segments should stay calm, but avoid high PE or overvalued stocks until we get a clear monthly buy signal on the charts.
🌍 Global Markets – S&P 500 Analysis:
The S&P 500 closed the week at 5,686, just above the strong Fibonacci level of 5,637. Sustaining above this level could lead to a rally toward 5,770/5,821. However, a failure to hold this support might trigger a 2–3% pullback, which could ripple across global markets, including India.
📣 Bottom Line:
Nifty bulls need a close above 24,414 to push higher.
Mid & Small Cap space remains tricky—stay selective.
Watch global cues, especially from the US, for broader market direction.
Stay nimble, stay informed. ✅

Nifty levels - May 05, 2025Nifty support and resistance levels are valuable tools for making informed trading decisions, specifically when combined with the analysis of 5-minute timeframe candlesticks and VWAP. By closely monitoring these levels and observing the price movements within this timeframe, traders can enhance the accuracy of their entry and exit points. It is important to bear in mind that support and resistance levels are not fixed, and they can change over time as market conditions evolve.
The dashed lines on the chart indicate the reaction levels, serving as additional points of significance to consider. Furthermore, take note of the response at the levels of the High, Low, and Close values from the day prior.
We hope you find this information beneficial in your trading endeavors.
* If you found the idea appealing, kindly tap the Boost icon located below the chart. We encourage you to share your thoughts and comments regarding it.
Wishing you success in your trading activities!

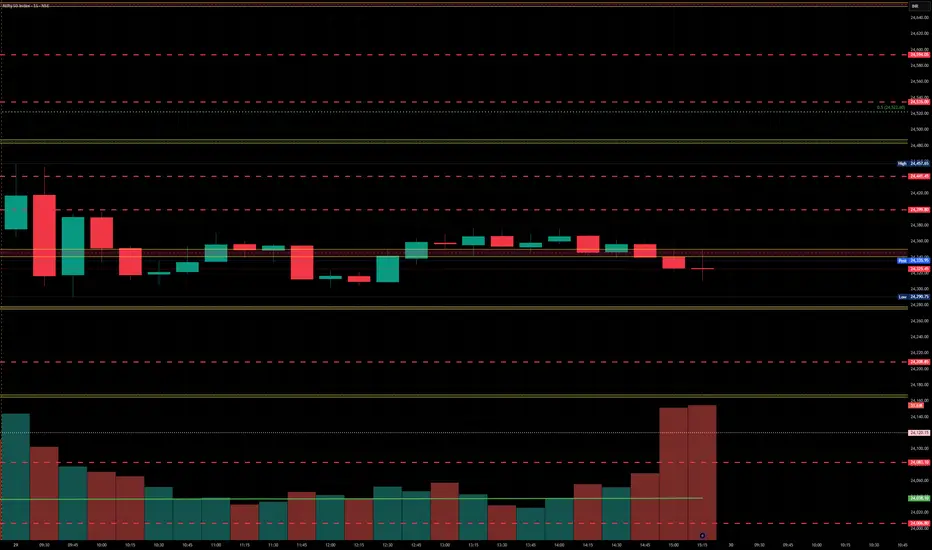
Nifty Analysis EOD - April 30, 2025 - Wednesday🟢 Nifty Analysis EOD - April 30, 2025 - Wednesday 🔴
🗓️ One more expiry day ended in suspense, surprise and a last-minute spike!
📊 Nifty Summary
Nifty opened slightly green at 24,342, just 6 points above the previous close. A quick dip below the previous day’s low was swiftly recovered, triggering a rally towards 24,400. However, most of the session turned into a slow grind between a narrow 40-point range as both bulls and bears hesitated.
As is typical on expiry days, a sudden burst in the last 5 minutes added 198 points to the move — a nightmare for option sellers but a jackpot for Hero-Zero traders. The day’s true intraday close stood at 24,243, while settlement was at 24,334, reflecting a wide 90-point gap traders must factor in.
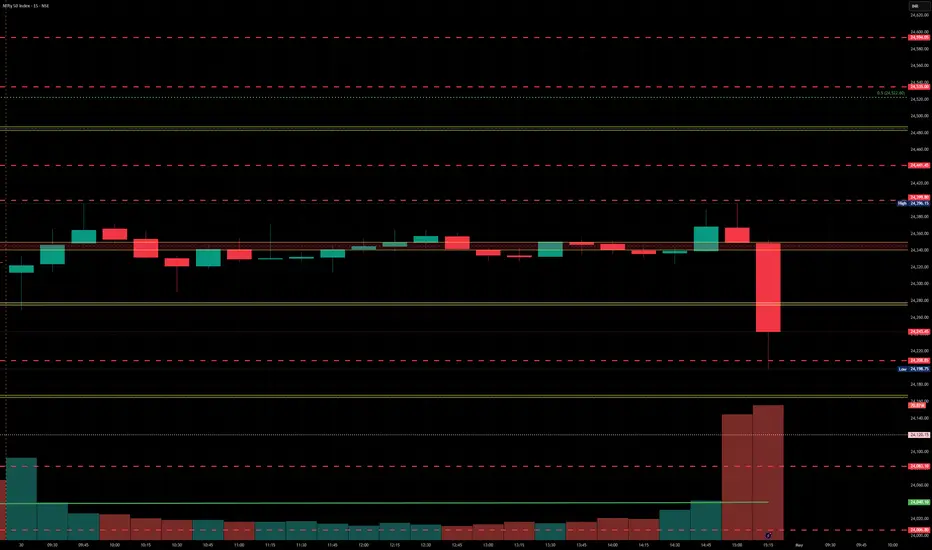
🕔 Intraday 5 Min Time Frame Chart
🔁 Intraday Walk
🔹 Opened at 24,342 with a quick drop below PDL, then rebounded.
🔹 Rallied to 24,400 within the first 30 minutes.
🔹 Ranged for hours between 24,330–24,370 with no clear breakout.
🔹 A 198-point spike in the final 30 minutes caught most off-guard.
🔹 True intraday close = 24,243 vs. settlement = 24,334 → Huge difference!
⏱ Intraday 75 Min Time Frame Chart
📐 75-Min Chart Analysis / Zone Commentary
The last 3 sessions showed repeated failed attempts to close above 24,365 (the previous week's high). A symmetrical triangle was clearly visible and delivered a classic trap: a false breakout, a liquidity grab, and an immediate pullback to meet the pattern’s target. Unfortunately, the real breakout happened around 2:35 PM — just after most had packed up for expiry!
📅 Daily Time Frame Chart
🕯️ Daily Candle Breakdown
Today’s Candle Type: Spinning Top (Bearish Tilt)
Today’s OHLC:
Open: 24,342.05
High: 24,396.15
Low: 24,198.75
Close: 24,334.20
Change: –1.75 (–0.01%)
Know How of Candle Type:A Spinning Top reflects indecision — a small body with long shadows shows a battle between buyers and sellers with no clear winner.
Key Observation:
Real Body = 7.85 points → Minimal net movement
Upper Wick = 54.10 pts
Lower Wick = 143.30 pts → Stronger buyer defense but weak follow-through
What It Implies:Buyers showed strength at lower levels but couldn't close strong. Despite the strong lower wick, the red close tilts sentiment mildly bearish. The breach of previous day’s low confirms weakness unless reversed tomorrow.
⚔️ Gladiator Strategy Update
Strategy Parameters:
ATR: 313.49
IB Range: 126.40
IB Category: Medium IB
Market Structure: Balanced
Trade Highlights:
📉 No Trade Triggered
Gladiator system remained silent today amidst the choppy expiry behavior.
🔮 What’s Next? / Bias Direction
Although the larger bias had been mildly bullish, the breach of the 24,290 low shifts the short-term view to slightly bearish. However, one more session confirmation is needed before taking any aggressive stance.
📌 Support & Resistance Levels
🔺 Resistance Zones:
24,290 (PDL)
24,330 ~ 24,360 (Immediate hurdle)
24,396 (CDH)
24,457 (PDH)
24,480 ~ 24,540 (Incl. 24,500 psych level)
24,800
🔻 Support Zones:
24,190 ~ 24,225
24,120
24,050
24,000 ~ 23,950
23,820
23,710 ~ 23,660
23,500
23,410 ~ 23,370
23,215
💬 Final Thoughts
“Expiry days are for the patient and the prepared. Today was a perfect example of how calm waters can suddenly become tidal waves.”The pattern, structure, and volatility continue to show that structure is key — respect it when it holds, and adapt when it breaks.
✏️ Disclaimer ✏️
This is just my personal viewpoint. Always consult your financial advisor before taking any action.

NEXT -- >> 23,990 – 23,870 zone.On 30th April, Nifty traded in a rangebound manner, as reflected in the charts. It took support around the 24,200 level, highlighted in green. Any adverse geopolitical development, such as an incident involving PoK or Pakistan, could trigger a sharp decline, potentially pushing Nifty down to the 23,990 – 23,870 zone.
A decisive move on the upside is expected only above the 24,470 level.
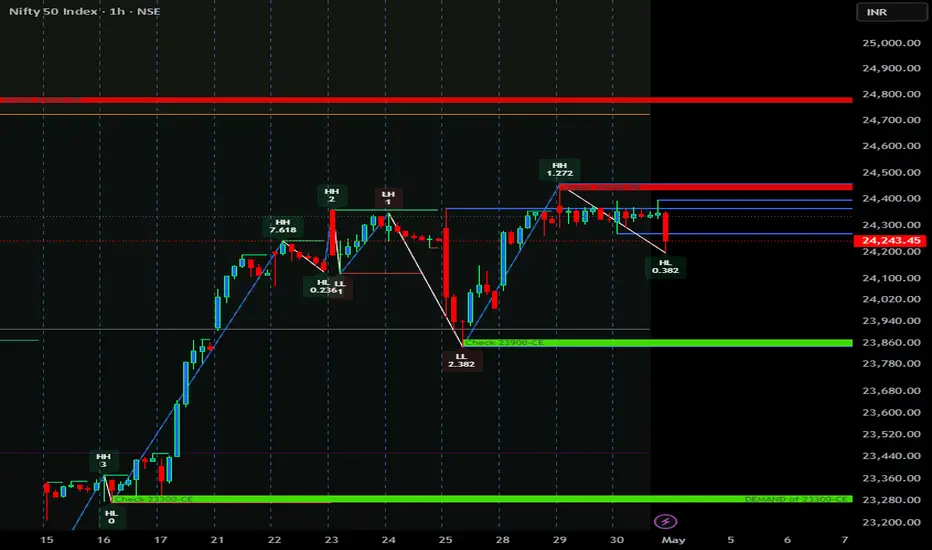
Nifty trying to break trendline resistance. As depicted yesterday we are near the trendline resistance. These trendline resistance like Mother and Father resistances are not easy to break but once broken they become a massive support zone. Nifty as we saw today is trying to break this trendline resistance which is there near 24359. Once this resistance will be crossed and we get a closing above the same we can see Nifty move swiftly towards 24538 and 24816. After closing above 24816 Nifty can move towards capturing 25K level back. Supports for Nifty remain at 23980 and 23708. Below 23708 we have the Mother and Father line support near 23365 and 23424. To know more about Mother Father and Small Child theory. To learn it to master it. Read my book. The Happy Candles Way To Wealth Creation available on Amazon in Paperback and Kindle version.
Disclaimer: The above information is provided for educational purpose, analysis and paper trading only. Please don't treat this as a buy or sell recommendation for the stock or index. The Techno-Funda analysis is based on data that is more than 3 months old. Supports and Resistances are determined by historic past peaks and Valley in the chart. Many other indicators and patterns like EMA, RSI, MACD, Volumes, Fibonacci, parallel channel etc. use historic data which is 3 months or older cyclical points. There is no guarantee they will work in future as markets are highly volatile and swings in prices are also due to macro and micro factors based on actions taken by the company as well as region and global events. Equity investment is subject to risks. I or my clients or family members might have positions in the stocks that we mention in our educational posts. We will not be responsible for any Profit or loss that may occur due to any financial decision taken based on any data provided in this message. Do consult your investment advisor before taking any financial decisions. Stop losses should be an important part of any investment in equity.

Nifty levels - May 02, 2025Nifty support and resistance levels are valuable tools for making informed trading decisions, specifically when combined with the analysis of 5-minute timeframe candlesticks and VWAP. By closely monitoring these levels and observing the price movements within this timeframe, traders can enhance the accuracy of their entry and exit points. It is important to bear in mind that support and resistance levels are not fixed, and they can change over time as market conditions evolve.
The dashed lines on the chart indicate the reaction levels, serving as additional points of significance to consider. Furthermore, take note of the response at the levels of the High, Low, and Close values from the day prior.
We hope you find this information beneficial in your trading endeavors.
* If you found the idea appealing, kindly tap the Boost icon located below the chart. We encourage you to share your thoughts and comments regarding it.
Wishing you success in your trading activities!
Nifty Momentum may lead it to 44000 levelNifty monthly chart is showing a rapid growth since last 5 years, this momentum may lead it to these levels 28000, 36000 and 44000 levels.

#Nifty 30th April levels checkout is levels #Nifty 30th April levels checkout special my levels
100 percent working levels and giving weekly levels also
check and tell everyone
#NIFTY Intraday Support and Resistance Levels - 30/04/2025Gap up opening expected in nifty near 24450 level. Currently nifty consolidating in the range of 24250-24500 level. After opening if nifty starts trading and sustain above 24500 level then possible strong upside rally towards the 24750+ level in today's session. 24250 level will act as a strong support for today's session. Any major downside only expected if nifty starts trading below 24200 level. This downside can goes upto 24000 level.

Bank nifty Fibonacci support at 50-61%Bank Nifty formed a double top around the 56,000 mark in the morning session and did not retest that level throughout the trading day.
In fact, it made a lower high and closed near a strong support zone around 55,300. With the market holiday on May 1st and upcoming news flow, charts suggest a possible further correction towards the 54,500–54,580 range.

Nifty Analysis EOD - April 29, 2025🟢 Nifty Analysis EOD - April 29, 2025🔴
One more day passed under uncertainty... Indecision takes the driver’s seat.
📈 Market Summary
Nifty opened on a positive note at 24,370, gaining 42 points, and swiftly climbed to an intraday high of 24,457.65. But the enthusiasm didn’t last long — sellers stepped in and pushed it down, filling the opening gap. The index found support near 24,290, and attempted a bounce, but once again failed to clear the critical 24,330–24,360 resistance zone.
📌 Intraday 5 Min Time FrameChart
The rest of the session saw price action trapped within a narrow 70-point range — a frustrating day for breakout traders or option buyers.
🔹 Impatient option buyers may have been trapped, stuck in hopes of a breakout.
🔹 Patient traders probably stayed away.
🔹 Scalpers and option sellers — this was your playground today.
📌 75 Min Time FrameChart
On the 75-minute chart, once again, rejection is clearly visible from the 24,330 ~ 24,360 zone. Until we see a decisive close above 24,365, this zone will continue to command respect in our trade plans.
📌 Daily Time Frame Chart
🕯 Daily Candle Structure
Candle Type: Spinning Top — a classic indecision candle
OHLC:
Open: 24,370.70
High: 24,457.65
Low: 24,290.75
Close: 24,335.95
Change: +7.45 points (+0.03%)
🔍 Candle Breakdown:
Real Body:
Small red body of -34.75 pts (close < open) → Indicates lack of strong directional move.
Upper Wick: 86.95 pts
Lower Wick: 79.95 pts
This candlestick reflects market hesitation, especially significant after a strong uptrend. Bulls and bears fought for control, but neither side won convincingly.
🧠 What the Spinning Top Tells Us:
Appears after a strong move → Suggests loss of momentum or possible pause
Small body + long wicks = Indecision
Needs confirmation in the next session
🔮 What Next?
Today’s spinning top doesn’t give a clear directional cue. However, context matters:
A close above CPR and previous session tilts the bias slightly bullish.
Bullish scenario: A breakout above 24,460 may resume the upward trend.
Bearish scenario: A breakdown below 24,040 could open the door for a pullback.
As always — trade with preparation, not prediction.
⚔️ Gladiator Strategy Update
ATR: 326.39
IB Range: 166.9 (Medium IB)
Market Structure: Imbalanced
Trade Highlights:
Positional Trade: Long Triggered Yesterday 15:20 – 1:2 Target Achieved
Intraday: No trade triggered during the session
📈 Index Performance Snapshot
Nifty 50: +7 Points (+0.03%)
Bank Nifty: -42 Points (-0.07%)
Nifty 500: +11 Points (+0.05%)
Midcap: +148 Points (+0.27%)
Smallcap: +62 Points (+0.37%)
🔍 Key Levels to Watch
🛑 Resistance Zones:
24,330 ~ 24,360 (Immediate hurdle)
24,457 (Today’s High)
24,480 ~ 24,540 (24,500 psychological level inside this zone)
24,800
🛡 Support Zones:
24,290 (Today’s Low)
24,190 ~ 24,225 (Immediate support)
24,120
24,050
24,000 ~ 23,950
23,820
23,710 ~ 23,660
23,500
23,410 ~ 23,370
23,215
💭 Final Thoughts
Another day where the market teased both bulls and bears alike. But remember — uncertainty is not your enemy; it’s your signal to slow down. When the candle speaks in spinning tops, the trader listens in silence. Discipline and patience are still your best tools, especially when the market isn't shouting direction clearly.
Tomorrow is the Weekly expiry — so prepare for volatility and don’t let noise disrupt your clarity. Your trade setup is your edge — trust it.
✏️ Disclaimer:
This is just my personal viewpoint. Always consult your financial advisor before taking any action.

Nifty levels - Apr 30, 2025Nifty support and resistance levels are valuable tools for making informed trading decisions, specifically when combined with the analysis of 5-minute timeframe candlesticks and VWAP. By closely monitoring these levels and observing the price movements within this timeframe, traders can enhance the accuracy of their entry and exit points. It is important to bear in mind that support and resistance levels are not fixed, and they can change over time as market conditions evolve.
The dashed lines on the chart indicate the reaction levels, serving as additional points of significance to consider. Furthermore, take note of the response at the levels of the High, Low, and Close values from the day prior.
We hope you find this information beneficial in your trading endeavors.
* If you found the idea appealing, kindly tap the Boost icon located below the chart. We encourage you to share your thoughts and comments regarding it.
Wishing you success in your trading activities!
is selling being absorbing near 23350 level ?yesterday 27 April I mentioned that nifty must have to break & sustained 23350 level it happened today but long upper wick on hourly time with high volume been noticed showing selling pressure in market of course market bullish momentum still intact it respected the near 23800 level trading above 20 EMA but we need to wait more multiple testing for confirmation to continue upside journey so consolidation may happen in 2-3 days.

Nifty Elliott wave update for 29april Tuesday onwardsIn this Video I have explained Elliott wave analysis of Nifty on 3hour, 15 min chart and 5min chart in detail to conclude what are the possible scenarios possible in Nifty index from 29april Tuesday onwards.... Kindly watch full video for detail understanding. It will help you to understand how to use Elliott wave theory practically on charts.
Thank you for watching....

Nifty on the verge of Trendline Breakout. There is a major possibility of a Trendline Breakout amidst the rumblings on conflict with enemy nations. The main reason for Market rally today was Superb results posted by Reliance and a rally in PSU, Capital goods and defense related stocks. A lot of stocks that were oversold in the knee-jerk reaction on Friday also tried to catch-up. As the situation on the border remains tense we can have a sudden major decline as a reaction to the Geo-Political proceedings. Thus investors are asked to remains cautious and not to carry heavy derivative positions overnight. Even in the eventuality of a war actually happening one think of remaining invested in companies that can bounce back faster once the situation de-escalates.
Major Supports for Nifty on daily chart now remain at: 23988, 23708, 23415 (Major Father line support), 23325 (Major Mother Line Support) in case of Mother and Father line failing Bears can drag Nifty further down to 22875, 22142 and 21844.
Major Resistances For Nifty remain at: 24359 (Major Trend line resistance), 24538, 24816 (Is another major resistance on Fibonacci scale), If we get a closing above 24816 Nifty can easily flow towards 25183, 25399 and 25603.
Disclaimer: The above information is provided for educational purpose, analysis and paper trading only. Please don't treat this as a buy or sell recommendation for the stock or index. The Techno-Funda analysis is based on data that is more than 3 months old. Supports and Resistances are determined by historic past peaks and Valley in the chart. Many other indicators and patterns like EMA, RSI, MACD, Volumes, Fibonacci, parallel channel etc. use historic data which is 3 months or older cyclical points. There is no guarantee they will work in future as markets are highly volatile and swings in prices are also due to macro and micro factors based on actions taken by the company as well as region and global events. Equity investment is subject to risks. I or my clients or family members might have positions in the stocks that we mention in our educational posts. We will not be responsible for any Profit or loss that may occur due to any financial decision taken based on any data provided in this message. Do consult your investment advisor before taking any financial decisions. Stop losses should be an important part of any investment in equity.

Nifty Analysis EOD - 28th April 2025🟢 Nifty Analysis EOD - 28th April 2025 🔴
Nifty almost retraced 25th April’s fall — Back to Square One... What Next?
📈 Market Summary
Nifty almost retraced 25th April’s fall — Back to Square One... What Next?
As highlighted in previous sessions, the 24,330 ~ 24,360 zone once again proved to be a crucial resistance. Today, along with the past three sessions, we observed Nifty struggling to breach this wall — a fact clearly visible on the 75-minute time frame chart.
Now the big question:
➡️ Tomorrow, can Nifty decisively breach 24,365 and sprint towards 24,500?
Well, time will answer, but we must stay prepared for moves on either side.
Intraday Walk:
Nifty opened with a gap-up above the psychological 24,000 level at 24,070.
With a slow yet steady bullish pace, it hit a high of 24,355.
After touching this critical resistance, it spent almost 2 hours consolidating in the same zone.
Finally, it closed at 24,312, defending most of its intraday gains — a strong show of resilience by the bulls.
🕯 Daily Candle Structure
Today's Candle:
🟢 Strong Bullish Candle (Almost a Marubozu)
Open: 24,070.25
High: 24,355.10
Low: 24,054.05
Close: 24,328.50
Change: +289.15 points (+1.20%)
Key Observations:
The session opened slightly above yesterday’s close and dipped just marginally.
Buyers took charge from the very beginning, consistently pushing the index higher.
Close near the day's high signals robust bullish momentum.
The candle has a tiny lower shadow and minimal upper shadow, indicating persistent buying throughout the day.
What It Implies:
Clear bull dominance.
Willingness among buyers to step up even at higher levels.
If external cues remain supportive, momentum could continue into the next session.
🛡 Gladiator Strategy Update
ATR: 344.11
IB Range: 182.1 (Medium IB)
Market Structure: Balanced
Trade Highlights:
1st Trade: Long Entry triggered at 10:05 AM — SL Hit
2nd Trade: Long Entry triggered at 11:25 AM — 1:2 Target Achieved
Additional Trade (Discretionary Contra): Short Entry at 14:15 PM — 1:1.4 Target Achieved
🧾 Index Performance Snapshot
Nifty 50: +289 Points (+1.20%)
Bank Nifty: +768 Points (+1.41%)
Nifty 500: +254 Points (+1.16%)
Midcap: +870 Points (+1.62%)
Smallcap: +130 Points (+0.78%)
📍 Key Levels to Watch
Resistance Zones:
🔹 24,330 ~ 24,360 (Immediate hurdle)
🔹 24,480 ~ 24,540 (24,500 psychological level inside this zone)
🔹 24,800
Support Zones:
🔹 24,190 ~ 24,225 (Immediate support)
🔹 24,120
🔹 24,050
🔹 24,000 ~ 23,950
🔹 23,820
🔹 23,710 ~ 23,660
🔹 23,500
🔹 23,410 ~ 23,370
🔹 23,215
🎯 Final Thoughts
"Structure is key. When levels work, respect them. When they break, adapt."
The current structure indicates bulls have made a strong comeback, but remember — 24,330 ~ 24,360 remains the battleground. Only a decisive breakout above can ignite a rally towards 24,500+. Otherwise, we stay watchful for possible reversals.
Stay sharp, stay prepared!
✏️ Disclaimer ✏️
This is just my personal viewpoint. Always consult your financial advisor before taking any action.

Nifty levels - Apr 29, 2025Nifty support and resistance levels are valuable tools for making informed trading decisions, specifically when combined with the analysis of 5-minute timeframe candlesticks and VWAP. By closely monitoring these levels and observing the price movements within this timeframe, traders can enhance the accuracy of their entry and exit points. It is important to bear in mind that support and resistance levels are not fixed, and they can change over time as market conditions evolve.
The dashed lines on the chart indicate the reaction levels, serving as additional points of significance to consider. Furthermore, take note of the response at the levels of the High, Low, and Close values from the day prior.
We hope you find this information beneficial in your trading endeavors.
* If you found the idea appealing, kindly tap the Boost icon located below the chart. We encourage you to share your thoughts and comments regarding it.
Wishing you success in your trading activities!