Nifty Futures intraday trend analysis on April 7th & 8thAccording to my Trend Analysis, on 7th Nifty Futures is likely to bounce back and the raise will not sustain on April 8th. The levels provided in the chart are calculated without taking Gaps into account. In the first 15mts on 7th April, there is a bullish candle formation. Trade with Stop-Loss.
Niftylevels

Nifty levels - Apr 07, 2025Nifty support and resistance levels are valuable tools for making informed trading decisions, specifically when combined with the analysis of 5-minute timeframe candlesticks and VWAP. By closely monitoring these levels and observing the price movements within this timeframe, traders can enhance the accuracy of their entry and exit points. It is important to bear in mind that support and resistance levels are not fixed, and they can change over time as market conditions evolve.
The dashed lines on the chart indicate the reaction levels, serving as additional points of significance to consider. Furthermore, take note of the response at the levels of the High, Low, and Close values from the day prior.
We hope you find this information beneficial in your trading endeavors.
* If you found the idea appealing, kindly tap the Boost icon located below the chart. We encourage you to share your thoughts and comments regarding it.
Wishing you success in your trading activities!

Nifty Chart DevelopmentA beautiful Inverse Head & Shoulder pattern under formation on the daily chart of Nifty 50.
The support level stands in the range 22600-22800.
Do your own research before taking any financial decision.

Nifty Futures Intraday analysis for April 04, 2025Trend is bearish. These are the support levels if the bearish trend will continue for the day.
Trade with Stop Loss

Nifty levels - Apr 04, 2025Nifty support and resistance levels are valuable tools for making informed trading decisions, specifically when combined with the analysis of 5-minute timeframe candlesticks and VWAP. By closely monitoring these levels and observing the price movements within this timeframe, traders can enhance the accuracy of their entry and exit points. It is important to bear in mind that support and resistance levels are not fixed, and they can change over time as market conditions evolve.
The dashed lines on the chart indicate the reaction levels, serving as additional points of significance to consider. Furthermore, take note of the response at the levels of the High, Low, and Close values from the day prior.
We hope you find this information beneficial in your trading endeavors.
* If you found the idea appealing, kindly tap the Boost icon located below the chart. We encourage you to share your thoughts and comments regarding it.
Wishing you success in your trading activities!

#NIFTY Intraday Support and Resistance Levels - 03/04/2025Gap down opening expected in nifty. After opening if nifty starts trading below 23200 level then possible sharp downside rally upto 23000 level. Any bullish side rally can face resistance at 23450 level. Expected reversal from this level. Major upside movement only expected if nifty starts trading and sustain above 23500 level.


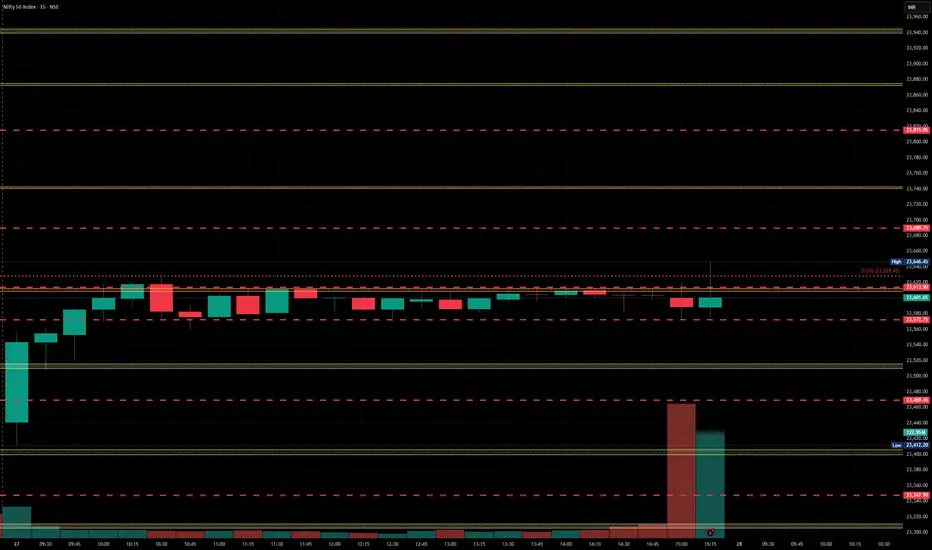
Nifty levels - Apr 03, 2025Nifty support and resistance levels are valuable tools for making informed trading decisions, specifically when combined with the analysis of 5-minute timeframe candlesticks and VWAP. By closely monitoring these levels and observing the price movements within this timeframe, traders can enhance the accuracy of their entry and exit points. It is important to bear in mind that support and resistance levels are not fixed, and they can change over time as market conditions evolve.
The dashed lines on the chart indicate the reaction levels, serving as additional points of significance to consider. Furthermore, take note of the response at the levels of the High, Low, and Close values from the day prior.
We hope you find this information beneficial in your trading endeavors.
* If you found the idea appealing, kindly tap the Boost icon located below the chart. We encourage you to share your thoughts and comments regarding it.
Wishing you success in your trading activities!

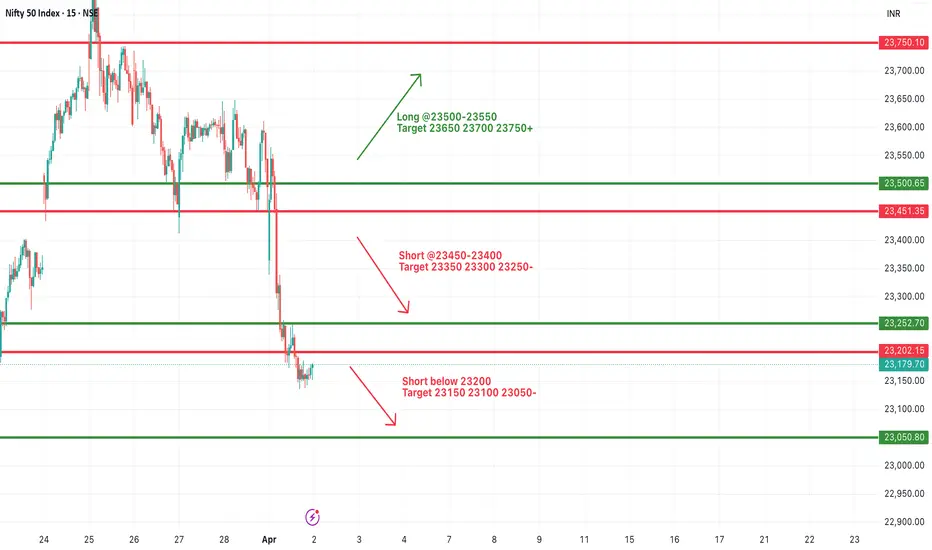
#NIFTY Intraday Support and Resistance Levels - 02/04/2025Today will be slightly gap up opening expected in nifty. After opening if nifty starts trading below 23200 level then expected sharp downside upto 23050 level in opening session. Upside 23450 level will act as a strong resistance for today's session. Any bullish side rally can reversal from this level.
Nifty Futures Daily view for April 2025Our Precision Scalper accurately identified the sell entry for Nifty Futures two days in advance, providing traders with a strategic edge. With minimal risk per trade, this powerful tool effectively captures trends and sustains them until completion. To maximize risk management, ensure a stop-loss is set for every entry.

Nifty Futures Daily analysis for April 2025I expect Nifty to be bearish for the month of April 2025. According to my analysis, my Dynamic Buy/Sell indicator confirmed sell signal today with Stop-Loss. After sell confirmation, I adjusted the EOD targets to 720 degrees and I foresee the Nifty Futures to drop down to target 2 or 3 by April 21st or 25th. It may not be a continuous fall, there may be a pull back before the fall.

NIFTY : Trading Levels and Plan for 31-Mar-2025📌 NIFTY Trading Plan – 31-Mar-2025
📊 Market Overview:
Nifty closed at 23,495, showing mixed sentiment near the Opening Support Zone (23,401 – 23,465). The market is at a crucial juncture, with potential bullish momentum above resistance levels, while breakdowns below key supports may trigger selling pressure.
This plan will help you react strategically to different opening scenarios, ensuring a favorable risk-reward ratio.
🔼 Scenario 1: Gap-Up Opening (100+ points above 23,600)
A gap-up above 23,600 signals bullish momentum, but for sustained upside, Nifty must stay above 23,642 – 23,842. Watch for rejection at resistance zones, as profit booking can lead to reversals.
✅ Plan of Action:
If Nifty sustains above 23,772, expect a move towards the next resistance at 23,925 – 23,990. A breakout above 23,990 could open doors for 24,050+.
If price faces rejection at 23,842, a pullback towards 23,642 → 23,495 is possible. If it breaks below 23,495, expect further downside.
Avoid aggressive longs inside 23,642 – 23,842, as this is a potential reversal zone. Wait for a decisive breakout or rejection confirmation.
🎯 Pro Tip: If the gap-up is filled within the first 15-30 minutes, it suggests weak buying pressure and increases the probability of a reversal.
⚖ Scenario 2: Flat Opening (Within ±100 points, around 23,500)
A flat opening near 23,495 indicates indecision. The market will take direction after the first few candles, so breakouts or breakdowns from key levels should be closely monitored.
✅ Plan of Action:
Upside case: If Nifty breaks and sustains above 23,642, it may head towards 23,772 → 23,925. Monitor price action near these resistance levels before entering fresh longs.
Downside case: If Nifty breaks below 23,495, it could test 23,336 → 23,164. A breakdown below 23,164 will shift the trend bearish.
Avoid trading inside the No Trade Zone (23,495 – 23,642), as price could consolidate before a breakout.
🎯 Pro Tip: In a flat opening, wait for a clear 15-minute candle close above or below key levels before entering trades.
🔽 Scenario 3: Gap-Down Opening (100+ points below 23,400)
A gap-down below 23,400 may indicate fresh selling pressure, making it crucial to observe whether buyers step in at support zones.
✅ Plan of Action:
If price sustains below 23,400, expect a decline towards 23,336 → 23,164. A breakdown below 23,164 could lead to a sharp fall towards 23,100.
If price finds support at 23,164 and rebounds, it may recover towards 23,336 → 23,495. A strong close above 23,495 will shift momentum back to the bulls.
Be cautious of bear traps – If the market gaps down but quickly recovers, it could trigger short covering, leading to a strong upside reversal.
🎯 Pro Tip: If the gap-down occurs near a strong buyer’s support zone, wait for a bullish price action confirmation before entering long trades.
⚠️ Risk Management Tips for Options Traders
🔹 Avoid over-leveraging – Use proper position sizing to manage risk.
🔹 Theta Decay Awareness – If the market consolidates, option premiums will erode rapidly.
🔹 Use Spreads for Protection – Instead of naked options, use spreads to limit risk and improve probability.
🔹 Trade at Key Levels – Avoid impulsive trades; focus on defined support and resistance zones.
📌 Summary & Conclusion
📍 Key Levels to Watch:
🟥 Resistance: 23,772 → 23,925 → 23,990
🟧 No Trade Zone: 23,495 – 23,642
🟩 Support: 23,336 → 23,164 → 23,100
🔸 Bullish Bias: Above 23,642, targeting 23,772 – 23,925
🔸 Bearish Bias: Below 23,400, expecting a fall towards 23,336 – 23,164
🔸 Neutral/Choppy: Inside 23,495 – 23,642, avoid unnecessary trades
🎯 Final Advice:
Stick to the structured trading plan and execute only at key levels.
Avoid emotional trading—wait for confirmation before entering trades.
The first 15-30 minutes after market open will provide better clarity—observe price action before committing to a trade.
📢 Disclaimer
I am not a SEBI-registered analyst. This trading plan is for educational purposes only. Please conduct your own research or consult a financial advisor before making any trades.

Nifty levels - Apr 02, 2025Nifty support and resistance levels are valuable tools for making informed trading decisions, specifically when combined with the analysis of 5-minute timeframe candlesticks and VWAP. By closely monitoring these levels and observing the price movements within this timeframe, traders can enhance the accuracy of their entry and exit points. It is important to bear in mind that support and resistance levels are not fixed, and they can change over time as market conditions evolve.
The dashed lines on the chart indicate the reaction levels, serving as additional points of significance to consider. Furthermore, take note of the response at the levels of the High, Low, and Close values from the day prior.
We hope you find this information beneficial in your trading endeavors.
* If you found the idea appealing, kindly tap the Boost icon located below the chart. We encourage you to share your thoughts and comments regarding it.
Wishing you success in your trading activities!

#NIFTY Intraday Support and Resistance Levels - 01/04/2025Flat or slightly gap down opening expected in nifty. After opening if nifty starts trading below 23450 level then possible strong downside rally upto 23250 level. Any upside movement only expected if nifty sustain above 23500 after opening session. Upside 23750 will act as strong resistance for today's session.

Nifty 50 Upcomming Fibonacci Retracement levels(April 2025)Nifty 50 important upcomming retacement levels in Day Timeframe.
Look for Gap filling
Important retracement fibinaci levels are marked
Important support and resistance is marked

Nifty levels - Apr 01, 2025Nifty support and resistance levels are valuable tools for making informed trading decisions, specifically when combined with the analysis of 5-minute timeframe candlesticks and VWAP. By closely monitoring these levels and observing the price movements within this timeframe, traders can enhance the accuracy of their entry and exit points. It is important to bear in mind that support and resistance levels are not fixed, and they can change over time as market conditions evolve.
The dashed lines on the chart indicate the reaction levels, serving as additional points of significance to consider. Furthermore, take note of the response at the levels of the High, Low, and Close values from the day prior.
We hope you find this information beneficial in your trading endeavors.
* If you found the idea appealing, kindly tap the Boost icon located below the chart. We encourage you to share your thoughts and comments regarding it.
Wishing you success in your trading activities!

NIFTY--@Manipulation??Nifty index is broken the trendline strongly...
Before going to break price a strong consolidation is given with a lot of liquidity lies below it...
@22400 levels
now price is exactly at the zone of resistance.
the resistance zone is lies at 24000-24300, after a strong movement to upside price is still not given any retracement...
Case1::
I am expecting either a strong retracement towards trendline.
the retracement should be in the form of correction with slower one.
Corrective pullback::
Case2::
After the liquidity above the 24000 and 24300, price has to give some retracement..
If we buy here it will completely becomes a manipulation....
Buying above the resistance zone is also a manipulation on topside...
If price breaks the resistance zone, then will wait for a correction towards the trendline areas.
Note::
So in order to buy the breakout of trendline the stoploss placement is very large...so with large stoploss will never go for buying...
the 2 possible buying areas are
1.breakout candle at the trendline
2.after the liquidity grab below the strong consolidation zone( before breakout of trendline.)
we have manipulation on both sides....if we go for long price will make an attempt of retracement as lot of liquidity lies below.
Better to look for short above the resistance zone(topside liquidity).If no retracement now.

NIFTY : Trading Levels and Plan for 28-Mar-2025📌 NIFTY Trading Plan – 28-Mar-2025
📊 Market Overview:
Nifty closed at 23,601, consolidating within a No Trade Zone after a strong uptrend. The market is at a critical juncture, and the price action at key levels will determine the next directional move.
This plan provides clear trade setups for different opening scenarios and helps you navigate market volatility with a structured approach.
🔼 Scenario 1: Gap-Up Opening (100+ points above 23,700)
A gap-up opening above 23,700 will push Nifty closer to the Last Intraday Resistance Zone (23,772). The key factor will be whether Nifty sustains above resistance or faces rejection.
✅ Plan of Action:
If Nifty sustains above 23,772, it can move towards the next resistance at 23,931. A breakout above 23,931 could trigger a rally towards 24,000+, but watch for profit booking at higher levels.
If price faces rejection at 23,772 and reverses, expect a pullback towards 23,650 → 23,600. A strong rejection here could lead to an intraday sell-off.
Avoid fresh longs inside 23,700 – 23,772, as this area may act as a profit-booking zone. Wait for confirmation before taking trades.
🎯 Pro Tip: If the gap-up is quickly filled within the first 15 minutes, it signals weak buying strength and increases the probability of an intraday correction.
⚖ Scenario 2: Flat Opening (Within ±100 points, around 23,600)
A flat opening suggests indecision among traders, and the market will likely take direction after the first few candles. The best strategy is to trade breakouts or breakdowns from key levels.
✅ Plan of Action:
Upside case: If Nifty breaks and sustains above 23,650, it may head towards 23,700 → 23,772. Observe the price action near resistance before taking fresh longs.
Downside case: If Nifty breaks below 23,520, it could test 23,450 → 23,300. A breakdown below 23,300 will turn the trend bearish.
Sideways caution: If Nifty remains inside the No Trade Zone (23,451 – 23,642), avoid taking trades as volatility could trap both buyers and sellers.
🎯 Pro Tip: In a flat opening scenario, wait for a clear 15-minute candle close above or below key levels before entering trades.
🔽 Scenario 3: Gap-Down Opening (100+ points below 23,500)
A gap-down below 23,500 could indicate profit booking or fresh selling pressure. The critical factor will be whether buyers defend key support zones.
✅ Plan of Action:
If price sustains below 23,500, expect a decline towards 23,300. A breakdown below 23,300 may accelerate selling towards the Buyer’s Support Zone (23,136 – 23,300).
If price finds support at 23,300 and rebounds, it may attempt a recovery towards 23,450 → 23,520. A strong close above 23,520 could shift momentum back to the bulls.
Be cautious of bear traps – If the market gaps down but quickly recovers, it could trigger short covering, leading to an upside reversal.
🎯 Pro Tip: If the gap-down occurs near a strong buyer’s support zone, wait for a bullish price action confirmation before entering long trades.
⚠️ Risk Management Tips for Options Traders
🔹 Avoid over-leveraging – Use proper position sizing to manage risk.
🔹 Theta Decay Awareness – If the market consolidates, option premiums will erode rapidly.
🔹 Use Spreads for Protection – Instead of naked options, use spreads to limit risk and improve probability.
🔹 Trade at Key Levels – Avoid impulsive trades; focus on defined support and resistance zones.
📌 Summary & Conclusion
📍 Key Levels to Watch:
🟥 Resistance: 23,772 → 23,931 → 24,000
🟧 No Trade Zone: 23,451 – 23,642
🟩 Support: 23,520 → 23,300 → 23,136
🔸 Bullish Bias: Above 23,772, targeting 23,931 – 24,000
🔸 Bearish Bias: Below 23,500, expecting a fall towards 23,300 – 23,136
🔸 Neutral/Choppy: Inside 23,451 – 23,642, avoid unnecessary trades
🎯 Final Advice:
Stick to the structured trading plan and execute only at key levels.
Avoid emotional trading—wait for confirmation before entering trades.
The first 15-30 minutes after market open will provide better clarity—observe price action before committing to a trade.
📢 Disclaimer
I am not a SEBI-registered analyst. This trading plan is for educational purposes only. Please conduct your own research or consult a financial advisor before making any trades.

Nifty Futures Intraday Trend on March 27, 2025I anticipate a bearish trend for tomorrow. 23719 looks like a strong resistance and the support levels are at 23441 and 23198 (If breaks 23 441).
I foresee a good bearish trading opportunity and I avoid all Buy Signals and Focus on my PUTs.
Ready to trade? Trade with proper stop-loss.

Nifty levels - Mar 28, 2025Nifty support and resistance levels are valuable tools for making informed trading decisions, specifically when combined with the analysis of 5-minute timeframe candlesticks and VWAP. By closely monitoring these levels and observing the price movements within this timeframe, traders can enhance the accuracy of their entry and exit points. It is important to bear in mind that support and resistance levels are not fixed, and they can change over time as market conditions evolve.
The dashed lines on the chart indicate the reaction levels, serving as additional points of significance to consider. Furthermore, take note of the response at the levels of the High, Low, and Close values from the day prior.
We hope you find this information beneficial in your trading endeavors.
* If you found the idea appealing, kindly tap the Boost icon located below the chart. We encourage you to share your thoughts and comments regarding it.
Wishing you success in your trading activities!
NIFTY : Levels and Plan for 27-Mar-2025📊 Market Context:
NIFTY closed at 23,464.30, experiencing a minor pullback after a previous uptrend. The index is currently at a crucial support zone, where price action will determine the next movement.
Let’s analyze the plan for different opening scenarios and structure our trades accordingly.
🔼 Scenario 1: Gap-Up Opening (100+ points above 23,590)
A gap-up above 23,590 will place NIFTY near its Opening Resistance. This level is important because it has previously acted as a supply zone, and bulls need strong momentum to sustain above it.
✅ Plan of Action:
If price sustains above 23,590, we can expect a bullish move towards the Last Intraday Resistance at 23,660. A breakout above this level may extend gains to 23,780+.
If price gets rejected from 23,590 and starts reversing, look for a shorting opportunity, targeting 23,501 → 23,464.
Avoid aggressive long trades inside the 23,590 – 23,660 zone unless there is a clear breakout with volume.
🎯 Pro Tip: If the gap-up is weak and fills within 15 minutes, it indicates profit booking, leading to a possible retracement.
⚖ Scenario 2: Flat Opening (Within ±100 points, around 23,464)
A flat opening suggests market indecision, requiring confirmation before entering a trade.
✅ Plan of Action:
Upside case: If NIFTY breaks above 23,501, it can move towards 23,590. Observe price action at this level before deciding on further longs.
Downside case: If NIFTY breaks below 23,464, expect a decline towards the Opening Support Zone (23,501 – 23,477). A breakdown below 23,477 could trigger a deeper fall to 23,297.
Neutral Zone: If the index trades between 23,464 – 23,501, it indicates a choppy market. Avoid unnecessary trades here.
🎯 Pro Tip: A flat opening often leads to fake breakouts in the first 15 minutes. Wait for a strong candle close before entering a position.
🔽 Scenario 3: Gap-Down Opening (100+ points below 23,350)
A gap-down below 23,350 will put NIFTY near its Last Intraday Support Zone (23,297 – 23,343). If this level fails, further downside is possible.
✅ Plan of Action:
If price sustains below 23,350, expect a test of 23,297. A breakdown here could lead to heavy selling towards 23,182 – 23,100 levels.
If price rebounds from 23,297, it could trigger a pullback towards 23,464. Watch price action at 23,464 – 23,501 for signs of rejection or continuation.
Be cautious of bear traps—if price quickly reverses after a sharp gap-down, it might indicate a short-covering rally.
🎯 Pro Tip: In a gap-down scenario, avoid panic selling. Watch for reversals from key support levels before initiating fresh shorts.
⚠️ Risk Management Tips for Options Traders
🔹 Avoid over-leveraging – Keep your position sizing disciplined to minimize potential losses.
🔹 Theta Decay Awareness – If the market consolidates, option premiums will erode quickly.
🔹 Hedge Your Trades – Use spreads instead of naked options to reduce risk.
🔹 Wait for Confirmation – Enter trades only after a breakout/breakdown is retested with volume.
📌 Summary & Conclusion
📍 Key Levels to Watch:
🟥 Resistance: 23,590 → 23,660 → 23,780
🟧 No Trade Zone: 23,501 – 23,464
🟩 Support: 23,501 → 23,297 → 23,182
🔸 Bullish Bias: Above 23,590, targeting 23,660 – 23,780
🔸 Bearish Bias: Below 23,350, expecting a fall towards 23,297 – 23,182
🔸 Neutral/Sideways: If price remains between 23,501 – 23,464, avoid unnecessary trades.
🎯 Final Advice:
Stick to the plan and trade only at key levels.
Avoid trading inside No Trade Zones.
Let the market settle for 15-30 minutes before making big moves.
📢 Disclaimer
I am not a SEBI-registered analyst. This trading plan is for educational purposes only. Please conduct your research or consult a financial advisor before trading.

Nifty Review & Analysis - DailyNifty opned at 23700 and couldn’t go higher trading in a range for most part of the morning session, then saw selling pressure and tested 23450 and closed in neagtive at 23486 down -0.7%
Price Action : - Bullish
Nifty closed Neagtive with some profit booking at highs.
Candle Pattern: - Bullish
Formed a Neagtive Bearish candle, Bearish untill recent highs taken out
Daily EMA Positioning: Bullish
10dEMA 23176
20dEMA 22980
50dEMA 23136
200dEMA 24080
EMA Trend:
Closed above 10dEma ,20dEma, 50DEMA and 200DEMA,
Daily MA suggests Buy
Hourly suggests Sell
15mins Suggests Strong Sell
The momentum indicator, RSI - Relative Strength Index is now below 70 at 65 - not Overbought
Momentum gaining towards Neutral to Positive
Support/Resistance Levels:
Major Support 23000
Immediate Support 22300-200
Immediate Resistance 22550
Major Resistance 23700, 24000
Trend:
Short Term Trend is Sideways Consolidation with Negative bias
Daily Options Activity:
Highest CE OI was at 24000 also saw OI addition at 24000. 23600, 22500 - Resistance
Highest PE OI was at 23500, saw Pe unwinding at 23000 with no major PE addition
PCR is 0.8 indicating mild Bearishness
Daily Futures Activity FII + Pro F&O Data:
FII Long/Short ratio at 33.5%/66.5% indicating addition of Longs by FIIs - Bullish
Change in Futures OI:
FII Future positions in longs & shorts remained unchanged -not Bearish
Nifty Futures price was -.7% with 2.5% Decrease in OI indicating Shorts Additions
Observation:
Niftylooked below 23700 as it couldn’t find buyers and saw selling at highs to close weak below 23500
Overall Trend:
Sentiment is Sideways cautious
Outlook for Next Session:
Nifty saw profit booking afrter 6-7 days of large upmove. Now in No trade Zone basically. Wait and watch for clear signal till 22300 or 22800 taken out
Approach & Strategy:
Wait and Watch with Long bias
My Trades & Positions:
No Positions

Nifty levels - Mar 27, 2025Nifty support and resistance levels are valuable tools for making informed trading decisions, specifically when combined with the analysis of 5-minute timeframe candlesticks and VWAP. By closely monitoring these levels and observing the price movements within this timeframe, traders can enhance the accuracy of their entry and exit points. It is important to bear in mind that support and resistance levels are not fixed, and they can change over time as market conditions evolve.
The dashed lines on the chart indicate the reaction levels, serving as additional points of significance to consider. Furthermore, take note of the response at the levels of the High, Low, and Close values from the day prior.
We hope you find this information beneficial in your trading endeavors.
* If you found the idea appealing, kindly tap the Boost icon located below the chart. We encourage you to share your thoughts and comments regarding it.
Wishing you success in your trading activities!
