NIFTY : Intraday Trading levels and Plan for 11-Mar-2025📅 NIFTY TRADING PLAN – 11-Mar-2025
🕘 Time Frame: 15-Min | 📍 Strategy: Market Structure + Zones of Interest
📉 Previous Close: 22,441.10
📌 Consider 100+ points for Gap-Up / Gap-Down thresholds
🔼 1. GAP-UP OPENING (Above 22,541+)
A gap-up opening above 22,541 would place Nifty around or above the Opening Resistance zone. In such cases, the market may attempt to challenge the Last Intraday Resistance at 22,623, and possibly even push into the Major Resistance Zone between 22,706–22,744.
🧠 Plan of Action:
Wait for the price to show reaction around 22,623. If it struggles to sustain above this level and forms a bearish 15-min candle, it's a good risk-reward shorting opportunity.
Targets on the downside could be 22,512, and if weakness persists, then a slide toward 22,441 is possible.
Only if price breaks and holds above 22,744 (hourly candle close), consider going long for a possible extension toward 22,800+.
🔍 Caution: A gap-up directly into resistance zone can cause profit booking and volatility. Don’t chase a runaway rally unless momentum with volume confirms breakout.
🎯 Short Zone: 22,620–22,740 (Rejection candles preferred)
📈 Breakout Long above: 22,744 (With hourly close + volume)
➖ 2. FLAT OPENING (±100 points near 22,441)
A flat open near the previous close of 22,441 keeps Nifty inside a decision zone. It sits between the Opening Resistance (22,512) and the Consolidation Zone (22,321–22,410). This is where early traps often occur.
🧠 Plan of Action:
Let the first 15–30 mins settle. If Nifty bounces from 22,321–22,350, it can be considered a buy with tight SL below 22,321, targeting 22,512–22,623.
On the flip side, if price fails to hold 22,321, wait for a clean breakdown with volume — in that case, shorting opportunities open up toward 22,115.
Avoid overtrading in the consolidation zone — wait for structure to develop clearly.
🟧 Key Zone to Watch: 22,321–22,410 — Acts as possible trap zone with choppy moves.
🎯 Buy on Bounce: 22,321–22,350 (Confirmation needed)
📉 Short below: 22,321 (Strong candle + volume)
🔽 3. GAP-DOWN OPENING (Below 22,341)
If Nifty opens below 22,341, it may test or even open inside the Support Zone / Must Try Area for Buyers around 22,115 — which coincides with a key Golden Retracement and past support area.
🧠 Plan of Action:
If Nifty opens near 22,150–22,120, watch for reversal candles like bullish engulfing, morning star, or hammer patterns. If formed, it’s a good risk-reward zone to go long with SL below 22,100.
If price breaks and sustains below 22,100, avoid longs and prepare for further downside toward 21,950–21,880 in upcoming sessions.
Never jump into longs blindly on gap-downs — price action is king.
🟢 Buy Zone on Reversal: 22,150–22,115
🟥 Breakdown Trigger: Below 22,100 (Hourly candle close)
💡 Risk Management Tips for Options Traders:
🕒 Wait for the first 15–30 minutes to pass — let the market reveal its intent. 📉 Use spreads (Bull Call or Bear Put) when trading near volatile zones like resistances or supports. 🛑 Always set a Stop Loss — either on premium value or index level (preferably both). 🧠 Avoid emotional trading — don’t average into losing positions. 💼 Trade position size wisely — don't go all-in on a single idea. 🧾 Keep a trading journal to improve your strategy over time.
📌 Summary & Conclusion:
🔺 Gap-Up = Watch for weakness near 22,623–22,744 — possible reversal or breakout
🔘 Flat = High chance of whipsaws — trade only after clear setup forms near 22,321 or 22,512
🔻 Gap-Down = Support test likely at 22,115 — potential reversal or breakdown
⚠️ Always respect the market structure and trade with discipline. Avoid predicting — react to what the market shows.
📢 Disclaimer: I am not a SEBI-registered analyst. This analysis is shared for educational purposes only. Please do your own research or consult a financial advisor before making any trading decisions.
Niftylevels

NIFTY : Intraday Trading levels and Plan for 10-Mar-2025 NIFTY Closed at: 22,552
Tomorrow's session will be crucial as NIFTY is near key resistance & support zones. We will analyze all three possible opening scenarios and provide actionable trade setups.
📍 Scenario 1: Gap-Up Opening (🔼 +100 points or more)
If NIFTY opens above 22,690, it will start near the Opening Resistance Zone (22,635 - 22,690). A strong bullish momentum can push prices higher, but traders should be cautious of potential rejection.
📌 Plan of Action:
If NIFTY sustains above 22,690 for at least 15 minutes, expect a rally towards 22,819 (Last Intraday Resistance). 📈
If price faces rejection at 22,690, wait for a pullback to 22,635. If it holds as support, consider a long position.
If NIFTY falls below 22,635, it could test 22,545. A break below this level may weaken bullish sentiment.
📢 Trading Tip: In a gap-up scenario, avoid aggressive long positions at opening. Wait for price confirmation to avoid FOMO.
📍 Scenario 2: Flat Opening (±50 points around 22,536)
A flat opening indicates an indecisive market, and price action around the Opening Support Zone (22,500 - 22,476) will be crucial for the next move.
📌 Plan of Action:
If NIFTY holds above 22,536 and breaks 22,545, expect bullish momentum towards 22,635, followed by 22,690.
If NIFTY fails to hold 22,500, expect a slide towards 22,476. If this level is broken, expect further downside towards 22,378. 🔻
For long trades, wait for price to reclaim 22,545 after testing support zones.
📢 Trading Tip: Avoid trading in the first 15-30 minutes. Let the market establish a trend before taking positions.
📍 Scenario 3: Gap-Down Opening (🔽 -100 points or more)
If NIFTY opens below 22,476, sentiment may turn bearish, especially if it sustains below this level.
📌 Plan of Action:
If NIFTY opens near 22,378, watch for price action—a strong bounce can lead to a recovery towards 22,476 - 22,500.
If 22,378 breaks, expect further weakness towards 22,299, which is the last major intraday support.
Any recovery will need to cross 22,500 for a trend reversal. Until then, bearish pressure will dominate.
📢 Trading Tip: In a gap-down scenario, avoid catching falling knives. Let support levels hold before attempting a buy.
🎯 Risk Management Tips for Options Traders
✅ Use Stop Loss: Always exit a trade if your stop loss is hit. Holding onto losing trades can wipe out profits.
✅ Avoid Trading Big Lot Sizes in uncertain conditions—start small & scale up when trends confirm.
✅ Time Decay Awareness: If buying options, avoid holding near expiry unless confident about a strong move.
✅ Hedge Positions: Consider using hedged strategies like Spreads to reduce risk.
📌 Summary & Conclusion
🔹 Above 22,690 → Bullish towards 22,819
🔹 Between 22,500 - 22,690 → Sideways range, wait for confirmation
🔹 Below 22,476 → Bearish towards 22,378 - 22,299
⚡ Patience & Discipline are key to profitable trading. Wait for confirmation before entering trades. 🚀
⚠️ Disclaimer
I am not a SEBI-registered analyst. This trading plan is for educational purposes only. Traders should do their own research or consult a financial advisor before taking any trades.
📢 #Nifty #Nifty50 #StockMarketIndia #OptionsTrading #SwingTrading #TradingView #NSE #IndianStockMarket #PriceAction #StockMarketNews 🚀

Omnichart presents - NIFTY/(USDINR) long term trend Nifty's performance when compared to US dollar (vs its base currency i.e. Indian Rupee) broke above a long term since 2007 resistance through Dec 2020. As you can see it broke above the blue line in Dec 2020 and has been outperforming the dollar - to -rupee. What this means is that investing US dollars to buy Nifty started becoming more profitable in Dec 2020 vs just keeping the wealth in US Dollars (not converting to INR). This is in a long term uptrend - what this means is that investing US dollars in NIFTY long term is a profitable strategy.

Nifty 50 - Grim state but recovery probable from end of Feb
Nifty 50 is at an Inflection point. 22,513 is a very strong weekly support. By friday, if we get a bounce and close above 22,513. We can anticipate a recovery till 23,200 zone.
Refer chart for easy understanding

Nifty trying to bounce but few hurdles remain. Nifty is trying to bounce after forming the base but few important hurdles to cross next week if the rally has to sustain. The immediate resistances for Nifty will be 22557, 22668, 22800 and 23056. If these resistances are crossed we will have the Mother line and Father line resistances waiting for Nifty at 23116 and 23458. In the Middle of this tough resistance zone of Mother line and Father line there is also a trend line resistance around 23300. But these will come into play only if we are able to cross the immediate resistances mentioned earlier.
To know what mother father line resistances are you will have to read my book The Happy Candles Way To Wealth Creation. It is one of the highest rated books on Amazon in its category.
In case of the rally fizzles out the support zones will be near 22240, 21964, 21782 and finally 21281. In unlikely circumstances of 21281 broken and we get a weekly closing below it the market will fall into a major bear grip coming out of which can take a lot of time as this is the Election 2024 day low.
As of now shadow of the candle looks slightly positive however FIIs are still in the selling zone despite the chart showing the signs of bottom formation. Next week is going to be very interesting. It will be interesting if FIIs finally show some interest of coming back or continue their selling mode. Little bit of support from FII here could possibly drive the rally further and add more steam to this humble beginning of what we can call a gentle up move rather than a bull run.
Disclaimer: The above information is provided for educational purpose, analysis and paper trading only. Please don't treat this as a buy or sell recommendation for the stock or index. The Techno-Funda analysis is based on data that is more than 3 months old. Supports and Resistances are determined by historic past peaks and Valley in the chart. Many other indicators and patterns like EMA, RSI, MACD, Volumes, Fibonacci, parallel channel etc. use historic data which is 3 months or older cyclical points. There is no guarantee they will work in future as markets are highly volatile and swings in prices are also due to macro and micro factors based on actions taken by the company as well as region and global events. Equity investment is subject to risks. I or my clients or family members might have positions in the stocks that we mention in our educational posts. We will not be responsible for any Profit or loss that may occur due to any financial decision taken based on any data provided in this message. Do consult your investment advisor before taking any financial decisions. Stop losses should be an important part of any investment in equity.

#NIFTY Intraday Support and Resistance Levels - 07/03/2025Today will be flat opening expected in nifty. After opening if nifty sustain above 22500 level then expected upside movement upto 22750 in today's session. 22500 level will act as a important support for today's session. Major downside possible if nifty not sustain above level and give breakdown of 22450. This downside can goes upto next major support level at 22150.

NIFTY : Intraday Trading levels and Plan for 07-Mar-2025
📌 Key Levels to Watch:
🔴 Resistance Levels: 22,635 | 22,819
🟢 Support Levels: 22,467-22,496 | 22,378 | 22,258
📝 Market Context:
Nifty has shown strong momentum in recent sessions, currently trading near 22,529. The profit booking zone lies around 22,635, while a breakout above this could lead to 22,819. On the downside, key support exists at 22,467-22,496, and a further breakdown may drag prices toward 22,378-22,258.
📈 Scenario 1: Gap-Up Opening (100+ Points Above 22,630) 🚀
If Nifty opens above 22,630, it enters the profit booking zone, making further upside dependent on momentum. A clean breakout above 22,819 will signal strength.
Buy above 22,635 🔼
🎯 Target: 22,750 – 22,819
🛑 Stop Loss: 22,550
📝 Plan: If Nifty sustains above 22,635, it can attempt 22,819. Wait for a proper 15-minute candle close above 22,635 before entering. Profit booking is advised near resistance levels.
Rejection at 22,635 ❌
🔽 Sell below 22,630
🎯 Target: 22,500 – 22,467
🛑 Stop Loss: 22,680
📝 Plan: If Nifty struggles at 22,635 and reverses, a short trade can be considered toward 22,467. Volume confirmation is necessary before entering shorts.
📉 Scenario 2: Flat Opening (22,450 – 22,550) 📊
A flat opening near 22,450 – 22,550 suggests indecision. The 22,467-22,496 range is a crucial support area.
Buy above 22,550 🔼
🎯 Target: 22,635 – 22,700
🛑 Stop Loss: 22,500
📝 Plan: If Nifty holds above 22,550 and shows strength, an upside move toward 22,635 is likely. Look for bullish price action confirmation before entering.
Sell below 22,467 🔽
🎯 Target: 22,378 – 22,350
🛑 Stop Loss: 22,525
📝 Plan: If Nifty breaks below 22,467 and struggles to reclaim it, selling pressure may drag it toward 22,378. Wait for a sustained breakdown before taking short positions.
📉 Scenario 3: Gap-Down Opening (Below 22,429) ⚠️
A gap-down below 22,429 signals weakness, with support at 22,378 and 22,258.
Buy near 22,258 – 22,300 🟢
🎯 Target: 22,440
🛑 Stop Loss: 22,220
📝 Plan: If Nifty stabilizes at 22,258-22,300, a bounce toward 22,440 is possible. Ideal for risk-managed long trades.
Sell below 22,258 🔽
🎯 Target: 22,150 – 22,100
🛑 Stop Loss: 22,320
📝 Plan: If selling pressure persists below 22,258, a further slide is likely. Avoid panic selling; wait for confirmation.
💡 Risk Management Tips for Options Traders 🎯
✅ Theta Decay Awareness: Avoid buying OTM options late in the day.
✅ Stop-Loss Discipline: Always use SL based on technical structure.
✅ Position Sizing: Risk only 2% of capital per trade.
✅ Avoid Overtrading: Trade only high-probability setups.
📌 Summary & Conclusion 📌
🔹 Bullish above 22,635 for 22,819.
🔹 Bearish below 22,258 for 22,150.
🔹 Flat open needs confirmation for direction.
🔹 Key support: 22,467-22,496 | 22,258.
🔹 Key resistance: 22,635 | 22,819.
📢 Trade with discipline, follow the plan, and manage risk effectively!
⚠️ Disclaimer:
I am not a SEBI-registered analyst. This analysis is for educational purposes only. Do your own research or consult a financial advisor before trading. 📊📉📈

Good closing by Nifty, Now all eyes on tomorrow's weekly closingAnother fantastic day of recovery by Nifty which closed 207 points up today. From the lows of the day recovery was 310.6 from the lows of the day. Thus last 2 days have seen a significant up moves. The resistances now for Nifty remain at 22556, 22800 and 22981 before we reach the major resistance zone of 23139 to 23467.
This zone includes a Mother line, Father line and Trend line resistance. It will take some major good news or significant buying by FII to take us into Bull zone which awaits us above this zone. Supports for Nifty remain at 22240, 21954, 21782 and 21281. Below 21281 there can be a bear mayhem which can see Nifty slipping into recession mode. For now that zone is far away and shadow of the candle currently looks neutral to positive.
Disclaimer: The above information is provided for educational purpose, analysis and paper trading only. Please don't treat this as a buy or sell recommendation for the stock or index. The Techno-Funda analysis is based on data that is more than 3 months old. Supports and Resistances are determined by historic past peaks and Valley in the chart. Many other indicators and patterns like EMA, RSI, MACD, Volumes, Fibonacci, parallel channel etc. use historic data which is 3 months or older cyclical points. There is no guarantee they will work in future as markets are highly volatile and swings in prices are also due to macro and micro factors based on actions taken by the company as well as region and global events. Equity investment is subject to risks. I or my clients or family members might have positions in the stocks that we mention in our educational posts. We will not be responsible for any Profit or loss that may occur due to any financial decision taken based on any data provided in this message. Do consult your investment advisor before taking any financial decisions. Stop losses should be an important part of any investment in equity.

NIFTY : Intraday Trading levels and Plan for 06-Mar-2025Market Context:
Nifty closed at 22,337, with the following key structural levels:
🔴 Profit Booking Zone: 22,635
🟠 No Trade Zone: 22,356 - 22,462
🟢 Opening Support: 22,200 - 22,230
🟩 Last Intraday Support: 22,165 - 22,057
Considering a 100+ point gap opening, let's analyze the possible trading scenarios for the day.
🟢 Scenario 1: Gap-Up Opening (100+ Points Above 22,450)
If Nifty opens above 22,450, it moves into or above the No Trade Zone (22,356 - 22,462).
Sustaining above 22,462 – If the market holds this level with strong momentum, Nifty can rally toward the Profit Booking Zone at 22,635.
Rejection from 22,462 – If price struggles to break above 22,462, it may pull back toward the previous resistance at 22,356, which now acts as support.
If price consolidates inside the No Trade Zone, it signals uncertainty, and traders should wait for a clear direction before taking action.
🔹 Trading Plan:
Go long only if Nifty sustains above 22,462 on an hourly close, targeting 22,635.
Sell below 22,356 if rejection is observed, with a target of 22,289.
Options traders can consider 22,500 CE for long trades and 22,400 PE if rejection occurs.
🟡 Scenario 2: Flat Opening (Within 22,300 - 22,350)
A flat opening near 22,346 places Nifty in a neutral range, requiring confirmation for the next move.
A move above 22,356 will push the index toward the No Trade Zone (22,356 - 22,462). If sustained, a breakout above 22,462 can open room for higher levels.
A drop below 22,300 brings the price closer to the Opening Support Zone (22,200 - 22,230), making this level crucial for short-term buyers.
If price trades between 22,300 - 22,356, wait for a decisive breakout before entering trades.
🔹 Trading Plan:
Avoid taking trades inside the No Trade Zone and wait for a breakout.
Go long above 22,462, targeting 22,635.
Sell below 22,300 for a move toward 22,200, with stop-loss at 22,356.
Options traders can use 22,400 CE for longs and 22,300 PE for shorts.
🔴 Scenario 3: Gap-Down Opening (100+ Points Below 22,200)
A gap-down near 22,200 - 22,057 will bring price into the Opening Support & Last Intraday Support Zones.
Holding 22,200 – If price finds support here, a strong bounce can push Nifty back toward 22,356.
Breaking 22,165 – If selling pressure persists, the next downside target is 22,057, which is the last major support.
If price enters the 22,057 - 22,165 range, this zone could act as a major reversal point based on previous demand zones.
🔹 Trading Plan:
Look for buying opportunities at 22,200 if price shows reversal signals.
If breakdown below 22,165 occurs, wait for confirmation before shorting toward 22,057.
Options traders can use 22,200 PE for breakdown trades and 22,100 CE for bounces.
📊 Risk Management Tips for Options Trading
✅ Use Stop Loss on an Hourly Close Basis – Avoid holding options without confirmation of direction.
✅ Avoid Trading in the No Trade Zone – Let price break out before taking a position.
✅ Monitor India VIX – If volatility is high, premiums may decay faster. Avoid unnecessary trades.
✅ Partial Profit Booking is Key – Secure profits at resistance & support levels instead of waiting for full targets.
✅ Avoid Holding Trades Overnight – Unless there is a strong directional bias, overnight positions carry additional risk.
📌 Summary & Conclusion
Bullish Scenario: Above 22,462, Nifty can rally toward 22,635.
Neutral Zone: If trading between 22,300 - 22,356, wait for confirmation before entering trades.
Bearish Scenario: Below 22,165, weakness can extend toward 22,057, where a bounce is likely.
🔹 Best Risk-Reward Trades:
Buy near 22,200 if support holds.
Sell below 22,165 for a breakdown.
Buy only on a confirmed breakout above 22,462.
⚠️ Disclaimer:
I am not a SEBI-registered analyst. This analysis is for educational purposes only. Please conduct your own research or consult a financial advisor before making any trading decisions.

Nifty trying to stage a comeback but big resistances approachingNifty is in the process of staging a grand come back. Toda it closed with heft gain of 1.15% and 254 points. However there is an important trend line resistance including the supply zone between 22394 and 22455. If we get a closing above 22455 by the end of this week we can assume it will be a come back otherwise this bounce can be termed only as a technical bounce from the oversold zone. Once we get a closing above 22455 the next resistances will be at 22692 and 22981. Post this there will be Mother line, Major trend line and Father line resistance which can be seen in the chart at 23163, 23411 and finally 23477. It is a long way to go before we reach there. Bulls can claim a dominating position only after a closing above 23477. Supports for Nifty remain at 22183, 21954 and 21576 currently. All eyes on the closing we get this weekend. Positive or positive to flat closing required in the next 2 days for bull run to gather proper steam. Shadow of the candle currently looks neutral to positive.
Disclaimer: The above information is provided for educational purpose, analysis and paper trading only. Please don't treat this as a buy or sell recommendation for the stock or index. The Techno-Funda analysis is based on data that is more than 3 months old. Supports and Resistances are determined by historic past peaks and Valley in the chart. Many other indicators and patterns like EMA, RSI, MACD, Volumes, Fibonacci, parallel channel etc. use historic data which is 3 months or older cyclical points. There is no guarantee they will work in future as markets are highly volatile and swings in prices are also due to macro and micro factors based on actions taken by the company as well as region and global events. Equity investment is subject to risks. I or my clients or family members might have positions in the stocks that we mention in our educational posts. We will not be responsible for any Profit or loss that may occur due to any financial decision taken based on any data provided in this message. Do consult your investment advisor before taking any financial decisions. Stop losses should be an important part of any investment in equity.

NIFTY : Intraday Trading levels and Plan for 25-Mar-2025Market Context:
Nifty closed at 22,080.30, with key structural zones identified:
🔴 Last Intraday Resistance Zone: 22,188 - 22,230
🟠 No Trade Zone: 22,070 - 21,966
🟢 Opening Support: 21,966
🟢 Last Intraday Support: 21,889
🟩 Key Demand Zone: 21,613 - 21,889 (Potential Wave C Completion Area)
With a 100+ point gap opening considered, let’s analyze different market scenarios.
🟢 Scenario 1: Gap-Up Opening (100+ Points Above 22,180)
If Nifty opens above 22,180, it enters the Last Intraday Resistance Zone (22,188 - 22,230).
Sustaining above 22,230 – A breakout above this resistance can lead to a potential move toward 22,356.
Failure at 22,230 – A rejection from this level could push Nifty back toward 22,080, the previous closing level.
If price consolidates near 22,230 without strong buying, it signals a possible reversal, making a short trade viable.
🔹 Trading Plan:
Go long only if Nifty sustains above 22,230 on an hourly close, targeting 22,356.
Sell below 22,188 if rejection is observed, with a target of 22,080.
Options traders can consider 22,200 CE for longs and 22,300 PE if rejection occurs.
🟡 Scenario 2: Flat Opening (Within 22,070 - 22,100)
A flat opening near 22,080 places Nifty in a neutral zone, requiring clear direction.
A move above 22,100 may lead to an attempt toward the resistance at 22,188 - 22,230.
A drop below 22,070 would push price into the No Trade Zone, signaling indecision.
A break below 21,966 will shift momentum bearish, targeting 21,889.
🔹 Trading Plan:
Avoid trades inside the No Trade Zone and wait for a breakout.
A rejection from 22,188 can offer a short trade opportunity toward 22,070.
Long positions should only be considered above 22,230, with proper stop-loss management.
🔴 Scenario 3: Gap-Down Opening (100+ Points Below 21,980)
A gap-down near 21,966 - 21,889 will bring price into Opening Support & Last Intraday Support Zones.
Holding 21,889 – A strong bounce can occur from this level, offering a buying opportunity.
Breaking 21,889 – If sustained selling continues, Nifty may move toward the Wave C Completion Zone (21,613 - 21,889).
If price enters the 21,613 - 21,889 range, this zone could act as a major reversal point based on the daily chart.
🔹 Trading Plan:
Look for buying opportunities at 21,889 if price shows signs of reversal.
If breakdown below 21,889 occurs, wait for confirmation before shorting toward 21,613.
Options traders can use 21,900 PE for breakdown trades and 21,800 CE for bounces.
📊 Risk Management Tips for Options Trading
✅ Use Stop Loss on an Hourly Close Basis – Avoid holding options without confirmation of direction.
✅ Trade Small in No Trade Zones – Wait for a breakout or rejection before increasing position size.
✅ Monitor India VIX – If volatility spikes, avoid aggressive short selling.
✅ Book Profits at Resistance & Support Levels – Avoid holding options till expiry unless confident in direction.
✅ Stay Disciplined – If market structure changes, be quick to adapt rather than forcing trades.
📌 Summary & Conclusion
Bullish Scenario: Above 22,230, Nifty can rally toward 22,356.
Neutral Zone: If trading between 21,966 - 22,070, wait for confirmation before trading.
Bearish Scenario: Below 21,889, weakness can extend toward 21,613, where a bounce is expected.
🔹 Best Risk-Reward Trades:
Buy near 21,889 if support holds.
Sell below 21,889 for a breakdown.
Buy only on a confirmed breakout above 22,230.
⚠️ Disclaimer:
I am not a SEBI-registered analyst. This analysis is for educational purposes only. Please conduct your own research or consult a financial advisor before making any trading decisions.

NIFTY : Analysis, levels, Prediction and next aheadThis chart provides an analysis based on Elliott Wave theory (Modified with psychological behavior), showing how the NIFTY 50 index has moved through different phases and highlighting important levels where price actions suggest significant market behavior.
Initially, prices consolidated around 21174-22469, forming the base of a larger upward move referred to as Wave C which was started from 15290 on weekly chart. This phase is significant because it shows the market finding strong support, where buyers stepped in to absorb selling pressure. This type of consolidation often indicates the foundation of a bullish rally. From here, the index began its upward journey, reaching an extended Wave C completion zone between 25,096 and 26,641 which was predicted on 30-Aug-2024 when prices were trading at 25151 .
from this range, prices started to lose strength, which is typical when markets approach exhaustion zones in an extended trend. The selling pressure increased, leading to a reversal.
charts.fyers.in
After hitting this extended resistance zone, the market entered a correction phase, forming Wave A. This phase is marked by a sharp decline, with prices finding support at 23,263, a significant 50% retracement of the previous move. Retracements like this are crucial because they represent a balance point where the market pauses to decide its next move. The 50% retracement is also a key Fibonacci level, often considered a strong resistance / support area. from retracement zone prices started decline again to complete its structure of ABC (Correction wave)
Currently, the index is trading in the first corrective Wave C zone between 22,762 and 23,061. This range is critical because it represents a decision point for the market. If prices hold here, it could signal the end of the correction and the start of a new upward wave. If the market fails to sustain this level, it could move further downward toward the extended correction zone at 21,617–21,893. This area is identified as a potential bottoming-out zone where strong support is expected. Historically, such zones offer good buying opportunities for traders looking for a trend reversal.
However, if prices fail to hold even this extended correction zone and break below 21,174, it would confirm a decisive bearish trend on both weekly and monthly charts. A breakdown like this would suggest a prolonged sideways or negative trend, meaning the market could struggle to recover for some time.
In summary, the chart highlights key areas to watch for potential market reversals. If prices hold above 22,762, there’s a good chance of a bullish recovery, and this could be a buying opportunity. On the other hand, if prices break below this level, the next significant support lies around 21,617–21,893. A failure to hold even that zone would shift the outlook to bearish, signaling the end of the bullish trend and a move toward a deeper correction. Understanding these levels and their significance helps traders and investors make informed decisions about when to enter or exit the market.

NIFTY : Is still Panic Ahead?
In Continuation of my last analysis on 27-Jan-2025
Updated on Daily Charts
Bullish Wave Completion (Wave 1):
The initial upward move saw prices reach a bullish wave completion zone between 21,179 and 22,481. This zone represents the culmination of a strong impulsive wave, with consolidation occurring around the lower band (21,179) after peaking. The support held firm, indicating potential for further upside initially.
Extended Wave C or Wave 3 Profit Booking (Wave 2):
Following the bullish peak, an extended Wave C or Wave 3 profit-booking zone was identified between 22,086 and 22,636. This zone triggered a sharp decline as prices hit the upper band, suggesting overextension and exhaustion of bullish momentum. The drop broke below the support of this zone, setting the stage for a corrective phase.
Correction Wave (Wave 3):
A corrective wave formed, confirmed by a 50% Fibonacci retracement of the prior upward move. This retracement level acted as a natural pullback point, with prices stabilizing briefly before resuming their downward trajectory. This wave indicates a healthy correction within the larger trend.
Support and Further Correction (Wave 4):
Prices found temporary support within the correction wave zone of 22,758 - 23,054. However, this support failed, leading to a further decline after the formation of Wave 4 on a minor wave. The chart marks this as part of an extended correction wave completion zone (21,613 - 21,894), where current price action is converging.
Current Market Position and Outlook:
As of the chart's context (March 2023, with the current date being March 4, 2025), prices are trading toward the extended correction zone (21,613 - 21,894). This zone represents a critical level where buyers might step in, but a break below could signal deeper losses.
Short-term resistance is noted around 23,054, while a sustained move below 21,894 could target the Primary Wave 4 bottom at 19,683. This level aligns with a significant long-term support zone, making it a key area to watch for reversal or continuation.
Trading Implications:
Bullish Case: If prices hold above 21,894 and show signs of reversal (e.g., bullish candlestick patterns or increased volume), traders might anticipate a bounce toward 23,054.
Bearish Case: A break below 21,894 with strong momentum could open the door to 19,683, especially if broader market sentiment turns negative.
Risk management is crucial, with stop-losses recommended below key support levels and targets set near resistance zones.

Nifty Review & Analysis - DailyPrice Action :
Nifty closed flat of much drama
Technicals:
Nifty opened gap up in line with global cues to find sellers at every high. Nifty made new low around 22000 and bounced back to close flat below all DEMAs
The momentum indicator, RSI - Relative Strength Index closed below 30 suggesting oversold markets.
Support/Resistance
Major Support 21900
Immediate Support 22000
Immediate Resistance 22250
Major Resistance 22400, 22500
Trend:
Overall Trend is Bearish, Sell on Rise
Options Data:
Highest CE OI was at 22500 with highest addition at 22400 - Resistance
Highest PE OI was at 21900, highest Put writing seen at 22000, 21900 - No major support
PCR is 0.7 which indicates Bearishness
Futures Data:
FII Long/Short ratio at 16%/84%
FII Future positions saw little addition in longs +3K with no change in shorts
Nifty Futures price was flat with small addition of OI
Outlook for Next Session:
Nifty is weak Sell on every rise
Approch:
Short at higher levels for target 21500 with SL 22600
My Trades & Positions:
Holding Shorts in March monthly contract from 22850 levels (booked half at 22050 levels)

NIFTY : Intraday Trading levels and Plan for 04-Mar-2025
This analysis provides a comprehensive trading plan for the NIFTY 50 index on March 4, 2025, covering all possible opening scenarios. We will evaluate Gap-Up, Flat, and Gap-Down openings (with gaps of 100+ points) and outline clear action points, key levels, and risk management strategies. This plan is designed to help traders navigate the market with precision and discipline. 📈🔍
🔹 Scenario 1: Gap-Up Opening (100+ points)
If NIFTY 50 opens above 22,142 (a gap of 100+ points from the previous close of 22,042), it signals strong bullish momentum. This opening suggests a potential breakout from the current consolidation range, indicating aggressive buying interest.
If the price sustains above 22,142, it could target the resistance zone of 22,300–22,460. This zone is a profit-booking area where selling pressure may intensify due to historical resistance and recent highs.
If the price faces rejection at 22,300–22,460, a reversal trade could be considered, targeting a pullback to 22,118–22,042 (opening support/consolidation zone and previous close).
Should the price break above 22,460 with strong momentum (e.g., high volume and bullish candlestick patterns), we might see a rally toward 22,600 or higher.
✅ Trade Plan:
✔️ Buy on a breakout and retest of 22,142 , targeting 22,300–22,460. Use a stop-loss below 22,042 to manage risk.
✔️ Short if the price rejects 22,300–22,460, aiming for 22,118–22,042. Place a stop-loss above 22,460 to limit potential losses.
Explanation: A Gap-Up opening of 100+ points indicates a potential breakout from the 21,889–21,600 consolidation range. Waiting for a retest of 22,142 confirms bullish intent, while the resistance at 22,300–22,460 acts as a natural profit-taking zone. A rejection at this level could signal a shorting opportunity if bearish momentum resurfaces.
🔹 Scenario 2: Flat Opening (Near 22,042–22,118)
If NIFTY 50 opens within the range of 22,042–22,118, it suggests a balanced market continuing its consolidation phase with no clear directional bias. This zone acts as a critical opening support/resistance area.
A breakout above 22,118 could drive prices toward 22,300–22,460, signaling bullish momentum and a possible trend reversal.
A breakdown below 22,042 might lead to selling pressure, targeting 21,889 (first buyer’s support) or even 21,613–21,600 (possible bottom-out level).
✅ Trade Plan:
✔️ Buy above 22,118 , targeting 22,300–22,460. Use a stop-loss below 22,042 to protect against a false breakout.
✔️ Sell below 22,042 , targeting 21,889 or 21,613–21,600. Set a stop-loss above 22,118 to manage downside risk.
Explanation: A Flat opening within the 22,042–22,118 range indicates the market is still consolidating, a no-trade zone unless a breakout occurs. Traders should wait for clear price action (e.g., strong candlestick patterns or increased volume) to confirm a breakout above 22,118 for a bullish move or a breakdown below 22,042 for a bearish move, avoiding premature entries.
🔹 Scenario 3: Gap-Down Opening (100+ points)
If NIFTY 50 opens below 21,942 (a gap of 100+ points from the previous close of 22,042), it signals bearish sentiment and potential weakness, testing the lower support levels.
Immediate support lies at 21,889 (first buyer’s support). If this holds, a pullback toward 22,042–22,118 could occur.
If 21,889 breaks with strong selling pressure, expect further downside toward 21,613–21,600 (possible bottom-out level for a reversal).
✅ Trade Plan:
✔️ Buy near 21,889 , targeting a pullback to 22,042–22,118. Use a stop-loss below 21,600 to limit risk.
✔️ Short below 21,889 , targeting 21,613–21,600. Place a stop-loss above 21,889 to protect against a quick recovery.
Explanation: A Gap-Down opening of 100+ points suggests continued downward pressure, but support at 21,889 could trigger a rebound if it holds. Waiting for confirmation near 21,889 ensures the price isn’t just oversold, while a break below this level confirms bearish momentum for shorting. The 21,613–21,600 zone is a critical level for a potential reversal if buying interest emerges.
📌 Risk Management Tips for Options Trading 💡
🛑 Always Use a Strict Stop-Loss: Protect your capital by setting stop-loss orders at key support/resistance levels to limit potential losses.
🎯 Take Partial Profits: Lock in gains at intermediate targets (e.g., 22,300 or 21,889) to secure profits while allowing room for further moves.
🕰️ Avoid Overtrading: Stick to the plan and wait for clear price action confirmation—don’t force trades in uncertain conditions.
💰 Use Proper Position Sizing: Risk only a small percentage of your capital (e.g., 1–2%) per trade to ensure longevity in the market.
📌 Summary & Conclusion 🎯
✔️ Bullish Above: 22,118 → Target: 22,300–22,460.
✔️ Bearish Below: 22,042 → Target: 21,889 or 21,613–21,600.
✔️ No Trade Zone: 22,042–22,118 (Wait for a breakout).
Trade with discipline, follow your plan, and prioritize risk management to navigate the NIFTY 50 market effectively on March 4, 2025. 🚀
⚠️ Disclaimer
I am not a SEBI-registered analyst. This analysis is for educational purposes only. Please consult your financial advisor before making any trading decisions. 📉📈

Key Levels & Trading Plan for the Current Market Trend1. Identified Key Levels
Type Price Level (Approx.) Significance
Major Resistance 22,700 - 22,800 Previous support turned resistance; strong rejection possible.
Minor Resistance 22,400 - 22,500 Short-term bounce zone; potential sell-off area.
Current Price Zone 22,100 - 22,200 Market hovering near key support; decision point.
First Major Support 21,800 - 21,900 Next critical level; breakdown could accelerate selling.
Second Major Support 21,500 - 21,600 Deeper demand zone; last line of defense before more downside.
2. Trading Strategies Based on Key Levels
Bearish Continuation Trade (Higher Probability)
• Entry: Look for a pullback to 22,400 - 22,500 for short positions.
• Stop-Loss: Above 22,700 to avoid getting trapped in a fakeout.
• Take-Profit 1: 21,900 - 22,000 (First major support).
• Take-Profit 2: 21,500 (Next strong support).
Bullish Relief Rally (Lower Probability)
• Entry: If price forms a bullish engulfing candle + high volume around 21,800 - 22,000.
• Stop-Loss: Below 21,600 to limit downside risk.
• Take-Profit 1: 22,400 - 22,500 (Short-term bounce area).
• Take-Profit 2: 22,700 (Stronger resistance).
3. Risk Management & Confirmation Signals
• Bearish Confirmation:
• Price rejection at resistance (22,400-22,500).
• Low bullish volume on pullbacks.
• Large red candles breaking support.
• Bullish Confirmation:
• Strong reversal candle at key support.
• Increase in buying volume.
• Break above 22,400 with momentum.
Final Outlook
• Primary Bias: Bearish → Look for short opportunities on pullbacks.
• Secondary Bias: Bullish only if price shows strong reversal near 21,800 - 21,900.

Detailed Forecast of the Market Trend Based on the Chart1. Market Structure & Trend Analysis
• The chart clearly shows a strong downtrend forming after a prolonged bullish run.
• Multiple lower highs and lower lows confirm a bearish market structure.
• The market has broken through key support zones, indicating sustained selling pressure.
2. Key Observations
• Change of Character (ChoCH):
• There are multiple ChoCH levels, signaling shifts in market sentiment.
• The first ChoCH near the peak indicated the start of the downtrend.
• The second ChoCH at a support break confirms the bearish continuation.
• Liquidity Zones:
• The price has entered a demand zone but has shown no strong reversal signs yet.
• If buyers step in, a short-term relief bounce may occur.
• However, failure to hold this zone could lead to a deeper price decline.
• Volume Analysis:
• Increasing bearish volume suggests that sellers are still in control.
• Weak bullish attempts indicate a lack of buying strength.
3. Forecast & Scenarios
Bearish Continuation (High Probability)
• If the price stays below the recent support-turned-resistance, expect further downside.
• Next potential support levels:
• 21,800 - 22,000 region (psychological and technical support).
• If broken, 21,500 - 21,600 becomes the next target.
Short-term Relief Rally (Low Probability)
• If bullish volume increases in the demand zone, a pullback towards 22,500 - 22,700 is possible.
• However, strong resistance remains in this region, making it a potential shorting opportunity.
4. Trading Strategy
• For Short Sellers:
• Look for a pullback to resistance and enter short positions.
• Stop-loss above 22,700 to manage risk.
• Targets: 21,800, then 21,500.
• For Long Traders:
• Wait for strong bullish confirmation in the demand zone.
• If price shows bullish engulfing candles + high volume, a short-term bounce trade is possible.
Conclusion
• Overall, the market remains bearish, and any bounces are likely to be short-lived unless major buying volume appears.
• Traders should stay cautious and follow trend-based strategies rather than counter-trend trades.
Final Outlook
• Primary Bias: Bearish → Look for short opportunities on pullbacks.
• Secondary Bias: Bullish only if price shows strong reversal near 21,800 - 21,900.

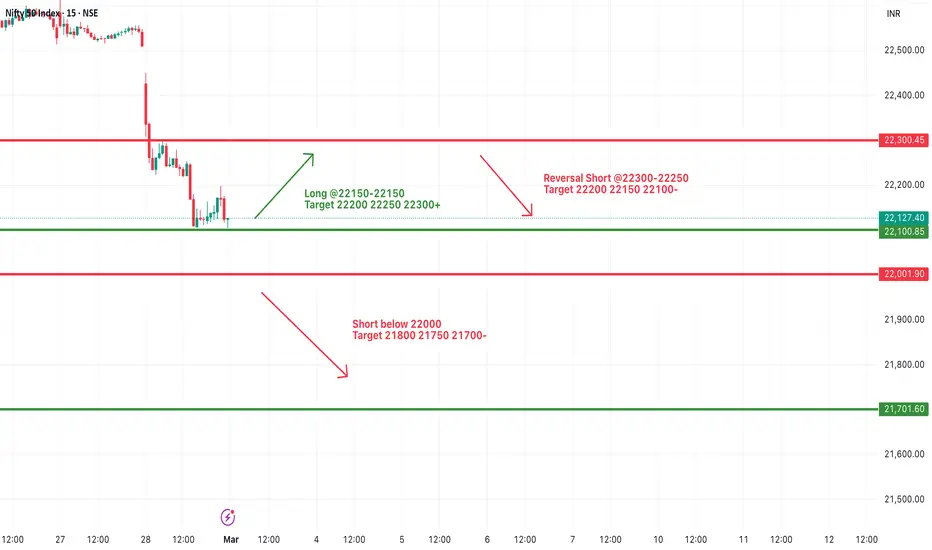
#NIFTY Intraday Support and Resistance Levels - 03/03/2025Gap up opening expected nifty near 22300 level. After opening expected reversal from this level. Downside 22000-22100 zone will act as a strong support for nifty. Any strong further bearish rally only expected below 22000 level. In case nifty gives breakdown of this level can leads major downside upto 21700.

Nifty Future Analysis
1. Price Action & Trend Analysis
The NIFTY Futures has been in a strong downtrend since October 2024, with lower highs and lower lows.
A black downward trendline is clearly acting as a dynamic resistance, rejecting price multiple times.
2. Gann Fan Analysis:
The Gann fan lines are visible, providing different angles of support and resistance.
The key Gann angles to watch:
1/1 Line (Steep Downtrend Line): The price is trending below this, indicating a strong bearish trend.
2/1 and 3/1 Lines: These are acting as resistance levels, confirming the selling pressure.
If price moves above the 1/1 Gann line, a potential reversal could be seen, but as of now, it remains below the bearish zone.
3. Volume & Market Sentiment
Latest Volume: 9.18M, which is relatively lower compared to 1 week ago (30.2M) but higher than the previous day (7.25M).
This suggests decreasing participation in the downtrend, which could indicate potential consolidation before the next move.
4. Key Support & Resistance Levels
Support Zones:
22,200-22,400: Current support based on Fibonacci & previous price action.
21,600-21,800: Next strong demand zone if selling continues.
20,800-21,000: Long-term support (historical demand zone).
Resistance Zones:
23,407-23,500: First resistance (Fib 0.382 & Gann fan level).
23,800-24,000: Major resistance (Fib 0.618, Gann fan rejection area).
24,500-24,760: Strongest resistance (Fib 0.75 + supply zone).
5. Conclusion & Trading Strategy
Bearish Bias: The market remains in a strong downtrend.
Possible Short Setup: If price breaks below 22,200, the next target would be 21,600.
Bullish Reversal Above 23,500: A move above this level could shift momentum toward 23,800-24,000.

Market Still Searching for Bottom. Nifty is still searching for a firm bottom from where it can form a base and launch a comeback. RSI of Nifty on Weekly chart is at 34.15. The weekly RSI was this low only during COVID fall when market RSI had gone below the level of 20. Most of the levels are being broken down week after week and day after day.
Now Nifty supports are at 22054 and 21813. 21813 seems to be a very strong support if this support is broken we have only 21281 support which was the Election day low where there was a fear of regime change. If 21281 is broken then 20507 and 19706 Father line of weekly Chart.
Daily RSI is at 22.4 which indicates Nifty might be near the oversold zone. Upside resistances for Nifty are at 22588, 22743. Crossing these 2 hurdles will bring in a formidable Fibonacci resistance of 23214 and 23334 (Mother line of Weekly chart) into picture. Bulls can make a come back only after we get a closing above 23334.
Amongst all these negative indications Nifty 50 PE valuations are at 19.7. The 10 year Average PE of Nifty 50 is at 23.5. Which means lot of stocks are trading below their 10 year Price to Earning average and value buyers can see an opportunity here for long term investment and they can start collecting fallen stars.
Daily Disclaimer: The above information is provided for educational purpose, analysis and paper trading only. Please don't treat this as a buy or sell recommendation for the stock or index. The Techno-Funda analysis is based on data that is more than 3 months old. Supports and Resistances are determined by historic past peaks and Valley in the chart. Many other indicators and patterns like EMA, RSI, MACD, Volumes, Fibonacci, parallel channel etc. use historic data which is 3 months or older cyclical points. There is no guarantee they will work in future as markets are highly volatile and swings in prices are also due to macro and micro factors based on actions taken by the company as well as region and global events. Equity investment is subject to risks. I or my clients or family members might have positions in the stocks that we mention in our educational posts. We will not be responsible for any Profit or loss that may occur due to any financial decision taken based on any data provided in this message. Do consult your investment advisor before taking any financial decisions. Stop losses should be an important part of any investment in equity.

Nifty 50 long term trend analysis, major support and resistance Nifty 50 Index (NSEI: NIFTY) was in a trend for 12 years from June 2008 to Dec 2020. In December 2020 it broke out of this range at ~13357 and almost doubled in just shy of 4 years (September 2024) peaking at ~26277.
Support 1 : 21870 (Fib 23.6%)
Support 2 : 19114 (Fib 38.2%)
Support 3 : 16909 (Fib 50%)
Note: Not an investment / trade recommendation. Just for educational purposes only.

#NIFTY Intraday Support and Resistance Levels - 28/02/2025Flat opening expected in nifty. It is consolidating in between the range of 22500-22550 level. Major directional rally only expected if nifty give break and sustain this range breakout. Strong downside movement expected below 22500 level. For bearish rally 22300 will be next support level. For bullish rally upside 22750 will act as a major resistance in today's session.
