Nifty is trapped between Mother line and trend line resistance. Nifty is trapped between Mother line and trend line resistance. The comeback that Nifty made from lows of the day was good. Today's low was 24004 from there the Nifty closed at 24141. The resistance on the way up for Nifty currently seem to be at 24221 (Mother line 50 Hours EMA), 24339, 24541, 24587 (Major Father line resistance 200 hours EMA) and 24700. Supports for Nifty remain at 24086, 24004 and finally 23816. 23816 is a major major support right now holding it from a major few hundred or even a thousand point fall. All is good till we do not get a closing below this point. Shadow of the candle right now looks neutral to positive.
To know more about stop losses, trailing stop losses, Profit booking and investment, financial awareness in general, process of investment in Equity or Mother, Father and small child theory read my book The Happy Candles Way to wealth creation. Many People who have read it consider it as hand book and perfect guide to equity investment. You can read reviews of the book or purchase the same from Amazon. The book is available on Amazon in Kindle and paperback version. I am sure you are going to find it of massive use. Once you have read the book, I assure you that you will become a next level investor.
Disclaimer:
The above information is provided for educational purpose, analysis and paper trading only. Please don't treat this as a buy or sell recommendation for the stock. We do not guarantee any success in highly volatile market or otherwise. Stock market investment is subject to market risks which include global and regional risks. We will not be responsible for any Profit or loss that may occur due to any financial decision taken based on any data provided in this message.
Niftylevels

NIFTY : Levels and Strategies for 12-Nov-2024Intro:
In the previous session, Nifty traded within a defined range, testing key levels without strong directional movement. We observed a sideways trend (yellow) near 24,122 - 24,171 , while the bullish trend (green) highlighted potential resistance points, and the bearish trend (red) indicated key support zones. Today's session will focus on reactions near these levels to identify any possible breakouts or breakdowns.
Opening Scenarios:
Gap Up Opening (100+ Points Above)
If Nifty opens above the 24,171 level, it may initially face resistance in the First Resistance Zone at 24,327 - 24,361 . A breakout above this weak resistance level could open the path to the Last Resistance for Intraday at 24,423 . Further strength above 24,423 could lead to a move toward the Profit Booking Zone at 24,530 - 24,601 .
Traders may consider long positions if the price sustains above 24,327 , aiming for targets at the higher resistance zones, but they should exercise caution if Nifty struggles to hold above 24,361 .
Conservative traders might look for pullbacks near support levels before entering long positions.
Flat Opening
In the event of a flat opening around 24,122 , the No Trade Zone 24,100 - 24,171 should be monitored closely. Price movement within this zone could indicate consolidation.
A breakout above 24,171 could signal bullish intent, leading to targets at 24,327 - 24,361 . Conversely, a breakdown below 24,100 might drive the index toward the Buyer’s Support at 23,988 .
Flat openings generally suggest patience, so traders may wait for a breakout from the No Trade Zone before initiating positions.
Gap Down Opening (100+ Points Below)
If Nifty opens below 24,100 , it may find support in the Buyer’s Support Zone around 23,988 . If this support holds, a recovery move back towards 24,100 is likely. A failure to hold above 23,988 could bring Nifty down to the Buyer’s Must Try Zone (Do or Die) at 23,828 - 23,777 .
Traders might look for shorting opportunities if Nifty breaks below 23,988 , with a target near the Buyer’s Must Try Zone. Alternatively, a bounce from the Buyer’s Support level could provide a chance for long trades towards 24,100 .
In gap-down scenarios, trading with a cautious mindset is crucial, and it’s often wise to wait for clear price action signals before entering trades.
Risk Management Tips for Options Trading:
Use appropriate stop-loss levels ( 24,100 , 24,327 , 24,423 ) to safeguard against unexpected moves.
Limit position sizes to manage potential risks, particularly during volatile conditions.
Consider using options spreads, like debit or credit spreads, to cap potential losses while still allowing for profit.
Avoid chasing trades in the No Trade Zone; wait for confirmed breakouts or breakdowns to enter options positions.
Summary and Conclusion:
The key levels to watch for 12-Nov-2024 are 24,171 (No Trade Zone upper boundary), 24,361 (First Resistance Zone), and 23,988 (Buyer’s Support). Observing price action near these levels can provide trading opportunities. Manage risks carefully, especially in options, to navigate through volatile market conditions effectively.
Disclaimer:
I am not a SEBI-registered analyst. This trading plan is based on technical analysis and personal insights. Traders should conduct their own analysis or consult a certified financial advisor before making any trading decisions.

Arrowindex : Nifty50 & banknifty level and moments for 12/11/202Arrowindex :
Nifty50 & banknifty level and moments for 12/11/2024
We're dedicated to providing you the best of Finance stock market, with a focus on dependability and Investment. We're working to turn our passion for Finance stock market into a booming online.
We analyze Live Market and try to Provide learning information Content. All the Live Market views and charts.
We hope you enjoy our free services related to Finance stock market as much as we enjoy offering them to you.
*Support and offering*
Effective online education modules for all segments of traders
Customized portfolio tracker
Online research & trading guidance
Entry and Exit support for Intraday trading, Swing trading, Scalping, Position trading Future & Delivery trading Technical analysis, Fundamentals analysis Fii & Dii data and reports.

#NIFTY Intraday Support and Resistance Levels - 11/11/2024Gap Down opening in nifty. After opening if nifty starts trading below 24000 level then possible strong downside rally upto 23800 level in today's session. Any bullish rally only occurs if nifty sustain above 24050 level in opening session.

NIFTY : Levels and Trading Plan for 11-Nov-2024
Nifty Trading Plan – 11-Nov-2024
Intro:
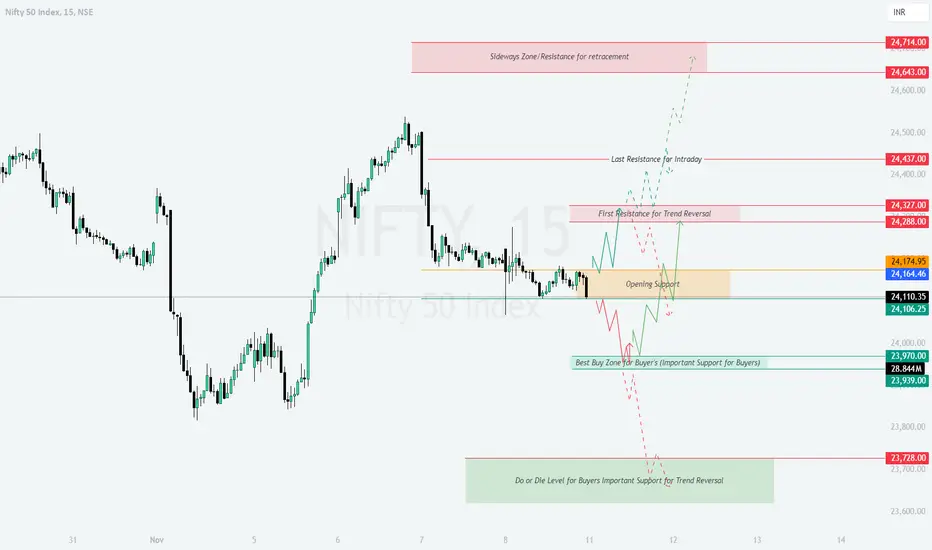
On the previous trading day, Nifty exhibited a mix of sideways and bearish trends, giving us valuable support and resistance zones. The yellow trend zones indicated periods of sideways movement, green zones showed bullish momentum, and red zones highlighted bearish pressure. We’re seeing strong resistance at 24,437 (Last Resistance for Intraday) and crucial support levels around 23,970 (Best Buy Zone for Buyers). Here’s how to approach the 11-Nov session based on potential market openings.
---
Trading Plan for All Opening Scenarios:
Gap Up Opening (100+ Points):
- If Nifty opens with a gap up above the First Resistance for Trend Reversal at 24,327, observe if it sustains above this level for the first 15-30 minutes.
- Bullish Scenario: A sustained move above 24,327 can trigger a bullish trend toward the Last Resistance for Intraday at 24,437. If it continues its momentum, target the Sideways Zone/Resistance for Retracement at 24,714 as the next potential upside. Enter with caution, aiming to buy on retracements toward the 24,327 level.
- Bearish Scenario: If it fails to hold above 24,327 and dips back, expect a retracement toward the Opening Support zone around 24,164. Aggressive traders can look for short entries below this level with a target back toward the Best Buy Zone at 23,970.
Flat Opening:
- If Nifty opens flat around the 24,110 mark, wait for the price to settle for 15-30 minutes before taking any positions.
- Bullish Scenario: A move above the First Resistance at 24,288 can give bullish momentum with targets toward 24,327 and potentially 24,437. Enter long positions if prices show strong support around 24,288.
- Bearish Scenario: If Nifty breaks below the Opening Support level at 24,106, it could signal weakness, with targets around the Best Buy Zone at 23,970. Look for short entries if price action confirms bearish sentiment below 24,106.
Gap Down Opening (100+ Points):
- A gap down opening below 24,000 could lead to initial volatility. Monitor how it behaves around the Best Buy Zone for Buyers at 23,970.
- Bullish Scenario: If Nifty holds above 23,970 and shows signs of a reversal, consider going long with targets around the Opening Support level at 24,106.
- Bearish Scenario: If selling pressure continues and Nifty breaks below 23,970, expect a deeper pullback toward the Do or Die Level for Buyers at 23,728. Look for short opportunities if it sustains below 23,970 with a strict stop loss above the 23,970 level.
---
Risk Management Tips for Options Trading:
- Use limited-risk strategies such as spreads to control risk.
- Set stop losses based on daily candle close to avoid getting stopped out by intraday volatility.
- Adjust position sizing based on your risk tolerance; avoid over-leveraging.
- Consider exiting positions near target levels rather than waiting for exact points. Options premiums can decay quickly.
---
Summary and Conclusion:
The market structure suggests key levels to watch for support and resistance. If Nifty sustains above key resistance at 24,327, it could lead to a bullish move, while a breach below support at 23,970 could prompt further downside. Be patient, wait for confirmation at each level, and manage risk effectively.
---
Disclaimer:
I am not a SEBI-registered analyst. This plan is for educational purposes only. Please conduct your analysis or consult a financial advisor before making any trading decisions.
NIFTY50 NOV 14 WEEKLY ANAYISISThe market is currently in a downtrend, showing a clear decline in price action with lower highs and lower lows.
Traders might interpret this as a sign🕒 of weakening investor confidence, often influenced by economic factors or profit-taking after previous gains.🤔
📉 In a downtrend, it’s essential to exercise caution, especially with long positions, as the trend Managing risk is key, as sudden reversals can happen.
Monitoring market sentiment and technical indicators can help identify a potential reversal or further bearish continuation.🚀
1.resistance level break down trend🔻 continue, nifty50
2.support level break and market sustenance, may be bullish trend start and down trend end
3.plz draw this level your trading panel #Tradingviews YOUR plat from
4. Follow ME More Ideas!👆

NIFTY : Trading Levels and Plan for 08-Nov-2024Previous Day’s Chart Overview:
On 07-Nov-2024, Nifty displayed a bearish movement with opening tick , with a clear consolidation phase after the breaking mentioned support zone. The chart highlights significant levels for both support and resistance that are likely to influence price movements on 08-Nov. The Yellow trend represents the sideways movement, the Green trend indicates a bullish scenario, and the Red trend shows potential bearish paths.
---
Trading Plan for 08-Nov-2024
Gap Up Opening (100+ points):
If Nifty opens above 24,358.00 (Opening Resistance) and holds, look for buying opportunities on pullbacks near this level. A sustained move above could target 24,460.00 , the next intraday resistance.
Should Nifty face resistance near 24,460.00 and fail to break above, consider short opportunities for a quick pullback to 24,358.00.
Watch for a potential breakout above 24,460.00 which could trigger a move towards the 24,643.00 – 24,714.00 zone, where sideways resistance may impact the uptrend. Book profits or trail stops in this range.
Flat Opening (within ±50 points):
If Nifty opens near 24,190.60 and finds support above 24,174.95 (Opening Support) , consider long positions targeting 24,358.00 (Opening Resistance) .
A failure to hold 24,174.95 could signal weakness; watch for a potential test of 24,106.25 (Best Buying Level) , a strong support level for intraday buyers.
If Nifty consolidates between 24,174.95 and 24,106.25, remain cautious with small trades until a clear breakout or breakdown occurs.
Gap Down Opening (100+ points):
If Nifty opens near or below 24,106.25 (Best Buying Level) , observe if it finds support. A strong buying interest here could provide an opportunity to target the 24,174.95 - 24,190.60 zone.
A breakdown below 24,106.25 may lead to a bearish trend toward 23,970.00 , the next critical support level. Traders can consider short positions here with strict stop-losses.
If Nifty tests and breaks below 23,970.00 , the next “Do or Die” level for buyers is at 23,700.00 , where a trend reversal may occur if supported by volume.
Risk Management Tips for Options Trading:
Always use stop-loss orders, especially when trading near resistance and support levels.
Limit your position size to a maximum of 2-3% of your total capital to manage risk efficiently.
For option trades, consider hedging strategies such as spreads or using out-of-the-money options to minimize premium risks in volatile markets.
Summary & Conclusion:
Tomorrow’s market could present significant trading opportunities given the current setup, especially around key support and resistance zones. Be cautious near the “Do or Die” level for buyers at 23,700.00, as it may lead to a trend reversal. Focus on risk management to protect capital in volatile conditions.
---
Disclaimer:
I am not a SEBI-registered analyst. This analysis is for educational purposes only and should not be considered as investment advice. Please consult a financial advisor before making trading decisions.

Nifty unable to break Hourly Channel top corrects. Nifty had reached channel top of the downward channel on hourly chart and was clearly not able to defeat it as evident in the chart and corrected wiping all the gains from yesterday's trump rally. Can it make one more effort to claim the channel top and defeat it is the question. Supports for Nifty remain at 24179, 24073 and 23816. Below 23816 the bears will feel empowered and can drag Nifty down to 23500 or 23200 levels. Resistances on the upper side remain at 24262 (Mother line resistance of 50 hours EMA), 24504, 24559 and finally father line of 200 Hour EMA at 24650.
This will remain a volatile week with major shift in global policies and realignments, FED Rate decision and other Geopolitical events. Keep an eye on situation in the Middle East and Ukraine, Russia front. Positive news will have again empower bears and give another rally like Trump rally seen yesterday. Shadow of the candles is Neutral to negative again. Bond yield, Gold, Silver, Dollar index, Crude can remain volatile while NASDAQ and Dow are in the Optimistic curve. November month will in general will remain volatile and next one week will decide the fate of Indian markets. With FIIs still on selling side and DII on buying side looks like things will remain topsy turvy for Indian markets.
Disclaimer: The above information is provided for educational purpose, analysis and paper trading only and views are personal. Please don't treat this as a buy or sell recommendation for the stock. We do not guarantee any success in highly volatile market or otherwise. Stock market investment is subject to market risks which include global and regional risks. We will not be responsible for any Profit or loss that may occur due to any financial decision taken based on any data provided in this message.

NIFTY : Trading Levels and Plan for 07-Nov-2024Trading Plan for Nifty - 07-Nov-2024
Intro:
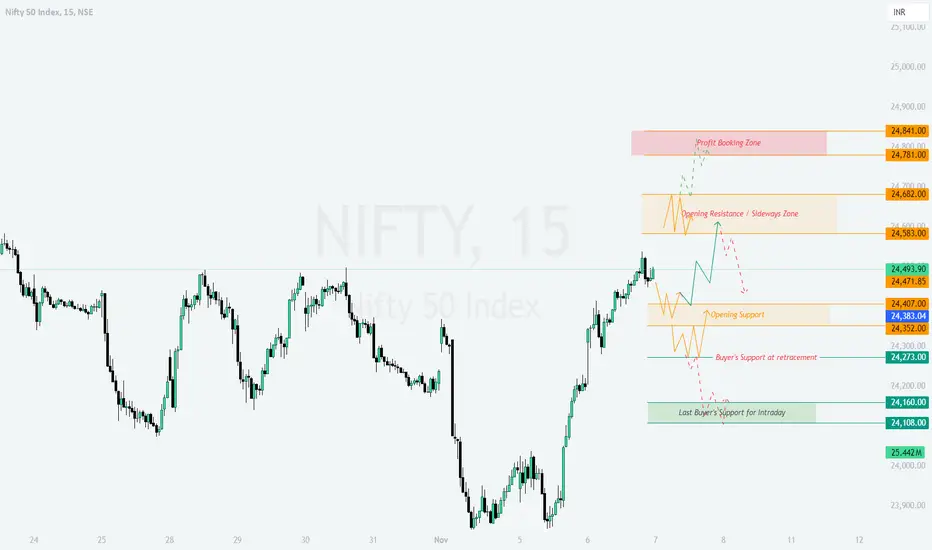
On the previous trading day, Nifty displayed a strong bullish movement, trading near resistance zones and showing signs of potential reversals. The key levels for today's session include the profit booking zone at 24,841 , opening resistance at 24,583 , and opening support around 24,407 . The chart’s yellow trend lines indicate potential sideways movement, green represents bullish scenarios, and red highlights bearish trends.
Opening Scenarios:
Gap Up Opening (100+ Points Above):
If Nifty opens with a gap up above 24,583 , closely monitor price action around the 24,781 - 24,841 profit booking zone. A strong breakout above 24,841 could indicate further bullish momentum, creating an opportunity for long entries with a stop-loss below 24,583 .
However, if resistance at this level holds, expect a retracement towards 24,583 . This can signal a potential reversal, allowing for short trades targeting the opening support near 24,407 .
Flat Opening:
If Nifty opens near 24,493 , focus on the levels at 24,583 (opening resistance) and 24,407 (opening support). Observe these zones for directional clues:
A move above 24,583 could test the profit booking area ( 24,781 - 24,841 ), creating a favorable long opportunity.
A rejection at 24,583 could suggest a sideways trend between 24,583 and 24,407 . In this range-bound scenario, consider small scalp trades with defined stop-losses.
Breaking below 24,407 may drive the index lower, with a potential target at 24,273 (buyer’s support at retracement).
Gap Down Opening (100+ Points Below):
If Nifty opens below 24,407 , look for support around 24,273 . A bounce from this level may provide an opportunity for a quick recovery trade towards 24,407 .
Should 24,273 fail to hold, bearish pressure could take Nifty towards 24,160 or even the last buyer's support at 24,108 . This scenario would favor short positions with stop-losses above immediate resistance.
If Nifty rebounds above 24,407 post-gap down, look for a potential pullback rally targeting 24,583 .
Risk Management Tips for Options Trading:
Define stop-loss levels based on critical support/resistance areas ( 24,583 , 24,407 , 24,273 ) to limit risk.
Avoid aggressive trades during high volatility; keep position sizes manageable.
Use hedged strategies, such as spreads, to control premium outlay and reduce risk.
Continuously trail stop-losses in favor of the trend to secure partial profits.
Summary and Conclusion:
The main levels to watch for Nifty on 07-Nov-2024 are 24,583 (opening resistance), 24,407 (opening support), and 24,273 (buyer’s support). Stay vigilant around these areas to capture potential breakout or reversal trades, and adhere to disciplined risk management in options trading to safeguard against volatility.
Disclaimer:
I am not a SEBI-registered analyst. This analysis is based on technical observations and personal insights. Please perform your due diligence or consult with a financial advisor before taking any trading actions.
Most Global Markets Welcome Donald TrumpMarkets breathed a sigh of relief it seems on the victory of Donald Trump and rallied crossing important trend line hurdle. Now 2 important resistance remain to be conquered before Bulls can claim victory over bears. The next likely resistance levels that bulls will face will be at 24537 and Mother line resistance at 24748. (50 days EMA). Once that is crossed the next likely resistance will be at 25000 and 25217. Supports for Nifty on the lower side seem to be at 24333, 24170, 23816 and finally Father line at 23519 (200 days EMA). Below 23519 in unlikely circumstances the Nifty will fall again in Bear clutch and bear can potentially drag it down to 23201 or 22820. (currently this looks unlikely). Shadow of the candle right now is neutral to positive.

NIFTY Soars Higher – All Eyes on Key Targets on RisologicalNIFTY Index Analysis:
NIFTY’s long trade setup on the 15-minute timeframe has already hit TP1 at 24,403.10. With positive momentum, we are now looking for it to reach the next targets, with TP2, TP3, and TP4 firmly in sight.
NIFTY Key Levels:
Entry: 24,178.95
Stop Loss (SL): 23,997.55
NIFTY Targets:
TP1: 24,403.10 (Achieved)
TP2: 24,765.90
TP3: 25,128.65
TP4: 25,352.85
Technical Indicator Confirmation:
The Risological Dotted Trendline continues to show a bullish trend, supporting further upward movement towards TP2 and beyond.
With TP1 already achieved, NIFTY traders should stay alert as we anticipate further gains towards the remaining targets.
Watch closely for potential breakthroughs at each level!

NIFTY : Trading Levels and Plan for 06-Nov-2024**Trading Plan for NIFTY on 06-Nov-2024**
Intro:
In the previous trading session, NIFTY showed a bullish momentum from the important levels highlighted in yesterday's Trading plan. The chart indicated multiple resistance and support levels, with specific zones highlighted for different scenarios. Yellow lines represent potential sideways movement, green lines indicate a bullish trend, and red lines signify a bearish trend. Observing the market's opening tomorrow in relation to these levels will guide the trading approach.
---
Trading Plan Scenarios:
For 06-Nov-2024, here are trading strategies for various opening scenarios:
Gap Up Opening (100+ Points):
If NIFTY opens with a significant gap up above 24350 (Opening Resistance), watch for signs of strength to sustain above this level.
- If it holds above 24350 , wait for a breakout confirmation before entering a long position. Target levels would be 24581 and 24682 , keeping in mind the Last Resistance for Intraday.
- If it fails to sustain above 24350 , be cautious of a pullback towards the Opening Support at 24156 .
- Watch for sideways movement (yellow trend) if NIFTY consolidates between 24350 and 24156 . Avoid trades during this sideways movement unless a clear direction emerges.
Flat Opening Near 24156 - 24144 Zone:
If NIFTY opens flat around the Opening Support levels, monitor the price action closely.
- A quick rejection from 24156 could indicate a reversal opportunity towards 24350 (Opening Resistance). Enter long if the price breaks above and sustains.
- In case of a breakdown below 24144 , NIFTY may test the lower support at 24020 . Consider short trades if there’s a clear break below this level, aiming for the "Best Buy Zone" near 23725 .
- Keep an eye on sideways movement in this range. Avoid trades if the trend remains unclear within this zone.
Gap Down Opening (100+ Points):
If NIFTY opens with a significant gap down, near or below the "Buyer's Support at Retracement" at 24020 , trade cautiously.
- If NIFTY shows buying interest around 24020 , it may present a buying opportunity, targeting 24156 as a recovery level.
- If the gap down leads to a breakdown below 24020 , watch for support around 23725 and 23579 in the "Best Buy Zone". Enter short if the bearish trend persists.
- Avoid early entries without confirmation of direction, as a gap down could lead to volatility. Use strict stop-loss levels.
---
Risk Management Tips for Options Trading:
- Stick to defined entry and exit points based on these levels and trends to avoid chasing price.
- For long positions, consider buying at-the-money calls if the price breaks resistance levels or sustains a bullish trend.
- For short positions, consider buying at-the-money puts near resistance rejections or if NIFTY trends down after a gap down opening.
- Use stop-loss orders consistently to manage potential losses. Avoid doubling down on losing positions in highly volatile market conditions.
---
Summary & Conclusion:
Focus on these key levels to navigate the trading day effectively. Monitor the price reaction to opening levels, as it will guide trade direction. Sideways movement could indicate a consolidating market, while breaks above or below specified zones may present entry opportunities.
Disclaimer: I am not a SEBI registered analyst. This analysis is for educational purposes only. Trade at your own risk and consult with a certified professional before making any trading decisions.

Nifty and BankNifty Update - 5 Nov 2024Hello Traders,
Watch the latest update on Nifty and BankNifty. As posted yesterday Nifty and BankNifty took reversal exactly from the level we mentioned in last post

Nifty Analysis: How much more pain left? Where is the bottom?Nifty Analysis:
1) Today's low 23816 is very important level to watch.
2) Next support at 23502 (Father Line or 200 days EMA).
3) Final Major support near 23201(Trend line meeting point and 50 weeks EMA (Major Mother Line).
4) Closing below 23201 has potential to break the hell loose.
5) Resistance on the upside at 24145, 24320, 24506 and 24781 (50 days EMA-Mother Line).
6) Bulls can take control only after we get a closing above 24781.
To know more about stop losses, trailing stop losses, Profit booking and investment, financial awareness in general, process of investment in Equity or Mother, Father and small child theory read my book The Happy Candles Way to wealth creation. Many People who have read it consider it as hand book and perfect guide to equity investment. You can read reviews of the book or purchase the same from Amazon. The book is available on Amazon in Kindle and paperback version. I am sure you are going to find it of massive use. Once you have read the book, I assure you that you will become a next level investor.
Disclaimer: The above information is provided for educational purpose, analysis and paper trading only. Please don't treat this as a buy or sell recommendation for the stock. We do not guarantee any success in highly volatile market or otherwise. Stock market investment is subject to market risks which include global and regional risks. We will not be responsible for any Profit or loss that may occur due to any financial decision taken based on any data provided in this message.

NIFTY : Trading Plan and Levels for 05-Nov-2024On 04-Nov-2024, Nifty showcased a strong downward trend followed by some consolidation. The session closed near 23,990, with critical support levels between 23,725 and 23,579, indicating a potential for a bounce in the coming session. Resistance is seen at 24,021, with a significant zone near 24,163. The Yellow trend indicates potential sideways movement, while the Green trend shows bullish prospects and the Red trend represents a bearish path.
Trading Plan for 05-Nov-2024:
Gap Up Opening (100+ points):
If Nifty opens with a 100+ point gap-up above 24,021, we could see a bullish move towards 24,163 (Intraday resistance). It’s essential to watch if prices sustain above this zone, as crossing this level could target the last intraday resistance of 24,319.
If Nifty fails to sustain above 24,163, expect a sideways move back towards 24,021. Traders should exercise caution here as any rejection from higher levels might signal a potential reversal.
Actionable Plan:
Buy on a sustained move above 24,163, with a target of 24,319.
Stop Loss: Below 24,021 on a 15-minute candle close.
Flat Opening:
If Nifty opens flat around 23,990, the focus will be on the reaction near 24,021 (opening support/resistance). A clear breakout above this level could push Nifty into a bullish zone, aiming for 24,163 and beyond.
However, failure to break this level will lead to a sideways consolidation (Yellow trend) or a possible retest of lower supports near 23,725.
Actionable Plan:
Buy on breakout above 24,021, targeting 24,163.
Sell below 23,953, with a target towards 23,725.
Stop Loss: Place tight stop losses at 23,990.
Gap Down Opening (100+ points):
If Nifty opens with a gap-down near 23,725 or below, the Best Buy Zone comes into play. Watch for bullish price action around this support level. Any strong bounce from here could lead to a recovery back to 23,953 or higher.
In case Nifty fails to hold 23,725, a further decline towards 23,579 could be on the cards, with a potential for a deeper correction.
Actionable Plan:
Buy near 23,725 with a target of 23,953.
Sell below 23,725, aiming for 23,579.
Stop Loss: Below 23,725 on a 15-minute candle close.
Risk Management Tips for Options Trading:
Always use strict stop losses, especially on volatile days.
Avoid holding positions overnight unless there’s a strong directional bias.
For options traders, consider entering at-the-money or slightly out-of-the-money options to benefit from quick price moves while managing risk.
Summary and Conclusion:
The key levels for 05-Nov-2024 are 24,021 for intraday resistance and 23,725 for strong support. A gap-up or flat opening should be monitored closely for breakouts above these resistance levels. A gap-down could provide an excellent buying opportunity near 23,725. Traders should stay cautious and respect the support/resistance zones, waiting for confirmation before taking trades.
Disclaimer: I am not a SEBI-registered analyst. This trading plan is purely based on technical analysis and psychological theories. Please consult with your financial advisor before making any trading decisions.

NIFTY : Trading Levels and Plan for 04-Nov-2024Intro for Previous Day's Chart Pattern:
In the previous two session, Nifty demonstrated a balanced movement with multiple attempts to break the support and resistance zones, suggesting potential consolidation. The chart highlights key areas where demand and supply forces are likely to react. Yellow trend indicates Sideways movement, Green trend shows a Bullish trend, and Red represents a Bearish trend.
---
Trading Plan for 04-Nov-2024:
Opening Scenarios:
Gap Up Opening (100+ points):
If Nifty opens with a significant gap up around 24,489 or higher:
- Watch for resistance near the ChCoCh Zone (Change of Character) at 24,489-24,533. If Nifty sustains above 24,533, it could indicate strong bullish momentum towards the 24,616 zone, marked as the “Last Intraday Resistance.”
- In case of a rejection from 24,489, wait for confirmation before initiating short trades, as prices may retest lower support levels.
- For conservative traders, it’s advisable to wait for a retracement back toward 24,286-24,265 levels before considering long entries.
Flat Opening:
If Nifty opens flat around 24,300:
- Focus on the immediate support level at 24,286. A successful defense of this support could trigger a bounce towards the 24,489-24,533 resistance area.
- If prices struggle to break through 24,286, look for opportunities to enter long trades near the “No Trading Zone” at 24,163.
- For intraday shorts, wait for bearish signals near 24,533 or if Nifty falls below 24,265, targeting the lower support at 24,020.
Gap Down Opening (100+ points):
If Nifty opens with a gap down around 24,163 or lower:
- Monitor the support levels at 24,020 and 23,958. These zones represent “Last Buyer’s Support for Intraday.” A break below 23,958 may trigger further downside pressure towards lower levels.
- If 24,020 holds, it could offer a buying opportunity with a potential target toward 24,286.
- For intraday trades, be cautious of volatility and await clear price action before entering positions, especially in gap-down scenarios.
---
Risk Management Tips for Options Trading:
- Limit your position sizes and keep a strict stop-loss in volatile conditions, especially post-Diwali.
- Monitor implied volatility as it can affect options premium significantly during high volatility sessions.
- Avoid chasing options trades if premiums have already inflated substantially post-market opening.
- Stay cautious around key levels to avoid whipsaws and consider taking partial exits at defined target levels to lock in profits.
---
Summary and Conclusion:
The 04-Nov-2024 session may witness reactions at critical support and resistance zones, presenting opportunities for both intraday and swing traders. Wait for a clear break of levels to confirm direction. Sideways consolidation could occur near the mid-range, so be prepared for both trend-following and range-bound strategies.
Disclaimer: I am not a SEBI-registered analyst. This trading plan is shared purely for educational purposes. Please conduct your analysis or consult a financial advisor before making any trading decisions.

#Nifty50 outlook for upcoming week 4th-8th Nov 2024Last week, the Nifty 50 index concluded at 24,304 points, marking a 125-point surge from the previous week's close. It reached a high of 24,498 and a low of 24,134. As anticipated, the index successfully tested the 24,500 resistance level before settling at its current position.
With the India VIX index indicating an upward trend, the Nifty 50 is expected to trade within a broader range of 24,900 to 23,700 in the coming week. A breach of these levels could trigger significant market volatility. The upcoming US elections on November 5th are likely to intensify the tug-of-war between bulls and bears.
I'm closely monitoring the 23,511 level (DEMA200) as a potential entry point for NiftyBees. However, it remains to be seen if this opportunity materializes.
S&P 500's Weekly Performance and Outlook
The S&P 500 index ended the week at 5,728 points, approximately 80 points lower than the previous week's close. It touched a high of 5,850 and a low of 5,702. This week, the index found support at the DEMA50 level. If it dips below 5,702 next week, it could test support levels at 5,637, 5,585, and 5,400, which would have negative implications for global markets.
To resume its upward trajectory, the S&P 500 needs to close above 5,700 on consecutive days. This could propel it towards the 5,821, 5,868, and 5,899 levels.

FIIs continue to weigh in on Nifty Index. Unblemished sell off from FIIs has dampened the festive mood of investors in the Indian markets. Looks like there was not much support for DIIs today as Retails investors might be busy with Diwali festival so FIIs today had a clear upper hand. There are signs of bottom formation and Higher high higher low pattern is formed on Nifty. Unless we have a closing below 24172 or 24069 levels, I think the things will hold. If we get a closing below 24K bears and FIIs can push Nifty further down to 23.8K or 23.2K levels. Thus supports for Nifty are at 24172, 24142 and 24069 levels. Resistances for Nifty remains at 24242, 24370, 24395, 24505, 24601, 24702 and finally 24811 levels.
Disclaimer: The above information is provided for educational purpose, analysis and paper trading only. Please don't treat this as a buy or sell recommendation for the stock. We do not guarantee any success in highly volatile market or otherwise. Stock market investment is subject to market risks which include global and regional risks. We will not be responsible for any Profit or loss that may occur due to any financial decision taken based on any data provided in this message.

NIFTY : Trading Levels and Plan for 31-Oct-2024
Intro:
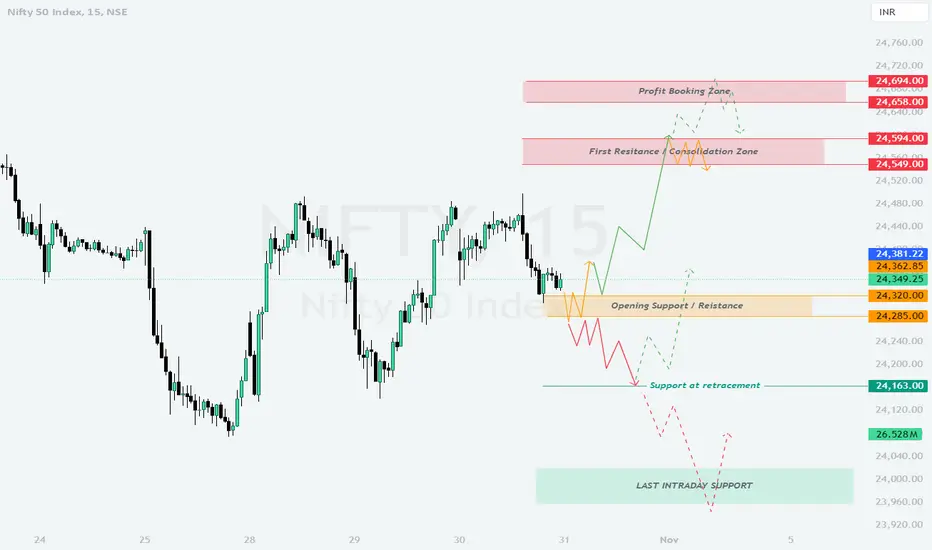
On the previous trading day, Nifty exhibited a mix of consolidation and upward momentum, with notable resistance zones tested near 24,594 . Key levels for 31-Oct-2024 have been identified, with trends marked as follows: yellow for sideways movement, green for bullish momentum, and red for bearish sentiment. This plan provides strategies for different opening scenarios.
Trading Plan for 31-Oct-2024
Gap Up Opening (100+ points above)
If Nifty opens 100+ points above the previous close, it may test the First Resistance/Consolidation Zone near 24,594 . If the index sustains above this level, we may see a push towards the Profit Booking Zone at 24,694 . However, if it struggles to hold above 24,594 , expect a retracement towards the Opening Support/Resistance level at 24,320 .
– A reversal from the resistance levels could prompt a move back to the Support at Retracement at 24,163 .
Flat Opening (within 50 points of the previous close)
For a flat opening, the key level to watch is 24,349 . Sustaining above this point could lead to a breakout, targeting 24,594 and possibly extending towards the Profit Booking Zone at 24,694 . Conversely, if momentum fails above 24,349 , Nifty might move sideways around 24,320 or even test the lower support at 24,285 .
– A downside break below 24,285 could increase bearish pressure, with potential support found at 24,163 .
Gap Down Opening (100+ points below)
In a gap-down scenario, initial support may be found near 24,285 . A rebound from this level could bring the price back toward 24,349 . If the index sustains above 24,349 , bullish momentum could retest the resistance at 24,594 . However, if 24,285 fails to hold, a decline towards Support at Retracement near 24,163 is likely.
– Persistent weakness below 24,163 might drive further downside towards the Last Intraday Support at 24,040 .
Risk Management Tips for Options Trading
Manage your position sizes wisely, especially when volatility is high.
Consider deploying trailing stops near major resistance/support levels to protect gains.
Options spreads can limit risk exposure, which is particularly useful in a choppy market.
Summary and Conclusion
The primary focus for 31-Oct-2024 remains on the resistance at 24,594 and support at 24,163 . Traders should stay flexible with these levels and use disciplined stop-loss strategies to manage risks. Observing the price action after the opening will provide better insight into the day’s trend.
Disclaimer:
I am not a SEBI-registered analyst. This analysis is based on technical levels and reflects my personal view. Please perform your own analysis or consult a financial advisor before trading.
NIFTY : Trading Levels and Plan for 29-Oct-2024
Intro:
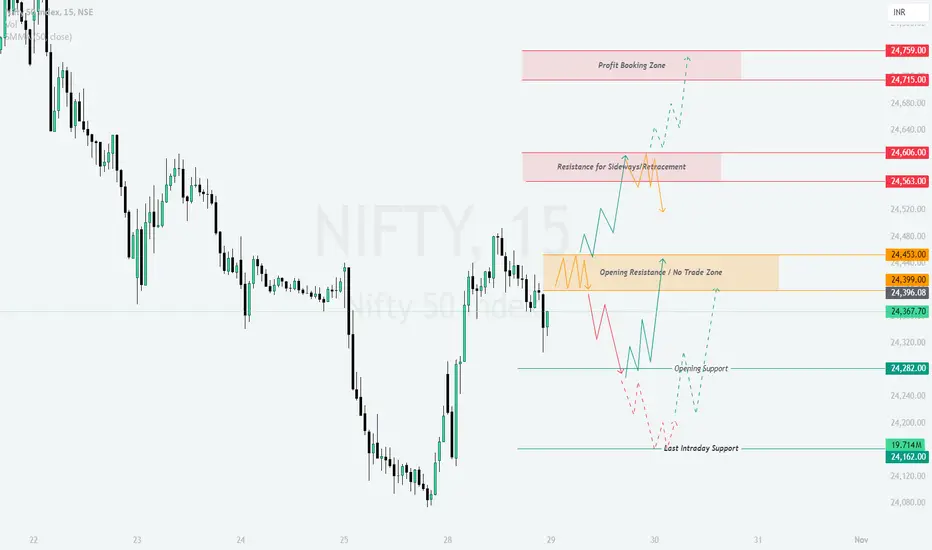
On the previous day, Nifty displayed a upward movement from the provided levels in yesterdays trading plan and minor fluctuations within key levels. The chart illustrates potential sideways movement in yellow , an expected bullish trend in green , and a bearish trend in red . For today's trading, we will observe various opening scenarios and outline strategies accordingly.
Trading Plan for 29-Oct-2024
Gap Up Opening (100+ points above)
If Nifty opens with a 100+ points gap up, it is likely to face resistance near the 24,453 - 24,563 range, which is marked as the Opening Resistance / No Trade Zone . Observe price action here. If Nifty sustains above 24,563 , it may target the Profit Booking Zone around 24,715 - 24,759 . However, if it fails to break above the resistance, expect a potential retracement towards the Opening Support at 24,282 .
– In case of strong selling pressure, Nifty could pull back further, aiming toward 24,162 as a potential support.
Flat Opening (within 50 points of the previous close)
With a flat opening, focus on the initial 30 minutes to gauge market sentiment. If prices sustain above the 24,453 level, we may see a push toward 24,563 . A breakout above 24,563 will likely lead to a bullish trend targeting Profit Booking Zone at 24,715 - 24,759 . However, if it fails to sustain above the No Trade Zone , expect sideways movement or a dip toward 24,282 .
– Any move below 24,282 could potentially extend towards 24,162 , testing the Last Intraday Support level.
Gap Down Opening (100+ points below)
In a gap-down opening, monitor the 24,282 level as the immediate support. If it holds, Nifty may attempt to retest the Opening Resistance Zone around 24,453 . A breakout above this level could bring sideways or bullish momentum up to 24,563 . Failure to reclaim 24,282 may lead to further downside pressure, potentially pulling prices to the Last Intraday Support at 24,162 .
– Watch for price stability around 24,162 if it is reached, as this may serve as a potential reversal point.
Risk Management Tips for Options Trading
Consider setting a defined stop-loss for each options position based on volatility levels; hourly candle closes can be useful for managing intraday risk.
Avoid over-leveraging. In options trading, position sizing should reflect the inherent risk and potential for quick price changes.
Utilize trailing stops to lock in profits if Nifty moves favorably. This is particularly effective in highly volatile sessions.
Summary and Conclusion
Today, focus on the key zones: 24,453 - 24,563 as resistance and 24,282 as support. A break above or below these levels could set the day's trend. Use a balanced approach, aligning with the prevailing sentiment indicated by the chart structure.
Disclaimer:
I am not a SEBI-registered analyst. This analysis is based on personal views and technical parameters. Please conduct your research or consult a financial advisor before making any trading decisions.
Technical bounce in Nifty today, recovery can be a long processToday what we saw can be called as technical recovery by Nifty in the process of bottom formation. Actual recovery can still be a long process. Bulls can be back inn business only if we get a closing above mother line of 50 days EMA that is at 24898. 24898 is a critical level because mid channel resistance for the current parallel channel as well as Mother line. Whether Nifty can weather the storm and move ahead is only a question which time will answer in the short term. Long term investors can see current situation as partial entry zone for large and mid-caps which have given a good result this quarter or are giving a good result.
Supports for Nifty remain at: 23865, 23684, 23464 (Father line Strong support 200 days EMA) and 23626 (Strong Parallel Channel Bottom Support).
Resistances for Nifty Remain at: 24492 (Today's high and strong Trend line resistance), 24679, 24898 (Strong Mid-channel and Mother line resistance of 50 days EMA), 25221 and 25623.
Strong momentum and positive action has potential to take Nifty back to 26K+ levels. As on date even after strong resilience shown by Nifty FIIs are still on the selling side as they were net sellers of Equity worth Rs.3228 Crores. DIIs and Retail investors have been on the buying side at every dip. This is what is not allowing the Nifty to fall currently beyond 200 days EMA. Let us see who given in first. Very interesting tussle going on between FIIs and DIIs + Retail investors combination. Shadow of the candle for tomorrow is neutral to slightly positive but it is hanging by a thin thread. (Approach for long term should be cautious but positive. Approach for short term is still very cautious as we are not out of deep waters).


NIFTY : Trading Levels and Plan for 28-Oct-2024Nifty Trading Plan for 28-Oct-2024
**Previous Day Recap**: Nifty experienced volatility yesterday, with a downward bias. Major support levels held around the **24080-24100** mark, indicating potential buying interest. However, resistance levels remain active, with **24,276** serving as a pivot zone. For today, trends are illustrated as follows:
- **Yellow** trend signifies a sideways market.
- **Green** trend indicates a bullish outlook.
- **Red** trend reflects a bearish sentiment.
Opening Scenarios for 28-Oct-2024
Gap Up Opening (+100 points or more)
If Nifty opens with a gap up of 100+ points:
- Immediate resistance can be seen at **24,276**. A break above this may push the index towards the **24,392** level, which acts as the Last Resistance for Intraday .
- Consider booking profits if Nifty approaches the **24,531 - 24,589** zone (highlighted as Profit Booking Zone ) as sellers might attempt to re-enter.
- If resistance at **24,276** holds and shows weakness, expect a potential pullback towards **24,143** for support.
Flat Opening
In case of a flat opening near **24,210**:
- Initial support is at **24,191**, followed by a stronger base around **24,143**.
- If Nifty moves up from these levels, the next resistance can be expected at **24,276**. Watch closely for consolidation in this area, as a breakout could trigger a rally toward **24,392**.
- A failure to hold support at **24,143** could signal a downtrend, targeting **23,998** and below.
Gap Down Opening (-100 points or more)
For a gap down opening of -100 points or more:
- Initial support will likely emerge around **23,998**. If this holds, a bounce is expected toward **24,143**.
- If **23,998** breaks, the next significant support level sits at **23,740**, marked as the Possible Bottom Zone for Current Trend . This is a critical level; a breach could lead to a deeper correction towards **23,590**.
- A recovery from this lower level may indicate reversal buying, ideal for intraday long positions up to **24,086**.
Risk Management Tips for Options Trading:
- Always define your stop-loss levels based on the nearest support/resistance zones to manage risk effectively.
- Avoid aggressive positions in high-volatility scenarios like gap openings. Start small and scale up if the trend confirms.
- Be cautious of time decay when trading options, especially if the price is near critical support or resistance zones.
- Consider hedging positions if holding overnight, given the volatility in global markets.
Summary and Conclusion
For 28th October 2024, key zones to watch are **24,276** on the upside and **23,998** on the downside. A breakout or breakdown from these levels could determine the day’s trend. Remember that the market may consolidate before choosing a direction, and it’s wise to wait for confirmation at these levels before entering trades.
Disclaimer: I am not a SEBI-registered analyst. This analysis is for educational purposes only. Always consult a financial advisor before making any trading decisions.
