#NIFTY Intraday Support and Resistance Levels -30/01/2024Nifty will be gap up opening in today's session. After opening nifty sustain above 21780 level and then possible upside rally up to 21900 level in today's session. in case nifty trades below 21730 level then the downside target can go up to the 21610 level.
Niftylevels


Nifty Intraday Levels for 29-Jan-24Currently Nifty Near Resistance zone
Bullish > 21500
Bearish < 21350
Wait for rejections at Major S/R zones.
All views for Educational purpose do your own research for any trade.

National aluminium 3rd December 2023 Hindi languageIn national aluminum, we have seen a brief history level and expected moves. We have marked few levels for upward and downward move We have to mark 9 4.5 or 95 level For approved target of 100 with Stop loss of 91 If we crossover 102 with confirmation closing then we can see 112 and 115.
This is only for informational and educational purpose only. Please do your own research before taking any action. Thank you

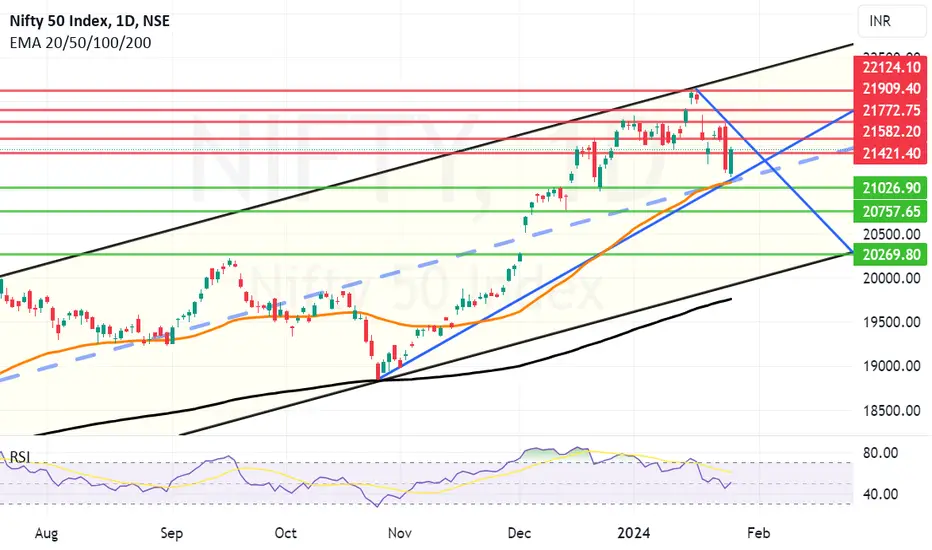
Very good Daily candle showing the fightback of NiftyWe saw a very good Daily candle showing the fightback of Nifty a closing above important résistance of 21421 indicates that we might be heading towards 21500+ tomorrow if global factors keep the things bright. In this case the resistance that Nifty will face will be at 21582(Major resistance), followed by 21684 and 21772. On the lower side the supports for Nifty will be at 21412, 21137 and 21080 (Major support 50 days EMA and Mid-Channel resistance). Things are poised interestingly with shadow the candle looking slightly positive for the start tomorrow.
Nifty 15 Min tf Trade for thursday Nifty expiry This will help you to analyse Nifty Sentiments better and trade cautiously NSE:NIFTY

#NIFTY Intraday Support and Resistance Levels -24/01/2024Nifty will be gap up opening in today's session. After opening nifty sustain above 21260 level and then possible upside rally up to 21380 level in today's session. in case nifty trades below 21220 level then the downside target can go up to the 21100 level.

Strong Resistance ensures steep fall in Nifty. Strong Resistance zone of 21607 to 21857 sends Nifty in a downward spiral and makes it topple towards 50 days EMA(Mother Line). This has lead to frantic fall in RSI of Nifty. On 15th January the Rsi of Nifty was 73.88 today it is 44.88. Still little bit of cool down in RSI can not be ruled out. The immediate support for Nifty is near 21218. This is a weak support which may not hold but you never exactly know. The next support if 21218 is broken will be near 21065. 21065 in not only the Mother Line (50 days EMA) but also the mid channel support on the daily chart making it a very strong support. If 50 EMA does not hold the bears will tighten the grip on the stock market and may try their best to bring the Nifty to 20794. Holding 21065 or 20794 will be very important and the levels to watch out for. If these do not sustain we may see 20297, 19849 or even 19738.

NIFTY--@Trendline Retest??Nifty broken the major trendline
In the previous sessions price is retested the same trendline and showing Bearishness from the supply zone.On bottom side strong demand zones lies at 20800 levels.
If this trendline acts as resistance we will observe a continuous Bearishness in nifty upto 20800 levels.
If we observe consolidation between 21700-21300, will expect a fall below 21300 and then have a rise again towards ATH.
Note:
If trendline failed to push down side, liquidity grab above the trendline will observe and a fall happens again.

Nifty positional making money.Monday intraday<>
Mild gap up or flat opening will be good to go longs and resistance should hit first before it takes support once again.
Huge gap down will be neglected the view.
IMPORTANT-20300-20500 gap will fill before budget or after the budget it may fill depending on financial news.
>Just follow the trend you will never be in loss.
>Don't predict before closing levels for traps.
>Wait for the retest level which will be secure
and can avoid huge losses.
>Profit bookings according to your capital %.
>Don't use indicator on daily basis as stop loss can hit easy.

Mid-Channel Resistance again stops Nifty and pushes it down50 hours EMA (Mother line)(Those who know my Mother/Father/Small Child story can understand it very well) was a very important resistance to be crossed and held today but Nifty could not hold on to it after crossing it once. In addition to the 50 EMA there was also Mid-Channel resistance. which could not be crossed. Additionally there is a trend line resistnace, Nifty has to cross this for further growth. There was lack of volume and next week is a 3 day week so lot of traders/investors did not carry long positions. The support and resistance zones remain at:
Support Zone : 21539, 21430(Very important 200 hours EMA) support (Father Line) and finally 21285 (Channel bottom support). Bears can tighten their grip below this point.
Resistance Zones : 21600, 21674 (50 Hours EMA)(Mother Line), 21756 (Mid Channel resistance) and finally 21847. Above 21847 Bulls will strengthen their grip.

NIFTY--Supply zone@21700 ??After a strong fall, expecting some retracement in nifty.
on topside supply zone is identified at 21650-21700 levels.
so liquidity is lies above and below this levels,
after testing these levels again have a chance of fallback to test the demand zones at 21300 levels and at 20800 levels.
If 21300 level fails to push it upside, quick drop and rise will see in coming sessions.
so this week mostly in this range 21700-21300 levels.
Be careful, long after 21700 short below 21300.

Nifty trapped between strong support and strong resistanceRight now Nifty seems to be trapped between strong support and strong resistance. The support zone is 21415 to 21581. Resistance zone is 21670 to 21847. Nifty needs little bit of consolidation in the range. Results from various companies will drive the nifty forward in either direction. The interim budget is also around the corner that can also be a guiding light for Nifty. Wild swings in either direction in addition to Geo-Political events can also turn the fate of Nifty and things can turn cloudy in a session or two. My advice for now will be stick to large caps and selective mid and small caps with ethical management and strong fundamentals and avoid companies with low durability, high debt, high pledging and questionable ethics. Which should be the case anyway but more so with Macro and Micro global situations and events which are in progress and around the corner.

Nifty trying to form bottom after taking channel bottom supportNifty trying to form a bottom after taking channel bottom support. Nity touched the bottom of our hourly channel and trying to consolidate in the zone. Major support for Nifty from here will be 21405 (200 Hours EMA) (Father Line) and Channel bottom 21285. If 21285 is broken Nifty may fall further till 21089 or even 20967. On the way up major resistances that Nifty will face now are 21544, 21650 and 21715 (Major Resistance 50 Hours EMA). Also note that Mid channel channel resistance is also near 21740 region. So 21715 to 21740 will be major resistance on the way up. Nifty might try to stage a recovery tomorrow but let us see if the levels hold. Weekly closing is important with Geo-Political tensions rising between Iran and Pakistan. As well as Afghanistan and Pakistan.

BANK NIFTY TARGET LEVELS 19.01.2024KINDLY DRAW THE LINES IN YOUR TRADING VIEW CHART
Draw And Watch My Startegy
Bank Nifty - Break Even Point : 45779.1 ADD +/- : 120 Points
Nifty 50 - Break Even Point : 21581.4 Add +/- : 27 Points
Fin Nifty - Brek Even Point : 20537 Add +/- : 37 Points
By Market1Tomorrow
