TVSmotors will it break or trap!! 2970 close very imptvs motors trading at its ATH range RSI also at major lvls..
Niftylong

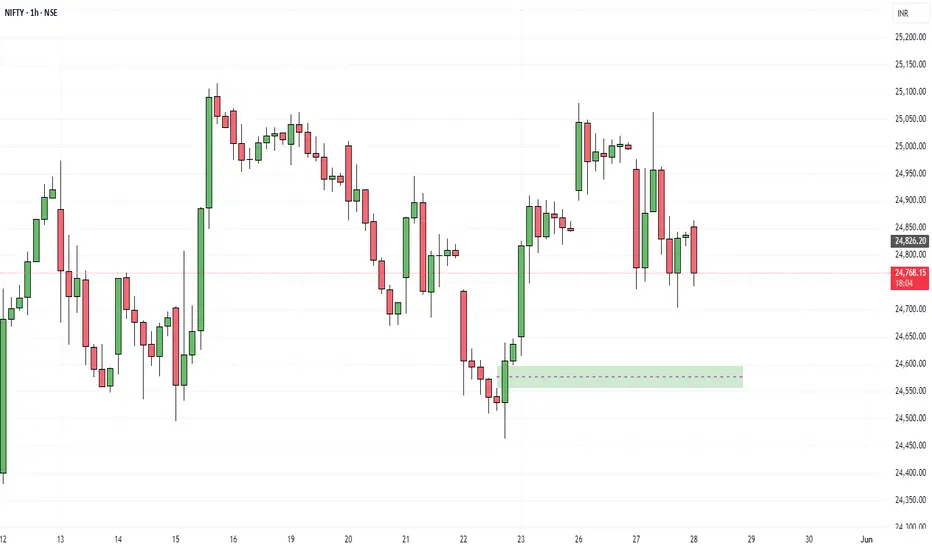
My Recent Trade In Nifty 50 ... On 1 hour time frame nifty is coming to get liquidity on FVG drew here.. after it may go to 25,000. let's see what happens...

Important Level For Nifty.Here in one hour time frame nifty is coming to get some liquidity as you can see, after getting liquidity nifty may again go higher and make a new high.
Nifty 50 If you find this helpful and want more FREE forecasts in TradingView, Hit the 'BOOST' button
Drop some feedback in the comments below! (e.g., What did you find most useful?
How can we improve?)
Your support is appreciated!
Now, it's your turn!
Be sure to leave a comment; let us know how you see this opportunity and forecast.
Have a successful week
DISCLAIMER: I am NOT a SEBI registered advisor or a financial adviser. All the views are for educational purpose only

$NIFTY in bullish momentum. More upside-expectedDuring the last few days, we have been discussing the weakness in the US Dollar and the TVC:DXY index and what it means for the commodities like Gold ( AMEX:GLD ) and Oil ( TVC:USOIL ). But we never discussed the positive effect it has on the emerging markets like $NIFTY. The index NSE:NIFTY which consists of top 50 stocks based on market cap in India is having a positive momentum divergence after touching the lower bound of the upward sloping Fib retracement levels. Here in this blog space on 17th March we posted that NSE:NIFTY looks oversold and we might be ready for a bounce. We favored going long NSE:NIFTY at 22000. Since then, the RSI bottomed and we up 8% form the lows of 22032.
If we still follow the Fib levels from the last blog, the charts are telling us that we might be headed to 25000 before having any meaning full pullback. The index internals look healthy with RSI hovering around 50 and not in overbought territory. And the tailwind to all this is still the US Dollar story. Here we are targeting 95 in the TVC:DXY on a short-term basis. This might push NSE:NIFTY to 25000 and beyond.
Verdict : NSE:NIFTY rally continues to 25000; TVC:DXY to 95.

NIFTY Futures | Liquidity Sweep + Bullish Structure Shift NIFTY Futures (15min) – Technical Analysis using SMC | ICT | Price Action
1. Price took liquidity below 22,405, sweeping sell-side stops — a common smart money move
before reversing.
2. A clear market structure shift occurred as price broke previous swing highs after the liquidity
grab.
3. Price is currently reacting from a bullish order block between 22,440 – 22,480, showing signs
of accumulation.
4. The entry aligns with ICT’s Optimal Trade Entry (OTE) zone near the 61.8% Fibonacci
retracement level.
5. Price was consolidating in a tight range (5min) and has now started breaking out to the
upside.
6. There is a visible imbalance / fair value gaps between 22,760 – 22,920 that price may look to
fill.
7. Immediate targets are:
- 22,760 (start of imbalance)
- 22,920 (buy-side liquidity above recent highs)
- 23,250 (clean inefficiency zone)
- 23,310 (major resistance / previous high)
8. The setup becomes invalid if price breaks and closes below 22,405 — that’s the stop-loss level.
Thanks for your time..

NIFTY : Trading Levels and Plan for 31-Mar-2025📌 NIFTY Trading Plan – 31-Mar-2025
📊 Market Overview:
Nifty closed at 23,495, showing mixed sentiment near the Opening Support Zone (23,401 – 23,465). The market is at a crucial juncture, with potential bullish momentum above resistance levels, while breakdowns below key supports may trigger selling pressure.
This plan will help you react strategically to different opening scenarios, ensuring a favorable risk-reward ratio.
🔼 Scenario 1: Gap-Up Opening (100+ points above 23,600)
A gap-up above 23,600 signals bullish momentum, but for sustained upside, Nifty must stay above 23,642 – 23,842. Watch for rejection at resistance zones, as profit booking can lead to reversals.
✅ Plan of Action:
If Nifty sustains above 23,772, expect a move towards the next resistance at 23,925 – 23,990. A breakout above 23,990 could open doors for 24,050+.
If price faces rejection at 23,842, a pullback towards 23,642 → 23,495 is possible. If it breaks below 23,495, expect further downside.
Avoid aggressive longs inside 23,642 – 23,842, as this is a potential reversal zone. Wait for a decisive breakout or rejection confirmation.
🎯 Pro Tip: If the gap-up is filled within the first 15-30 minutes, it suggests weak buying pressure and increases the probability of a reversal.
⚖ Scenario 2: Flat Opening (Within ±100 points, around 23,500)
A flat opening near 23,495 indicates indecision. The market will take direction after the first few candles, so breakouts or breakdowns from key levels should be closely monitored.
✅ Plan of Action:
Upside case: If Nifty breaks and sustains above 23,642, it may head towards 23,772 → 23,925. Monitor price action near these resistance levels before entering fresh longs.
Downside case: If Nifty breaks below 23,495, it could test 23,336 → 23,164. A breakdown below 23,164 will shift the trend bearish.
Avoid trading inside the No Trade Zone (23,495 – 23,642), as price could consolidate before a breakout.
🎯 Pro Tip: In a flat opening, wait for a clear 15-minute candle close above or below key levels before entering trades.
🔽 Scenario 3: Gap-Down Opening (100+ points below 23,400)
A gap-down below 23,400 may indicate fresh selling pressure, making it crucial to observe whether buyers step in at support zones.
✅ Plan of Action:
If price sustains below 23,400, expect a decline towards 23,336 → 23,164. A breakdown below 23,164 could lead to a sharp fall towards 23,100.
If price finds support at 23,164 and rebounds, it may recover towards 23,336 → 23,495. A strong close above 23,495 will shift momentum back to the bulls.
Be cautious of bear traps – If the market gaps down but quickly recovers, it could trigger short covering, leading to a strong upside reversal.
🎯 Pro Tip: If the gap-down occurs near a strong buyer’s support zone, wait for a bullish price action confirmation before entering long trades.
⚠️ Risk Management Tips for Options Traders
🔹 Avoid over-leveraging – Use proper position sizing to manage risk.
🔹 Theta Decay Awareness – If the market consolidates, option premiums will erode rapidly.
🔹 Use Spreads for Protection – Instead of naked options, use spreads to limit risk and improve probability.
🔹 Trade at Key Levels – Avoid impulsive trades; focus on defined support and resistance zones.
📌 Summary & Conclusion
📍 Key Levels to Watch:
🟥 Resistance: 23,772 → 23,925 → 23,990
🟧 No Trade Zone: 23,495 – 23,642
🟩 Support: 23,336 → 23,164 → 23,100
🔸 Bullish Bias: Above 23,642, targeting 23,772 – 23,925
🔸 Bearish Bias: Below 23,400, expecting a fall towards 23,336 – 23,164
🔸 Neutral/Choppy: Inside 23,495 – 23,642, avoid unnecessary trades
🎯 Final Advice:
Stick to the structured trading plan and execute only at key levels.
Avoid emotional trading—wait for confirmation before entering trades.
The first 15-30 minutes after market open will provide better clarity—observe price action before committing to a trade.
📢 Disclaimer
I am not a SEBI-registered analyst. This trading plan is for educational purposes only. Please conduct your own research or consult a financial advisor before making any trades.

NIFTY : Levels and Plan for 27-Mar-2025📊 Market Context:
NIFTY closed at 23,464.30, experiencing a minor pullback after a previous uptrend. The index is currently at a crucial support zone, where price action will determine the next movement.
Let’s analyze the plan for different opening scenarios and structure our trades accordingly.
🔼 Scenario 1: Gap-Up Opening (100+ points above 23,590)
A gap-up above 23,590 will place NIFTY near its Opening Resistance. This level is important because it has previously acted as a supply zone, and bulls need strong momentum to sustain above it.
✅ Plan of Action:
If price sustains above 23,590, we can expect a bullish move towards the Last Intraday Resistance at 23,660. A breakout above this level may extend gains to 23,780+.
If price gets rejected from 23,590 and starts reversing, look for a shorting opportunity, targeting 23,501 → 23,464.
Avoid aggressive long trades inside the 23,590 – 23,660 zone unless there is a clear breakout with volume.
🎯 Pro Tip: If the gap-up is weak and fills within 15 minutes, it indicates profit booking, leading to a possible retracement.
⚖ Scenario 2: Flat Opening (Within ±100 points, around 23,464)
A flat opening suggests market indecision, requiring confirmation before entering a trade.
✅ Plan of Action:
Upside case: If NIFTY breaks above 23,501, it can move towards 23,590. Observe price action at this level before deciding on further longs.
Downside case: If NIFTY breaks below 23,464, expect a decline towards the Opening Support Zone (23,501 – 23,477). A breakdown below 23,477 could trigger a deeper fall to 23,297.
Neutral Zone: If the index trades between 23,464 – 23,501, it indicates a choppy market. Avoid unnecessary trades here.
🎯 Pro Tip: A flat opening often leads to fake breakouts in the first 15 minutes. Wait for a strong candle close before entering a position.
🔽 Scenario 3: Gap-Down Opening (100+ points below 23,350)
A gap-down below 23,350 will put NIFTY near its Last Intraday Support Zone (23,297 – 23,343). If this level fails, further downside is possible.
✅ Plan of Action:
If price sustains below 23,350, expect a test of 23,297. A breakdown here could lead to heavy selling towards 23,182 – 23,100 levels.
If price rebounds from 23,297, it could trigger a pullback towards 23,464. Watch price action at 23,464 – 23,501 for signs of rejection or continuation.
Be cautious of bear traps—if price quickly reverses after a sharp gap-down, it might indicate a short-covering rally.
🎯 Pro Tip: In a gap-down scenario, avoid panic selling. Watch for reversals from key support levels before initiating fresh shorts.
⚠️ Risk Management Tips for Options Traders
🔹 Avoid over-leveraging – Keep your position sizing disciplined to minimize potential losses.
🔹 Theta Decay Awareness – If the market consolidates, option premiums will erode quickly.
🔹 Hedge Your Trades – Use spreads instead of naked options to reduce risk.
🔹 Wait for Confirmation – Enter trades only after a breakout/breakdown is retested with volume.
📌 Summary & Conclusion
📍 Key Levels to Watch:
🟥 Resistance: 23,590 → 23,660 → 23,780
🟧 No Trade Zone: 23,501 – 23,464
🟩 Support: 23,501 → 23,297 → 23,182
🔸 Bullish Bias: Above 23,590, targeting 23,660 – 23,780
🔸 Bearish Bias: Below 23,350, expecting a fall towards 23,297 – 23,182
🔸 Neutral/Sideways: If price remains between 23,501 – 23,464, avoid unnecessary trades.
🎯 Final Advice:
Stick to the plan and trade only at key levels.
Avoid trading inside No Trade Zones.
Let the market settle for 15-30 minutes before making big moves.
📢 Disclaimer
I am not a SEBI-registered analyst. This trading plan is for educational purposes only. Please conduct your research or consult a financial advisor before trading.

NIFTY : Intraday Trading levels and Plan for 25-Mar-2025📊 Nifty Trading Plan – 24-Mar-2025 (Educational & Strategy-Oriented)
Chart Timeframe: 15-Min | Key reference zones marked on chart
📍
🚀 GAP-UP Opening (Above 23,407)
If Nifty opens with a gap-up above 23,407, it will enter the Wave 3 Resistance Zone (23,508 – 23,582), which is a high-probability reversal zone.
✅ Plan of Action:
• Don’t rush into buying after the gap-up. Wait and observe the price behavior around 23,508 – 23,582.
• This area is likely to witness profit booking or short build-up.
• Look for signs of reversal like bearish engulfing, shooting star, or bearish divergence on RSI.
• If such patterns form, consider buying Put Options (OTM PE) with a stop-loss on a 15-min candle closing above 23,585.
• If Nifty sustains above 23,582 with strong volume, then we might be heading into an extended up-move, but this is lower probability.
• Safer trades are shorting on signs of exhaustion at higher levels.
📌 Key Zone to Watch: 23,508 – 23,582 (Wave 3 Resistance)
📈 FLAT Opening (Between 23,245 – 23,407)
This is the Opening Resistance / Support Band (23,345 – 23,407), acting as a decision-making zone.
✅ Plan of Action:
• Let the market settle in the first 15–30 mins.
• If price holds and builds strength above 23,345, Nifty may climb towards 23,407, and if broken, test 23,508+.
• Weak price action (rejection wicks or low volumes) from 23,345–23,407 signals weakness. In that case, look for short opportunities with SL above 23,407.
• Avoid CE entries unless price sustains above 23,407 with momentum and volume breakout.
• If price starts to slip below 23,245, sellers will get more active and price could drop quickly to next support.
📌 Key Decision Zone: 23,345 – 23,407
📌 Support Trigger: 23,245 (Opening Support)
📉 GAP-DOWN Opening (Below 23,245 or near 23,185 – 22,985)
If Nifty opens below the Opening Support at 23,245, or even near deeper support zones of 23,185 or 22,985, it will bring in volatility and create both breakdown and reversal opportunities.
✅ Plan of Action:
• A gap-down near 23,185 should be watched carefully. This is a minor intraday support. If held with a bullish candle (like a hammer), consider buying CE with SL below 23,160.
• If the gap-down extends to 22,985 (Last Support for Intraday), it's a strong bounce zone. A bullish reversal candle here provides high RR long trades.
• If price fails to hold 22,985, sellers may dominate and drag Nifty further down. Consider PE trades only after a 15-min close below 22,985.
• Avoid panic trading – let the zone react and only act based on confirmation candles.
📌 Bounce Zones: 23,185 and 22,985
📌 Breakdown Trigger: Below 22,985
🛡️ Risk Management Tips for Options Traders:
• Avoid trading first 5–15 mins after opening, especially on gap days – let price give structure.
• Use hedged strategies like Bull Call or Bear Put Spreads to reduce premium loss due to theta decay.
• Trade light near reversal zones – don’t go all-in on emotional conviction.
• Always place stop-loss on closing basis (15-min candle), not fixed points, especially during volatile moves.
• If VIX is high, premiums are inflated – focus on quick entry & exit, no holding hoping for magic.
📌 Summary & Conclusion:
• Nifty has entered a critical decision zone.
• Watch 23,407 carefully – above it, bulls may attempt a final push to 23,582, but signs of exhaustion there are likely.
• On the downside, supports at 23,185 & 22,985 will act as bounce zones.
• Directional trades should be initiated only after price confirms intent post opening.
• Use structure + volume for confidence in setups.
⚠️ Disclaimer: I am not a SEBI-registered analyst. The above content is for educational purposes only. Please do your own analysis or consult a certified financial advisor before making any trading decisions.

NIFTY Trading Levels and Plan for 21-Mar-2025📅 NIFTY Trading Plan – 21-Mar-2025
📍 Reference Price: 23,190 (Close on 20-Mar-2025)
📊 Chart Structure: Price is nearing exhaustion at highs, so we need to observe for either continuation or reversal from resistance zones.
📌 Opening Scenario 1: GAP-UP Opening (100+ Points)
🟢 Expected Open Zone: 23,270 – 23,330
👉 If Nifty opens with a strong gap-up above 23,270: Watch for price action near 23,345 , marked as the last strong intraday resistance . If you see rejection (like wick rejections or bearish engulfing on 5m/15m), consider initiating short positions with a stop loss above 23,370. On clean breakout and sustained move above 23,345, target the Profit Booking Zone: 23,407–23,445+ . Be cautious chasing longs on a gap-up unless price consolidates and confirms breakout.
🎯 Key Tip: Don't short just because it's a gap-up. Let the candle give confirmation through rejection patterns.
📌 Opening Scenario 2: FLAT Opening
🟠 Expected Open Zone: 23,150 – 23,190
👉 In case of flat to mild gap open: Watch 23,185 as the immediate Opening Resistance / Support .
If price sustains above 23,185 with strength, you can look for a long entry targeting 23,345 and beyond.
However, if price struggles and fails to cross 23,185 with rejection patterns, short toward 23,068 and 22,994.
Breakdown below 23,068 may accelerate profit booking till the lower zone of 22,994–22,882.
🎯 Key Tip: The first 15–30 mins are crucial. Avoid rushing into trades. Use the breakout-retest model for safer entries.
📌 Opening Scenario 3: GAP-DOWN Opening (100+ Points)
🔻 Expected Open Zone: 23,050 – 22,950
👉 If Nifty opens with a significant gap-down: Observe price action near Opening Support Zone: 23,068 – 22,994 .
If bulls defend this zone with strong reversal patterns (hammer, bullish engulfing), it could be a dip-buying opportunity. Below 22,994, next major support lies at 22,882 . Breakdown of this zone could trigger sharp fall. Avoid shorting after a gap-down unless 22,882 breaks convincingly.
🎯 Key Tip: Never knife-catch a falling market. Let the base build before entering reversal trades.
🛡 Risk Management Tips for Options Traders 🧠 Use defined risk trades: Prefer vertical spreads (bull call/bear put) instead of naked options. Avoid buying OTM options post 11:00 AM unless momentum is strong. Always risk less than 2% of your capital per trade. Trail your stop loss once the trade moves in favor to protect capital. Don't overtrade – quality setups > quantity.
✅ Summary & Conclusion:
📍 Nifty is trading near crucial resistance levels.
📍 23,345 remains the make-or-break zone for bulls.
📍 Support zones: 23,068 → 22,994 → 22,882
📍 React to price action at key zones rather than predicting it.
📍 Let the first 15–30 minutes settle before jumping into trades for optimal RR setups.
⚠️ Disclaimer:
I am not a SEBI-registered analyst . This trading plan is shared for educational purposes only. Please consult your financial advisor before taking any trades based on this plan. Risk wisely and trade with discipline. 🙏

NIFTY : Intraday Trading Levels and Plan for 20-Mar-2025📅 NIFTY TRADING PLAN – 20-Mar-2025
🕒 Timeframe: 15 Min | 📌 Reference Close: 22,911.80
📏 Gap Opening Threshold: 100+ points
📈 1. GAP-UP Opening Scenario (Opening Above 23,010)
If NIFTY opens 100+ points higher — around or above 23,010 — it enters the Profit Booking Zone: 22,995 – 23,067 .
✅ Action Plan:
- If Nifty opens in the 22,995–23,067 zone, avoid aggressive long trades at open. This zone has historically triggered selling pressure.
- Observe the behavior near 23,067 . If candles start rejecting higher prices or form reversal patterns (e.g., bearish engulfing), plan short trades with SL just above 23,067 .
- If Nifty crosses 23,067 with momentum and volume, upside extension is possible toward 23,185 — the Last Intraday Resistance .
- Avoid shorting blindly above 23,067 . Let price consolidate or form lower highs before initiating any counter-trend short.
📌 Educational Note: Profit booking zones often create whipsaws. Let the market decide the intent before jumping in.
🚫 Don't chase gaps — instead, wait for re-entry opportunities once price confirms direction.
📊 2. FLAT Opening Scenario (Between 22,850 – 22,950)
If NIFTY opens within a tight 40–50 point range around its closing level (±50 points), it's considered a flat opening.
✅ Action Plan:
- Allow the market to settle for the first 15–30 minutes . Avoid early entries.
- If Nifty sustains above 22,995 , we may see a quick move toward 23,067 . One can consider intraday longs above 22,995 with a stop loss near 22,950 .
- If price faces rejection at 22,995 and drops below 22,912–22,880 (previous close zone), short opportunities may arise toward 22,800 (Opening Support) .
- Keep an eye on 22,800 as it is a key intraday support. Breakdown below it can lead to a deeper fall toward 22,728 and 22,632 .
📌 Educational Note: Flat openings often provide the best setups if you let price action settle. Stay nimble and neutral till breakout/breakdown confirms.
📉 3. GAP-DOWN Opening Scenario (Opening Below 22,812)
If NIFTY opens with a gap-down of 100+ points (around or below 22,812 ) — look for action near support zones like 22,800, 22,728, and 22,632 .
✅ Action Plan:
- If Nifty opens near 22,800 and holds, wait for a reversal pattern. Intraday long trades are possible toward 22,912+ .
- A clean breakdown below 22,728 (Last Intraday Support) may trigger a slide toward 22,632 (Buyer’s Support) .
- Avoid catching falling knives. Only buy near 22,632 if there’s clear bullish reversal with volume confirmation.
- If price opens below 22,728 and tries to retest and fails to reclaim that level, short trades can be considered with a stop above 22,728 .
📌 Educational Note: Big gap-downs often attract panic exits in the first 15 mins. Wait for a base to form before looking for reversal trades.
🧠 OPTIONS TRADING – RISK MANAGEMENT TIPS
💼 Use defined stop losses based on 15-min or 30-min candle close. Avoid emotional exits.
⚖️ Avoid buying deep OTM options during rangebound conditions — prefer ATM or ITM for better delta control.
🛡️ Use hedged strategies like bull call spreads or bear put spreads during high IV scenarios.
📉 On breakdown or breakout days, trade with the trend using limited-risk directional strategies.
💰 Never risk more than 1.5–2% of capital per trade — capital preservation is key for consistency.
📌 SUMMARY & CONCLUSION:
Gap-Up above 22,995: Profit booking zone. Wait for reversal signs or breakout to 23,185.
Flat Opening: Best setups possible — breakout above 22,995 or breakdown below 22,880.
Gap-Down below 22,812: Watch 22,800–22,632 support zones for potential reversal or breakdown.
🎯 Let price lead the way — react, don’t predict. Enter only on confirmation. Stay disciplined and respect the market structure.
📢 Disclaimer: I am not a SEBI-registered analyst . This trading plan is purely for educational purposes. Please consult with your financial advisor before taking any position.

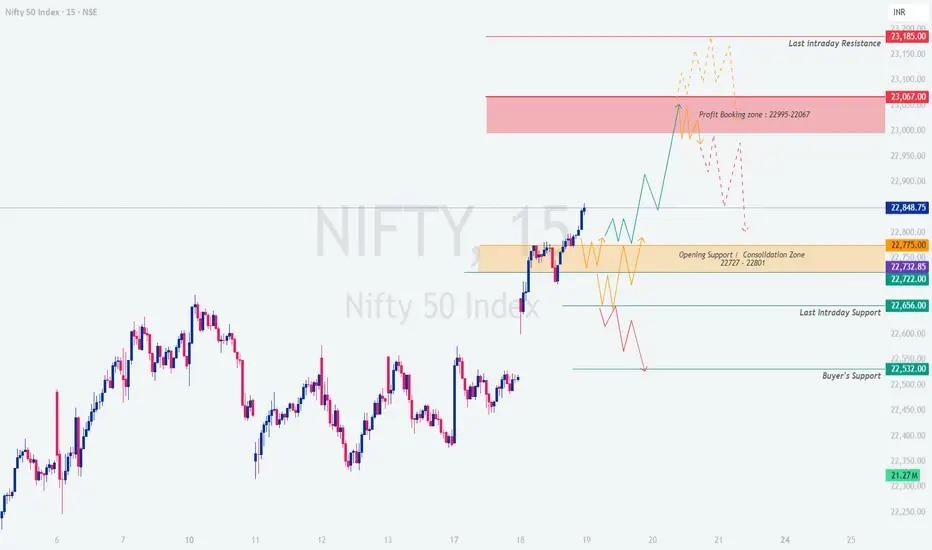
NIFTY : Intraday Trading Levels and Plan for 19-March-2025🔥 NIFTY – Intraday Trading Plan for 19-Mar-2025
Current Market Price (CMP): 22,848.75
Chart Time Frame: 15-min
📘 Opening Scenario 1: GAP-UP Opening (100+ points)
If NIFTY opens with a strong gap-up above 22,950, it would directly open into the Profit Booking Zone: 22,995 – 23,067 .
Avoid aggressive long entries near the opening if prices directly hit the profit booking zone, as early buying could trap latecomers. Wait and observe price action in the 22,995 – 23,067 range. If the index forms bullish consolidation with strength, breakout above 23,067 can push it towards the final resistance at 23,185. If rejection occurs near this zone, look for reversal signals like a 15-min bearish candle with follow-up selling to consider short scalps targeting back to 22,850 – 22,775.
🧠 Tip: Avoid call option entries if IVs are inflated and premiums are already factored in after a big gap-up. Time decay can eat your premiums fast.
📗 Opening Scenario 2: FLAT Opening (within 50-80 pts)
In case of a flat or minor gap opening near 22,800 – 22,850, the price will open just above the key consolidation zone: 22,727 – 22,801 .
Look for first 15-30 minutes consolidation. If NIFTY sustains above 22,801, fresh buying can push it to test 22,995. A failure to sustain above 22,801 and breakdown below 22,775 will drag prices back into the range. The downside targets then would be 22,656 and 22,532. No trade zone for flat opening: avoid trades inside 22,727 – 22,775, unless a directional breakout occurs.
🧠 Tip: For flat openings, best setups come after the first 15-30 minutes. Let the market decide the direction first—then align your trade.
📙 Opening Scenario 3: GAP-DOWN Opening (100+ points)
A gap-down below 22,700 will place the index back into or below the consolidation zone. Major supports are at 22,656**, 22,532, and Buyers’ Support: 22,270 – 22,320.
Aggressive buying should be avoided unless NIFTY shows strong reversal signals from support zones like 22,532 or 22,270. If prices bounce from the Buyers’ Support Zone, a quick upside retracement towards 22,656 or even 22,727 is possible. However, if NIFTY breaks below 22,270, it could enter a deeper correction territory—so keep strict stop losses.
🧠 Tip: When buying the dip in a gap-down scenario, use options spreads (e.g., bull call spreads) to reduce premium decay risk while maintaining upside exposure.
💡 Risk Management Tips for Options Traders:
✅ Use defined-risk strategies like spreads (Bull Call / Bear Put)
✅ Avoid chasing momentum in the first 15 minutes of market opening
✅ Stick to 1–2 high probability trades per day
✅ Always place stop loss based on structure or candle close
✅ Never average into losing options trades—respect time decay
✅ Focus on ATM or slightly OTM contracts with 1–2 day expiry for best gamma moves
📊 Summary & Conclusion:
Key Zones to Watch:
🔸 Resistance Zone: 22,995 – 23,067
🔸 Support Zone: 22,656 – 22,532
🔸 Buyers’ Zone: 22,270 – 22,320
🔸 No Trade Zone: 22,727 – 22,775
Be reactive, not predictive. Let price action guide your trades based on these levels. Respect volatility and avoid emotional trades.
⚠️ Disclaimer: I am not a SEBI registered analyst. The above levels and insights are for educational purposes only. Please consult your financial advisor before taking any positions. Trade responsibly! 💼📉
NIFTY : Intraday Trading Levels and Plan for 18-Mar-2025📅 NIFTY INTRADAY TRADING PLAN – 18th March 2025 (Tuesday)
🕒 Timeframe: 15 Min | 📍Reference Closing: 22,515
📉 CHART STRUCTURE EXPLAINED:
Nifty closed near the middle of the Opening Resistance / Support Zone (22,508–22,547). There are clearly defined areas of support and resistance on both sides that help frame our intraday plan. Price action around these zones will provide direction for high-probability trades.
🟩 GAP-UP OPENING (100+ points): Above 22,617
If Nifty opens above the Last Intraday Resistance (22,617), it enters a potential breakout zone.
Avoid entering trades immediately after a GAP-UP above 22,617. Let the index retest this level for confirmation. If the price sustains above 22,617 for 15 minutes with higher volume, expect a continuation rally towards the Profit Booking Zone (22,727–22,801). Wait for a dip near 22,617 or even the upper band of 22,547. If the retest holds, go long with SL below 22,547. Profit booking is advised near 22,727–22,801 as this zone is likely to attract selling. Avoid fresh longs near 22,800 unless there’s a consolidation breakout.
🧠 Educational Note: Chasing GAP-UPs leads to poor entries. The best trades happen when price retests a broken resistance and confirms support.
🟨 FLAT OPENING (Within 22,508–22,547 Zone)
This is the Opening Resistance / Support Zone — a tricky area that demands patience.
Avoid trading in the first 15–30 minutes if price opens inside the 22,508–22,547 zone. It’s a chop zone, prone to false breakouts. A breakout above 22,547 with volume gives a long opportunity towards 22,617, and eventually 22,727. A breakdown below 22,508 brings the price into the Opening Support Zone (22,403–22,420). Watch for reversal signs here for possible bounce trades. Only consider directional trades once Nifty decisively exits this range.
🧠 Tip: In tight ranges, option premiums decay faster. Avoid entering trades without confirmation.
🟥 GAP-DOWN OPENING (100+ points): Below 22,403
If Nifty opens below the Opening Support Zone, volatility increases and levels become more critical.
Support is visible at the Buyers' Zone (22,210–22,247). If the index opens around this zone, wait for a reversal pattern like bullish engulfing or double bottom on 15-min chart. If 22,210 holds with a strong bounce, a long can be initiated targeting 22,403–22,508 with SL below 22,210. However, if 22,210 breaks with conviction, bears may drag the index to 21,950–22,000 levels. Avoid shorts immediately at open—wait for either breakdown retest or confirmation below 22,210.
🧠 Insight: Panic gap-downs often trigger short-covering rallies. Watch how price behaves in the first hour.
📘 RISK MANAGEMENT TIPS FOR OPTION TRADERS:
🛡️ Risk management is your ultimate edge in the market. Follow these key principles:
Never trade options without a stop loss. Monitor levels, not just premium prices. Avoid selling far OTM options when market structure is trending. It’s a trap during sharp moves. If market is inside range, go with spreads instead of naked options to reduce Theta burn. Size your positions wisely—don’t risk more than 1–2% of total capital on a single trade. Always book partial profits at target zones and trail the rest with a stop.
🧠 Options are like ice—they melt fast in choppy markets. Patience and timing are key!
📌 SUMMARY & CONCLUSION:
✅ Resistance Levels: 22,617 / 22,727 / 22,801
✅ Support Levels: 22,403 / 22,210
✅ Critical Zones:
⚠️ 22,508–22,547 (Opening Decision Zone)
✅ 22,403–22,420 (Support)
🛑 22,727–22,801 (Profit Booking Zone)
👉 Wait for confirmation before entering. Let market structure guide your direction, not emotions.
❗ Disclaimer: I am not a SEBI registered analyst. This plan is shared purely for educational purposes. Please consult with your financial advisor before making any trading decisions.

NIFTY : Intraday Trading levels and Plan for 17-Mar-2025📊 NIFTY Trading Plan – 17-Mar-2025
Nifty is currently hovering near the Opening Support Zone: 22,351 – 22,378, with a key resistance at 22,442 and profit booking zone near 22,617. Depending on how the market opens, we will plan our trades accordingly.
💡 Let’s analyze different scenarios:
🔥 Scenario 1: Gap-Up Opening (100+ Points)
If Nifty opens above 22,442, the index will test the last intraday resistance at 22,551. A decisive breakout above 22,617 may trigger strong bullish momentum.
✅ Plan of Action:
If Nifty sustains above 22,551, look for bullish price action and enter longs with targets of 22,617 and 22,680+.
If a sharp rejection occurs near 22,617, consider booking partial profits and trail SL.
Avoid chasing longs if Nifty starts showing weakness near resistance. Wait for a pullback.
📌 Key Levels to Watch: 22,442 (Support) | 22,551 (Breakout Zone) | 22,617+ (Profit Booking Zone).
📢 Tip: In case of a fake breakout above 22,617, selling pressure may drag Nifty back to 22,442. Watch for reversal patterns before taking aggressive trades.
📉 Scenario 2: Flat Opening (Within 50 Points)
If Nifty opens near 22,383 – 22,434, we will monitor price action near the Opening Support/Resistance Zone. The first 30 minutes will be crucial for direction confirmation.
✅ Plan of Action:
If Nifty bounces from 22,351 – 22,378, look for long opportunities targeting 22,442 and 22,551.
If Nifty struggles to hold 22,442, expect sideways action. Trade only near major levels.
A breakdown below 22,351 will indicate weakness, leading to a test of 22,296 and 22,208.
📌 Key Levels to Watch: 22,351 – 22,378 (Support Zone) | 22,442 (Resistance) | 22,551 (Breakout Confirmation).
📢 Tip: Use a wait-and-watch approach in the first 30 minutes. Let the market establish direction before making big trades.
🛑 Scenario 3: Gap-Down Opening (100+ Points)
A gap-down below 22,351 could push Nifty towards the last intraday support of 22,296. If the selling extends, watch the golden retracement zone at 22,114, which is a high-probability demand zone.
✅ Plan of Action:
If Nifty stabilizes at 22,296, expect a recovery towards 22,351 – 22,378. Scalping opportunities exist.
If selling pressure continues below 22,296, expect a further slide to 22,114, which will be a must-watch area for buyers.
Only consider fresh longs at 22,114 if strong reversal signs appear. Else, avoid catching falling knives.
📌 Key Levels to Watch: 22,296 (Support) | 22,208 (Breakdown Confirmation) | 22,114 (Golden Buy Zone).
📢 Tip: Avoid aggressive longs in a gap-down scenario unless a clear reversal is seen at major supports. Watch for confirmation before entering any trade.
⚡ Risk Management Tips for Options Traders
🔹 Premium Decay Alert: If Nifty consolidates, avoid buying OTM options. Time decay will erode premiums.
🔹 Hedge Positions: If selling options, hedge using spreads to reduce risk.
🔹 Exit at SL: Do not hold options hoping for reversals. Stick to the predefined SL.
🔹 Avoid Trading the First 5-Minutes: Market volatility is high; let a pattern form.
🔹 Size Appropriately: If uncertain, reduce lot size and wait for confirmation.
📌 Summary & Conclusion
✅ If Nifty Opens Gap-Up: Watch for 22,551 – 22,617 resistance zones. A breakout can trigger further upside.
✅ If Nifty Opens Flat: First 30 minutes are crucial. Support at 22,351 – 22,378 should hold for longs.
✅ If Nifty Opens Gap-Down: Watch 22,296 for a reaction. If broken, 22,114 is a key buy zone.
📢 Final Note: The best trades come when price action confirms levels. Avoid emotional trading and respect stop losses.
📜 Disclaimer
I am not a SEBI-registered analyst . All views are for educational purposes only. Traders should conduct their own analysis or consult a financial advisor before making any investment decisions.

NIFTY : Intraday Trading levels and Plan for 13-Mar-2025📘 NIFTY Trading Plan for 13-Mar-2025
Chart Reference: Nifty is currently trading near 22,468, with price showing rejection from near-term resistance. Multiple levels such as 22,435, 22,496, and 22,600 are key zones to watch.
Let’s break down the trading approach into opening scenarios 👇
✅ 1. GAP-UP OPENING (100+ points above previous close)
If NIFTY opens near or above the Opening Resistance Zone – 22,600 to 22,626 :
📍 This zone has acted as a supply area earlier, and a gap-up into this area could trap late buyers if not sustained.
🟧 Scenario 1 – Rejection at Resistance:
🔻 If NIFTY opens within this resistance zone and shows early weakness (such as a bearish engulfing, evening star, or rejection wick), short trades can be considered.
🎯 Targets:
➤ 22,496 (Initial Support)
➤ 22,435 (Next Support)
🟩 Scenario 2 – Breakout Above 22,626:
✅ A strong 15-min bullish candle above 22,626 with volume confirmation can trigger a long entry.
🎯 Targets:
➤ 22,680
➤ 22,800 (Last Intraday Resistance)
🧠 Tip: In gap-up opens, avoid immediate entries. Wait 15–30 mins for the market to establish direction. If upside sustains with strength, trail using VWAP or 5-min EMA.
⚖️ 2. FLAT OPENING (within ±100 points)
If NIFTY opens between 22,435 – 22,496:
This region is the Opening Support/Resistance Zone , meaning both bulls and bears will be active here. The key is to observe who dominates.
🟩 Long Setup:
If NIFTY holds above 22,496 and gives a breakout above 22,600, it will confirm bullish strength.
🎯 Upside Targets:
➤ 22,680
➤ 22,800
🟥 Short Setup:
If price fails to hold above 22,435 and breaks below it with momentum:
🎯 Downside Targets:
➤ 22,319 (Opening Support)
➤ 22,208 (Last Intraday Support)
🧠 Tip: Use option strategies like straddles or strangles near this flat zone if expecting a breakout or expansion in volatility. Avoid naked directional trades unless there is strong confirmation.
🔻 3. GAP-DOWN OPENING (100+ points below previous close)
If NIFTY opens near or below 22,319 (Opening Support):
📍 The area between 22,319 – 22,208 is critical for support. Watch closely for price action.
🟩 Reversal Setup:
If NIFTY opens near 22,208–22,319 and holds this support with signs of strength (bullish pin bar, morning star, or strong bullish volume), a reversal trade can be taken.
🎯 Targets:
➤ 22,435
➤ 22,496
🟥 Breakdown Setup:
If support at 22,208 breaks with a large red candle and follow-through, short trades can be initiated.
🎯 Targets:
➤ 22,140–22,100 Zone (Intraday Expansion Move)
🧠 Tip: Gap-downs can lead to high implied volatility. Be cautious of IV crush if reversal happens. Consider bear put spreads to manage premium risk.
💡 Risk Management Tips for Options Traders
Avoid buying deep OTM options post 12 PM unless there is strong trend confirmation. Always trade with a defined stop-loss. Use 15-min closing basis for better validation. Consider spreads (bull call, bear put) to reduce the impact of theta decay. On volatile days, reduce position size and hedge your trades. Don’t trade immediately after a gap — let the first 15–30 mins settle to avoid traps.
📌 Summary & Conclusion
✅ Key Resistance Zones:
➤ 22,600–22,626 (Opening Resistance)
➤ 22,800 (Last Intraday Resistance)
✅ Key Support Zones:
➤ 22,435 (Pivot Zone)
➤ 22,319 (Opening Support)
➤ 22,208 (Last Support Zone)
🎯 Let price action guide your trade around these key levels. Remember — reacting to the market is better than predicting it.
⚠️ Disclaimer
I am not a SEBI registered analyst. This trading plan is shared purely for educational purposes. Please do your own research or consult your financial advisor before making any investment or trading decisions.

NIFTY : Intraday Trading levels and Plan for 11-Mar-2025📅 NIFTY TRADING PLAN – 11-Mar-2025
🕘 Time Frame: 15-Min | 📍 Strategy: Market Structure + Zones of Interest
📉 Previous Close: 22,441.10
📌 Consider 100+ points for Gap-Up / Gap-Down thresholds
🔼 1. GAP-UP OPENING (Above 22,541+)
A gap-up opening above 22,541 would place Nifty around or above the Opening Resistance zone. In such cases, the market may attempt to challenge the Last Intraday Resistance at 22,623, and possibly even push into the Major Resistance Zone between 22,706–22,744.
🧠 Plan of Action:
Wait for the price to show reaction around 22,623. If it struggles to sustain above this level and forms a bearish 15-min candle, it's a good risk-reward shorting opportunity.
Targets on the downside could be 22,512, and if weakness persists, then a slide toward 22,441 is possible.
Only if price breaks and holds above 22,744 (hourly candle close), consider going long for a possible extension toward 22,800+.
🔍 Caution: A gap-up directly into resistance zone can cause profit booking and volatility. Don’t chase a runaway rally unless momentum with volume confirms breakout.
🎯 Short Zone: 22,620–22,740 (Rejection candles preferred)
📈 Breakout Long above: 22,744 (With hourly close + volume)
➖ 2. FLAT OPENING (±100 points near 22,441)
A flat open near the previous close of 22,441 keeps Nifty inside a decision zone. It sits between the Opening Resistance (22,512) and the Consolidation Zone (22,321–22,410). This is where early traps often occur.
🧠 Plan of Action:
Let the first 15–30 mins settle. If Nifty bounces from 22,321–22,350, it can be considered a buy with tight SL below 22,321, targeting 22,512–22,623.
On the flip side, if price fails to hold 22,321, wait for a clean breakdown with volume — in that case, shorting opportunities open up toward 22,115.
Avoid overtrading in the consolidation zone — wait for structure to develop clearly.
🟧 Key Zone to Watch: 22,321–22,410 — Acts as possible trap zone with choppy moves.
🎯 Buy on Bounce: 22,321–22,350 (Confirmation needed)
📉 Short below: 22,321 (Strong candle + volume)
🔽 3. GAP-DOWN OPENING (Below 22,341)
If Nifty opens below 22,341, it may test or even open inside the Support Zone / Must Try Area for Buyers around 22,115 — which coincides with a key Golden Retracement and past support area.
🧠 Plan of Action:
If Nifty opens near 22,150–22,120, watch for reversal candles like bullish engulfing, morning star, or hammer patterns. If formed, it’s a good risk-reward zone to go long with SL below 22,100.
If price breaks and sustains below 22,100, avoid longs and prepare for further downside toward 21,950–21,880 in upcoming sessions.
Never jump into longs blindly on gap-downs — price action is king.
🟢 Buy Zone on Reversal: 22,150–22,115
🟥 Breakdown Trigger: Below 22,100 (Hourly candle close)
💡 Risk Management Tips for Options Traders:
🕒 Wait for the first 15–30 minutes to pass — let the market reveal its intent. 📉 Use spreads (Bull Call or Bear Put) when trading near volatile zones like resistances or supports. 🛑 Always set a Stop Loss — either on premium value or index level (preferably both). 🧠 Avoid emotional trading — don’t average into losing positions. 💼 Trade position size wisely — don't go all-in on a single idea. 🧾 Keep a trading journal to improve your strategy over time.
📌 Summary & Conclusion:
🔺 Gap-Up = Watch for weakness near 22,623–22,744 — possible reversal or breakout
🔘 Flat = High chance of whipsaws — trade only after clear setup forms near 22,321 or 22,512
🔻 Gap-Down = Support test likely at 22,115 — potential reversal or breakdown
⚠️ Always respect the market structure and trade with discipline. Avoid predicting — react to what the market shows.
📢 Disclaimer: I am not a SEBI-registered analyst. This analysis is shared for educational purposes only. Please do your own research or consult a financial advisor before making any trading decisions.

NIFTY : Intraday Trading levels and Plan for 10-Mar-2025 NIFTY Closed at: 22,552
Tomorrow's session will be crucial as NIFTY is near key resistance & support zones. We will analyze all three possible opening scenarios and provide actionable trade setups.
📍 Scenario 1: Gap-Up Opening (🔼 +100 points or more)
If NIFTY opens above 22,690, it will start near the Opening Resistance Zone (22,635 - 22,690). A strong bullish momentum can push prices higher, but traders should be cautious of potential rejection.
📌 Plan of Action:
If NIFTY sustains above 22,690 for at least 15 minutes, expect a rally towards 22,819 (Last Intraday Resistance). 📈
If price faces rejection at 22,690, wait for a pullback to 22,635. If it holds as support, consider a long position.
If NIFTY falls below 22,635, it could test 22,545. A break below this level may weaken bullish sentiment.
📢 Trading Tip: In a gap-up scenario, avoid aggressive long positions at opening. Wait for price confirmation to avoid FOMO.
📍 Scenario 2: Flat Opening (±50 points around 22,536)
A flat opening indicates an indecisive market, and price action around the Opening Support Zone (22,500 - 22,476) will be crucial for the next move.
📌 Plan of Action:
If NIFTY holds above 22,536 and breaks 22,545, expect bullish momentum towards 22,635, followed by 22,690.
If NIFTY fails to hold 22,500, expect a slide towards 22,476. If this level is broken, expect further downside towards 22,378. 🔻
For long trades, wait for price to reclaim 22,545 after testing support zones.
📢 Trading Tip: Avoid trading in the first 15-30 minutes. Let the market establish a trend before taking positions.
📍 Scenario 3: Gap-Down Opening (🔽 -100 points or more)
If NIFTY opens below 22,476, sentiment may turn bearish, especially if it sustains below this level.
📌 Plan of Action:
If NIFTY opens near 22,378, watch for price action—a strong bounce can lead to a recovery towards 22,476 - 22,500.
If 22,378 breaks, expect further weakness towards 22,299, which is the last major intraday support.
Any recovery will need to cross 22,500 for a trend reversal. Until then, bearish pressure will dominate.
📢 Trading Tip: In a gap-down scenario, avoid catching falling knives. Let support levels hold before attempting a buy.
🎯 Risk Management Tips for Options Traders
✅ Use Stop Loss: Always exit a trade if your stop loss is hit. Holding onto losing trades can wipe out profits.
✅ Avoid Trading Big Lot Sizes in uncertain conditions—start small & scale up when trends confirm.
✅ Time Decay Awareness: If buying options, avoid holding near expiry unless confident about a strong move.
✅ Hedge Positions: Consider using hedged strategies like Spreads to reduce risk.
📌 Summary & Conclusion
🔹 Above 22,690 → Bullish towards 22,819
🔹 Between 22,500 - 22,690 → Sideways range, wait for confirmation
🔹 Below 22,476 → Bearish towards 22,378 - 22,299
⚡ Patience & Discipline are key to profitable trading. Wait for confirmation before entering trades. 🚀
⚠️ Disclaimer
I am not a SEBI-registered analyst. This trading plan is for educational purposes only. Traders should do their own research or consult a financial advisor before taking any trades.
📢 #Nifty #Nifty50 #StockMarketIndia #OptionsTrading #SwingTrading #TradingView #NSE #IndianStockMarket #PriceAction #StockMarketNews 🚀

NIFTY : Intraday Trading levels and Plan for 07-Mar-2025
📌 Key Levels to Watch:
🔴 Resistance Levels: 22,635 | 22,819
🟢 Support Levels: 22,467-22,496 | 22,378 | 22,258
📝 Market Context:
Nifty has shown strong momentum in recent sessions, currently trading near 22,529. The profit booking zone lies around 22,635, while a breakout above this could lead to 22,819. On the downside, key support exists at 22,467-22,496, and a further breakdown may drag prices toward 22,378-22,258.
📈 Scenario 1: Gap-Up Opening (100+ Points Above 22,630) 🚀
If Nifty opens above 22,630, it enters the profit booking zone, making further upside dependent on momentum. A clean breakout above 22,819 will signal strength.
Buy above 22,635 🔼
🎯 Target: 22,750 – 22,819
🛑 Stop Loss: 22,550
📝 Plan: If Nifty sustains above 22,635, it can attempt 22,819. Wait for a proper 15-minute candle close above 22,635 before entering. Profit booking is advised near resistance levels.
Rejection at 22,635 ❌
🔽 Sell below 22,630
🎯 Target: 22,500 – 22,467
🛑 Stop Loss: 22,680
📝 Plan: If Nifty struggles at 22,635 and reverses, a short trade can be considered toward 22,467. Volume confirmation is necessary before entering shorts.
📉 Scenario 2: Flat Opening (22,450 – 22,550) 📊
A flat opening near 22,450 – 22,550 suggests indecision. The 22,467-22,496 range is a crucial support area.
Buy above 22,550 🔼
🎯 Target: 22,635 – 22,700
🛑 Stop Loss: 22,500
📝 Plan: If Nifty holds above 22,550 and shows strength, an upside move toward 22,635 is likely. Look for bullish price action confirmation before entering.
Sell below 22,467 🔽
🎯 Target: 22,378 – 22,350
🛑 Stop Loss: 22,525
📝 Plan: If Nifty breaks below 22,467 and struggles to reclaim it, selling pressure may drag it toward 22,378. Wait for a sustained breakdown before taking short positions.
📉 Scenario 3: Gap-Down Opening (Below 22,429) ⚠️
A gap-down below 22,429 signals weakness, with support at 22,378 and 22,258.
Buy near 22,258 – 22,300 🟢
🎯 Target: 22,440
🛑 Stop Loss: 22,220
📝 Plan: If Nifty stabilizes at 22,258-22,300, a bounce toward 22,440 is possible. Ideal for risk-managed long trades.
Sell below 22,258 🔽
🎯 Target: 22,150 – 22,100
🛑 Stop Loss: 22,320
📝 Plan: If selling pressure persists below 22,258, a further slide is likely. Avoid panic selling; wait for confirmation.
💡 Risk Management Tips for Options Traders 🎯
✅ Theta Decay Awareness: Avoid buying OTM options late in the day.
✅ Stop-Loss Discipline: Always use SL based on technical structure.
✅ Position Sizing: Risk only 2% of capital per trade.
✅ Avoid Overtrading: Trade only high-probability setups.
📌 Summary & Conclusion 📌
🔹 Bullish above 22,635 for 22,819.
🔹 Bearish below 22,258 for 22,150.
🔹 Flat open needs confirmation for direction.
🔹 Key support: 22,467-22,496 | 22,258.
🔹 Key resistance: 22,635 | 22,819.
📢 Trade with discipline, follow the plan, and manage risk effectively!
⚠️ Disclaimer:
I am not a SEBI-registered analyst. This analysis is for educational purposes only. Do your own research or consult a financial advisor before trading. 📊📉📈

NIFTY : Intraday Trading levels and Plan for 06-Mar-2025Market Context:
Nifty closed at 22,337, with the following key structural levels:
🔴 Profit Booking Zone: 22,635
🟠 No Trade Zone: 22,356 - 22,462
🟢 Opening Support: 22,200 - 22,230
🟩 Last Intraday Support: 22,165 - 22,057
Considering a 100+ point gap opening, let's analyze the possible trading scenarios for the day.
🟢 Scenario 1: Gap-Up Opening (100+ Points Above 22,450)
If Nifty opens above 22,450, it moves into or above the No Trade Zone (22,356 - 22,462).
Sustaining above 22,462 – If the market holds this level with strong momentum, Nifty can rally toward the Profit Booking Zone at 22,635.
Rejection from 22,462 – If price struggles to break above 22,462, it may pull back toward the previous resistance at 22,356, which now acts as support.
If price consolidates inside the No Trade Zone, it signals uncertainty, and traders should wait for a clear direction before taking action.
🔹 Trading Plan:
Go long only if Nifty sustains above 22,462 on an hourly close, targeting 22,635.
Sell below 22,356 if rejection is observed, with a target of 22,289.
Options traders can consider 22,500 CE for long trades and 22,400 PE if rejection occurs.
🟡 Scenario 2: Flat Opening (Within 22,300 - 22,350)
A flat opening near 22,346 places Nifty in a neutral range, requiring confirmation for the next move.
A move above 22,356 will push the index toward the No Trade Zone (22,356 - 22,462). If sustained, a breakout above 22,462 can open room for higher levels.
A drop below 22,300 brings the price closer to the Opening Support Zone (22,200 - 22,230), making this level crucial for short-term buyers.
If price trades between 22,300 - 22,356, wait for a decisive breakout before entering trades.
🔹 Trading Plan:
Avoid taking trades inside the No Trade Zone and wait for a breakout.
Go long above 22,462, targeting 22,635.
Sell below 22,300 for a move toward 22,200, with stop-loss at 22,356.
Options traders can use 22,400 CE for longs and 22,300 PE for shorts.
🔴 Scenario 3: Gap-Down Opening (100+ Points Below 22,200)
A gap-down near 22,200 - 22,057 will bring price into the Opening Support & Last Intraday Support Zones.
Holding 22,200 – If price finds support here, a strong bounce can push Nifty back toward 22,356.
Breaking 22,165 – If selling pressure persists, the next downside target is 22,057, which is the last major support.
If price enters the 22,057 - 22,165 range, this zone could act as a major reversal point based on previous demand zones.
🔹 Trading Plan:
Look for buying opportunities at 22,200 if price shows reversal signals.
If breakdown below 22,165 occurs, wait for confirmation before shorting toward 22,057.
Options traders can use 22,200 PE for breakdown trades and 22,100 CE for bounces.
📊 Risk Management Tips for Options Trading
✅ Use Stop Loss on an Hourly Close Basis – Avoid holding options without confirmation of direction.
✅ Avoid Trading in the No Trade Zone – Let price break out before taking a position.
✅ Monitor India VIX – If volatility is high, premiums may decay faster. Avoid unnecessary trades.
✅ Partial Profit Booking is Key – Secure profits at resistance & support levels instead of waiting for full targets.
✅ Avoid Holding Trades Overnight – Unless there is a strong directional bias, overnight positions carry additional risk.
📌 Summary & Conclusion
Bullish Scenario: Above 22,462, Nifty can rally toward 22,635.
Neutral Zone: If trading between 22,300 - 22,356, wait for confirmation before entering trades.
Bearish Scenario: Below 22,165, weakness can extend toward 22,057, where a bounce is likely.
🔹 Best Risk-Reward Trades:
Buy near 22,200 if support holds.
Sell below 22,165 for a breakdown.
Buy only on a confirmed breakout above 22,462.
⚠️ Disclaimer:
I am not a SEBI-registered analyst. This analysis is for educational purposes only. Please conduct your own research or consult a financial advisor before making any trading decisions.


NIFTY Intraday Trading levels and Plan – 28-Feb-2025
This analysis provides a comprehensive trading plan for the NIFTY 50 index on February 28, 2025, covering all possible opening scenarios. We will evaluate Gap-Up, Flat, and Gap-Down openings (with gaps of 100+ points) and outline clear action points, key levels, and risk management strategies. This plan is designed to help traders navigate the market with precision and discipline. 📈🔍
🔹 Scenario 1: Gap-Up Opening (100+ points)
If NIFTY 50 opens above 22,763 (a gap of 100+ points from the previous close of 22,663), it signals strong bullish momentum. This opening suggests aggressive buying interest, potentially driving prices higher.
If the price sustains above 22,763, it could target the resistance zone of 22,884–22,900. This zone is a profit-booking area where selling pressure may intensify due to historical resistance and recent highs.
If the price faces rejection at 22,884–22,900, a reversal trade could be considered, targeting a pullback to 22,700–22,663 (opening resistance and previous close).
Should the price break above 22,900 with strong momentum (e.g., high volume and bullish candlestick patterns), we might see a rally toward 23,000 or higher.
✅ Trade Plan:
✔️ Buy on a breakout and retest of 22,763 , targeting 22,884–22,900. Use a stop-loss below 22,663 to manage risk.
✔️ Short if the price rejects 22,884–22,900, aiming for 22,700–22,663. Place a stop-loss above 22,900 to limit potential losses.
Explanation: A Gap-Up opening of 100+ points reflects bullish sentiment, but chasing the gap immediately can be risky due to volatility. Waiting for a retest of 22,763 confirms bullish intent, while the resistance at 22,884–22,900 acts as a natural profit-taking zone. A rejection at this level could signal a shorting opportunity if bearish momentum builds.
🔹 Scenario 2: Flat Opening (Near 22,663–22,700)
If NIFTY 50 opens within the range of 22,663–22,700, it suggests a balanced market with no clear directional bias. This zone acts as a critical opening support/resistance area where price action could consolidate or break out.
A breakout above 22,700 could drive prices toward 22,884–22,900, signaling bullish momentum.
A breakdown below 22,663 might lead to selling pressure, targeting 22,510–22,356 (opening support and last intraday support) or even 22,268–22,070 (buyer’s support levels).
✅ Trade Plan:
✔️ Buy above 22,700 , targeting 22,884–22,900. Use a stop-loss below 22,663 to protect against a false breakout.
✔️ Sell below 22,663 , targeting 22,510–22,356 or 22,268–22,070. Set a stop-loss above 22,700 to manage downside risk.
Explanation: A Flat opening often results in consolidation, making it challenging to trade without confirmation. The 22,663–22,700 range is a no-trade zone unless a decisive breakout occurs. Traders should wait for clear price action (e.g., strong candlestick patterns or increased volume) to avoid fake moves and ensure higher probability trades.
🔹 Scenario 3: Gap-Down Opening (100+ points)
If NIFTY 50 opens below 22,563 (a gap of 100+ points from the previous close of 22,663), it signals bearish sentiment and potential weakness in the market.
Immediate support lies at 22,510–22,356 (opening support and last intraday support). If this holds, a pullback toward 22,663–22,700 could occur.
If 22,356 breaks with strong selling pressure, expect further downside toward 22,268–22,070 (buyer’s support for a possible reversal).
✅ Trade Plan:
✔️ Buy near 22,356 , targeting a pullback to 22,663–22,700. Use a stop-loss below 22,268 to limit risk.
✔️ Short below 22,356 , targeting 22,268–22,070. Place a stop-loss above 22,356 to protect against a quick recovery.
Explanation: A Gap-Down opening of 100+ points indicates panic or profit-taking, but prices can rebound if support levels hold. Waiting for confirmation near 22,356 ensures the price isn’t just oversold, while a break below this level confirms bearish momentum for shorting opportunities. The 22,268–22,070 zone offers a potential reversal point if buying interest emerges.
📌 Risk Management Tips for Options Trading 💡
🛑 Always Use a Strict Stop-Loss: Protect your capital by setting stop-loss orders at key support/resistance levels to limit potential losses.
🎯 Take Partial Profits: Lock in gains at intermediate targets (e.g., 22,884 or 22,356) to secure profits while allowing room for further moves.
🕰️ Avoid Overtrading: Stick to the plan and wait for clear price action confirmation—don’t force trades in uncertain conditions.
💰 Use Proper Position Sizing: Risk only a small percentage of your capital (e.g., 1–2%) per trade to ensure longevity in the market.
📌 Summary & Conclusion 🎯
✔️ Bullish Above: 22,700 → Target: 22,884–22,900.
✔️ Bearish Below: 22,663 → Target: 22,510–22,356 or 22,268–22,070.
✔️ No Trade Zone: 22,663–22,700 (Wait for a breakout).
Trade with discipline, follow your plan, and prioritize risk management to navigate the NIFTY 50 market effectively on February 28, 2025. 🚀
⚠️ Disclaimer
I am not a SEBI-registered analyst. This analysis is for educational purposes only. Please consult your financial advisor before making any trading decisions. 📉📈

NIFTY : Intraday Trading Levels and Plan – 27-Feb-2025📌
This analysis provides a comprehensive trading plan for the NIFTY index on February 27, 2025, covering all possible opening scenarios. We will evaluate Gap-Up, Flat, and Gap-Down openings (with gaps of 100+ points) and outline clear action points, key levels, and risk management strategies. This plan is designed to help traders navigate the market with precision and discipline. 📈🔍
🔹 Scenario 1: Gap-Up Opening (100+ points)
If NIFTY opens above 22,784 (a gap of 100+ points from the previous close of 22,684), it signals strong bullish momentum. This opening suggests aggressive buying interest, potentially driving prices higher.
If the price sustains above 22,784, it could target the resistance zone of 22,871–22,987. This zone is a profit-booking area where selling pressure may intensify due to historical resistance and recent highs.
If the price faces rejection at 22,871–22,987, a reversal trade could be considered, targeting a pullback to 22,710–22,684 (opening resistance and previous close).
Should the price break above 22,987 with strong momentum (e.g., high volume and bullish candlestick patterns), we might see a rally toward 23,000 or higher.
✅ Trade Plan:
✔️ Buy on a breakout and retest of 22,784 , targeting 22,871–22,987. Use a stop-loss below 22,684 to manage risk.
✔️ Short if the price rejects 22,871–22,987, aiming for 22,710–22,684. Place a stop-loss above 22,987 to limit potential losses.
Explanation: A Gap-Up opening of 100+ points reflects bullish sentiment, but chasing the gap immediately can be risky due to volatility. Waiting for a retest of 22,784 confirms bullish intent, while the resistance at 22,871–22,987 acts as a natural profit-taking zone. A rejection at this level could signal a shorting opportunity if bearish momentum builds.
🔹 Scenario 2: Flat Opening (Near 22,684–22,710)
If NIFTY opens within the range of 22,684–22,710, it suggests a balanced market with no clear directional bias. This zone acts as a critical opening support/resistance area where price action could consolidate or break out.
A breakout above 22,710 could drive prices toward 22,871–22,987, signaling bullish momentum.
A breakdown below 22,684 might lead to selling pressure, targeting 22,505–22,356 (opening support and last intraday support) or even 22,400 (key support level).
✅ Trade Plan:
✔️ Buy above 22,710 , targeting 22,871–22,987. Use a stop-loss below 22,684 to protect against a false breakout.
✔️ Sell below 22,684 , targeting 22,505–22,356 or 22,400. Set a stop-loss above 22,710 to manage downside risk.
Explanation: A Flat opening often results in consolidation, making it challenging to trade without confirmation. The 22,684–22,710 range is a no-trade zone unless a decisive breakout occurs. Traders should wait for clear price action (e.g., strong candlestick patterns or increased volume) to avoid fake moves and ensure higher probability trades.
🔹 Scenario 3: Gap-Down Opening (100+ points)
If NIFTY opens below 22,584 (a gap of 100+ points from the previous close of 22,684), it signals bearish sentiment and potential weakness in the market.
Immediate support lies at 22,505–22,356 (opening support and last intraday support). If this holds, a pullback toward 22,684–22,710 could occur.
If 22,505 breaks with strong selling pressure, expect further downside toward 22,070 (buyer’s support for a possible reversal).
✅ Trade Plan:
✔️ Buy near 22,505 , targeting a pullback to 22,684–22,710. Use a stop-loss below 22,356 to limit risk.
✔️ Short below 22,505 , targeting 22,070. Place a stop-loss above 22,505 to protect against a quick recovery.
Explanation: A Gap-Down opening of 100+ points indicates panic or profit-taking, but prices can rebound if support levels hold. Waiting for confirmation near 22,505 ensures the price isn’t just oversold, while a break below this level confirms bearish momentum for shorting opportunities. The 22,070 zone offers a potential reversal point if buying interest emerges.
📌 Risk Management Tips for Options Trading 💡
🛑 Always Use a Strict Stop-Loss: Protect your capital by setting stop-loss orders at key support/resistance levels to limit potential losses.
🎯 Take Partial Profits: Lock in gains at intermediate targets (e.g., 22,871 or 22,505) to secure profits while allowing room for further moves.
🕰️ Avoid Overtrading: Stick to the plan and wait for clear price action confirmation—don’t force trades in uncertain conditions.
💰 Use Proper Position Sizing: Risk only a small percentage of your capital (e.g., 1–2%) per trade to ensure longevity in the market.
📌 Summary & Conclusion 🎯
✔️ Bullish Above: 22,710 → Target: 22,871–22,987.
✔️ Bearish Below: 22,684 → Target: 22,505–22,356 or 22,070.
✔️ No Trade Zone: 22,684–22,710 (Wait for a breakout).
Trade with discipline, follow your plan, and prioritize risk management to navigate the NIFTY market effectively on February 27, 2025. 🚀
⚠️ Disclaimer
I am not a SEBI-registered analyst. This analysis is for educational purposes only. Please consult your financial advisor before making any trading decisions. 📉📈
