NIFTY BEARISH BAT (SHORT) !!! SEE WHERE NIFTY IS NOW .... ?
YEAH NIFTY MADE THIS FAR..(GREAT JOB) >>> I ALREADY POSTED A CHART ON THIS AT JUNE 9/2020 >>> SEE MY OLD POST INCASE YOU WANT TO LOL !!!
OK I AM EXPECTING GOOD REVERSAL FROM THE PRZ (PRIZE REVERSAL ZONE ) REDBOX IN THE CHART.... EXPECTING A 1000 POINTS DOWN ( OMG ) !!!
!!! JUST FOR STUDY PURPOSE !!!
Niftylong

NIFTY ANALYSISAS SUGGESTED THE RESISTANCE AND SUPPORT LEVEL IN THE NIFTY CHART, IT BEHAVES EXACTLY THE SAME WAY. MORE DOWNSIDE TO COME. BULLS WILL ONLY ACTIVE ABOVE 11375, TILL ADOPT SELL ON RISE STRATEGY.


R-0086 BUY NIFTY | TARGET: 11,350 | STOP LOSS: 11,100BUY NIFTY | TARGET: 11,350 | STOP LOSS: 11,100
The Nifty index continued to make a higher top and a higher bottom pattern and also achieved our short term target of 11,200. The overall structure is still looking positive as long as it holds its 200-DMA which is placed at 10,865 levels. The momentum indicators and oscillators are very well in the buy mode on the weekly scale which hints that bulls still have the upper hand. The volatility index, IndiaVIX, is hovering near 25 levels which is giving comfort to the bulls. Thus, aggressive traders can initiate a long position with a strict stop loss of 11,100.

NIFTY Futures Forming triple bottom?Bottom of a ranging trend channel. If price breaks above resistance then triple bottom pattern is confirmed and we can see further recovery in the Indian markets,

will upper circuit on NIFTY 50 ?AS WE SAW IN LAST SOME MONTH WHEN LOCKDOWN EXTENSION HAPPEN NIFTY FALL SAME DAY
BUT ASS FAR MY KNOWLEDGE LOCKDOWN WILL NOT CONTINUE AND, OPEN WILL SOME TERM AND CONDITION
SO BE READY TO SAW NEW CHANGES IN MARKET.
THANK YOU FOR YOUR SUPPORT FOR MORE UPDATE FOLLOW AND Like IF you are new to market and wish to learn more you can contact me 7276209528
If you open account from below link you will get my Personalis support for learning and trading.
tinyurl.com

Nifty: This channel will tell you if there is another leg down The channel here contains all the price action that has happened from March Lows. Currently this channel has enough room on the upside to allow for any major rally. If the worst is over than this channel should continue to hold and we will only witness a breakout on the upside eventually.
On the contrary if we see that prices break below the lower trend line it will be first indication that we may be seeing a second leg of the fall we witnessed in march (less likely).

DALMIA BHARAT 75 MIN & 1 D Analysis . After a good upside move of 100 points ( 480-580 ) , Price Started Consolidating At Higher Levels .
Volumes Get Dried Up. Sellers Are Not Showing Much Of A Interest .
We Need To Look For Bullish Volume Candle that can close above 570 .
And Find Opportunities there to go long For A Targets Of 595-610
Closing Below 550 Will Be A Weak Sign . Can Go till 525 .
On The Basis Of Daily Chart .
587 Will Be A Level We Look For to Get Brock With A Good Bullish Volume And Candle .
One Can Start Accumulating For Higher Targets ( Marked On Chart )
Daily Chart Attached Below .
JOIN MY TELEGRAM CHANNEL FOR DISCUSSION .
LINK IN Signature Section .
HAPPY LEARNING .

NIFTY - 10450- 10550 still on the cardsAs long as nifty is holding 10140 -10120 levels , the probability of its moving towards 10450-10550 is still on the cards
hence its buy on dips as long as its holding 10120 on intraday basis and 9940 on weekly basis.

Science Backed by Data[Nifty Series]: Nifty target 10355-8thJunHi Friends,
Let's Learn and Earn. Elliot wave mostly if identified correctly helps in discovering important psychological levels.
Nifty Second waveform is in progress and wave 5 looks to be starting on it. Today's Nifty retracement is beautifully mapped on 15min Chart for your consumption.
Time in Bars - Wave - Coordinates - Actual Length of Wave
wave 0 9843.8
44 wave 1 10156.65 312.85
21 wave 2 9958.35 198.3
39 wave 3 10322 363.65
20 wave 4 10161.85 160.15
? wave 5 10474.7 312.85
Wave 5 target has various ways for calculations. Some of the most popular 5 ways to calculate 5th wave of Elliot Wave are used in below table for your reference.
Wave 5 Targets
61.8% of wave1-3 --10264.0
61.8% of wave1 --10355.2 (Golden ratio) We are picking this as Target.
161.8% of wave 4 --10421.0
Equal to Wave 1 --10474.7
123.6% of wave 1 --10548.5
Calculated Time for reaching target is 10:45 AM for 10June20
Now time for some Learning . 3 Most Important rules of Elliot wave are
• Wave 2 can’t retrace more than the beginning of wave 1
• Wave 3 can not be the shortest wave of the three impulse waves, namely wave 1, 3, and 5
• Wave 4 does not overlap with the price territory of wave 1 (Mostly overlooked).
Even if one of the above rule is invalidated, you should not assume wave's to be correct.
Let me know with a like if you enjoyed reading the Analysis. This will encourage me to work harder for you.

ridethepig | The Revolutionary IdeasA good time to update the chart in Indian Equities (NIFTY) for those following the EM story...
If you take a closer look at the below diagram " Top is in for the year.. " you will see that it is above all directed against an arithmetic conception of the 5 wave sequence from the cycle lows.
What is crucial is simply the greater or lesser degree of mobility which the Indian currency has possessed from both the monetary and fiscal side; if intervention occurs from the CB it is going to mark the end of the weakness for India, and unlock a new chapter for the next generation! What it boils down to is always the "intrinsic value" of the local economy (deriving from the global skeleton present) which is a cumulative count of productivity, confidence and similar matters of form.
There is a strategy which every hypermodern investor should take note of. I mean the continuity of the advance from 8542 support. Once the support began holding, then and only then may we consider the mass as more attractive because only then have the elements been mobilised. The previous swing did not fail to excite lively interest, since the previous update the INR weakness is now starting to show signs of exhaustion and should be treated with extreme caution.
In spite of fine play, the INR is protected at the highs and is giving Shaktikanta Das a free hand to play monetary policy on the retrace. How can India mess this up? ... An elegant breakup in Indian Equities over the coming years does not seem too fancy!
As usual thanks for keeping your support coming with likes, comments, charts, questions and etc!

Nifty Possible short term up trend before fallNSE:NIFTY - wave C in Nifty can continue till 11000 levels.
Possible short term up trend before trend reverses.

Method to Madness of the fallTrend-lines help identify and decipher the haphazard movements and help us anticipate the possible moves we can see for nifty in the next coming days.
There is a probability of Nifty making highs upto 9500 levels in the immediate future. Breakout from the trend lines if any to sustain should be supported by the volume.
Long term outlook is bearish, but the descent will be painstakingly gradual and grinding. Bottom is not expected to be created in coming weeks but probably in next 6-8 months. Hence all swing positions to be exited once nifty nears the upper trend line.

NIFTY 9400 TGT tomorrow 23rd APR by 15:15 ISTTomorrow expiry will be very energetic, as NIFTY is on it's way to 9425.
Let's see the 5th WAVE forming!
Do like, Comment and share :)

Nifty Intraday Trade setup for 22 April 2020Good Morning everyone,
Yesterday We has seen a major dump in Nifty Index. Total correction is 280 points in Intraday. Sentiment is negative as per we yesterday Negative but as I always said that everyday is different then others in Intraday so do not come on next day on previous day sentiment...
Key Factor
============
SGX is almost 71 Points down atm.
Dow close lower then 631 points from previous day .
Let's see how our market will be react today on the above Scenario
Nifty Key Resistance is 9150 and support is on 8700.
Trade setup
=================
A -Buy Level
Build a long position if price sustain above 9050
B- Sell Level
==============
Sell if price break 8800 Level
Note : Wait for first 30 minute to get the Index settle. These Levels are based on previous data and can destroy on Huge Gap up or gap down so wait first 30 minute and observe the Index move. Will update More in live market...
Good Luck and Happy trading

NIFTY 50 INDEX (NIFTY) MonthlyDates in the future with the greatest probability for a price high or price low.
The Djinn Predictive Indicators are simple mathematical equations. Once an equation is given to Siri the algorithm provides the future price swing date. Djinn Indicators work on all charts, for any asset category and in all time frames. Occasionally a Djinn Predictive Indicator will miss its prediction date by one candlestick. If multiple Djinn prediction dates are missed and are plowed through by same color Henikin Ashi candles the asset is being "reset". The "reset" is complete when Henikin Ashi candles are back in sync with Djinn price high or low prediction dates.
One way the Djinn Indicator is used to enter and exit trades:
For best results trade in the direction of the trend.
The Linear Regression channel is used to determine trend direction. The Linear Regression is set at 2 -2 30.
When a green Henikin Ashi candle intersects with the linear regression upper deviation line (green line) and both indicators intersect with a Djinn prediction date a sell is triggered.
When a red Henikin Ashi candle intersects with the linear regression lower deviation line (red line) and both indicators intersect with a Djinn prediction date a buy is triggered.
This trading strategy works on daily, weekly and Monthly Djinn Predictive charts.
This is not trading advice. Trade at your own risk.

Nifty Intraday Trade setup for 08 April 2020Hello all ,
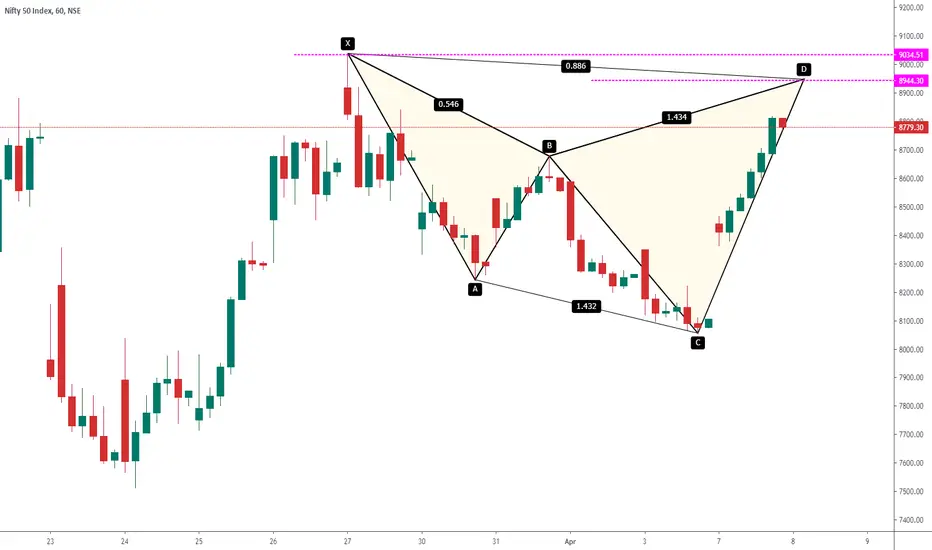
We had seen an awesome move yesterday in upside. SGX Nifty is Open in negative today but it does not mean that Index momentum will be change. There is still room in upside as per our harmonic prz . Level is 8944-9034 so Nifty should be touch this level before to give a reversal .
Today Trade Setup
==================
Buy if yesterday high break. Price is 8825 In case market open Gap down and test 8690-8700 Then buy from bottom.
#Nifty #Intraday setup for 01 April 2020Hello all ,
Nifty has more clear view then bank nifty Index. Buy above 8700 abd book the profit before 8850 . Sell if 8300 Break in Intraday.

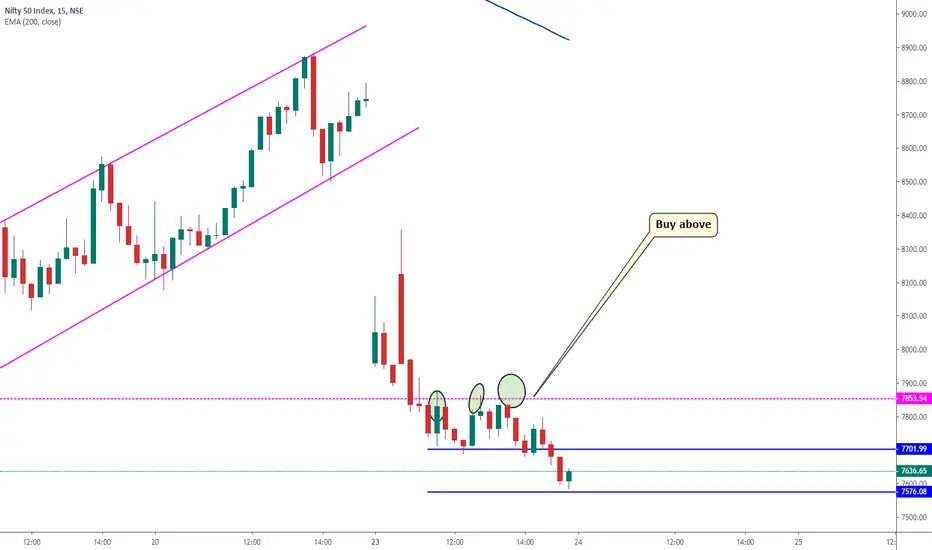
Nifty Intraday Trade setup for 24th March 2020Hello all ,
Sgx nifty is trading more then 300 point in the morning,so there is lot of chances to see a gap opening today. so what is our trade setup in Intraday. Price has rejected 7853 levels multiple time in last 2 trading sessions and failed to sustain above . We will go for a buy above 7870. In case price failed to sustain above then our short Position can build on 7700 .
Bullish on SPX and NiftyAs per the previous update, like Nifty, SPX just completed it's 38.3% retracement and both the indices can move up in sync for a B wave or for an impulse up (if the fall is over).


Nifty Mid Term Idea for March MonthHello Everyone,
First happy Holi to all of you... We had seen a massive blood bath from couple of weeks and main question is when it will gonna to stop and where is the bottom of index, Well Index is currently trading on 10450 . Remember this is the weekly support and the harmonic prz area but Trend is always been strong then any support and any from the any pattern . Trend is not gonna to reverse until we did not seen a consolidation phase. Keep an eye on 10k level if its break then we will see 9400 . next couple of weeks is so Important to watch . Investors and swing traders keep patience you guys will get a great opportunity in buy side but let the sustain index at first .
Regards
Virendra

NIFTY LONGNIFTY has hit a trend line and strong level of support and Stochastic is underbought
Is is supposed to shoot up tomorrow.
I;m bullish on NIFTY as of now
