FINPIPE long for swing tradeThis chart for swing position if chart time frame daily then period 01 to 03 month. or 1H to 4H then 01 to 10 days .
All instructions are given upper on chart . as a all level order, entry, exit.
Its not a call tips advisory only for education purpose. Your position your self care.
Niftylong

Detailed Weekly Analysis for Nifty.
This is the Monthly chart to understand the biggest picture for Swing positions.
This is a Potential Weekly Demand which has the power to turn around the game in the buyers side. Now in order to reach this Demand Price needs to reach some Supply and then retrace down into this Weekly Demand.
Further down in Daily chart we see there is a "Violated Daily Demand", this clearly indicates Sellers have just become more powerful and we also have a Fresh Daily Supply which is a Source Supply for a Downtrend till the Weekly Demand shown in the 1st figure.
This is the Demand Supply Equilibrium Curve from potential Daily Supply to Potential Weekly Demand, wait for the Price to reach the Daily Supply and further the Curve tells us where the Price is on the curve and accordingly decide the Trade.

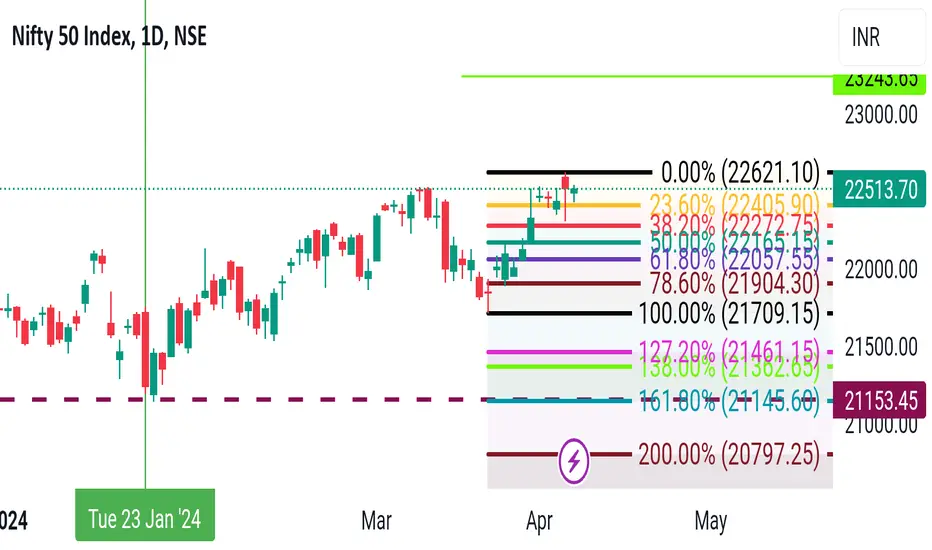
NiftyNifty Daily Chart Fibonacci taking support from 38%20 Level 22272 it will touch 23240 Buy on dip nifty Stock's...
NIFTY--Bull & Bear Trap?? Liquidity & More Liquidity ??Price is closed near the Support zone at 22000 levels...
we are still left with the liquidity below 21850 levels.
Bear Trap::
what happens if the liquidity cannot be done now...
If this time price failed to push downside more chances of fall below 21850 levels from topside.
If price opens up and continue to move upside there will be one more fall from the topside.
then the price won't respect the neckline as well, just gives pull back if possible, and eliminate all shorts, and it will continue its momentum towards top levels.
Those who are carrying the puts this time price manipulation done, by taking the price towards upside.
-------------------------------------------------------------------------------------------
Bull Trap::
When bear trap happens,
then price closing is given near the resistance levels,
then this time every one thinks that price is unable to break the bottom side,
so it is still in bullish and everyone then looks for long side.. by keeping the stop loss at 21850 levels, which is failed to break now.
this time price clears the stop losses at 21850 and again showing bullishness, this is pullback for short side continuation and again falls to grab all the liquidity below 21500 levels.
Sell setup::
look for short side when price comes to these area at Right Shoulder. If don't at least take care from this levels before long side.
A strong Bearishness is observed from the 22400 levels...
the right shoulder is strong one, after the liquidity grab on topside above Right shoulder, price again turns to be bearish.
and price comes to the downwards with strong bearishness mostly gap down occurs.
this time price breaks the 21850 levels and grabs all the liquidity.
----------------------------------------------------------------------------------------------------------
Points::
1.If we see the chart not only price forms a head and Shoulders in lower time frame also in Higher time frame as well.
2.price broken the trendline as well.

NIFTY50Pair : NIFTY 50 Index
Description :
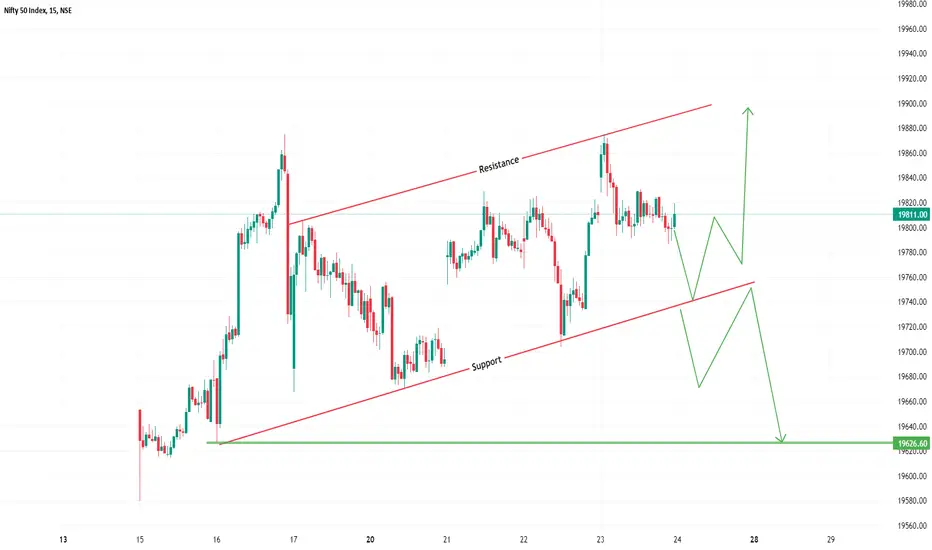
Rising Wedge as an Corrective Pattern in Short Time Frame with the Breakout of Lower Trend Line and Retracement
Break of Structure
RSI - Divergence
Completed " 12345 " Impulsive Waves

NIFTY ELLIOT WAVE TRADE SET UP Hello friends, as per Nifty Elliot wave theory nifty is near its buy zone near 21800 - 21900 its good opportunity to buy if nifty come this levels....

Nifty50 Daily Chart Analysis as of February 23, 2024 Nifty50 Daily Chart Analysis as of February 23, 2024
Disclaimer: I am not a financial advisor and this is not financial advice. Please do your own research before making any investment decisions.
Overall:
The Nifty 50 closed at 22,213 on February 23, 2024, marginally down by 0.02% from the previous day's close.
Despite the minor dip, the index has been on an upward trajectory since February 19th, gaining around 1.3% in the last five days.
This positive movement suggests a potential bullish trend, supported by a healthy recovery from the 21-day EMA and higher highs formation.
Key Technical Indicators / Technical Analysis:
The Nifty 50 is in an overall uptrend.
Moving Averages: The Nifty 50 is currently trading above its 50-day and 200-day moving averages, indicating a possible uptrend in the near future.
Relative Strength Index (RSI): The RSI is currently at 53.8, indicating that the index is neither overbought nor oversold. This suggests that there could be further upside potential.
MACD: The MACD is currently above the signal line, indicating a bullish momentum. The MACD indicator is positive, indicating a potential continuation of the uptrend in the medium to long term.
The Nifty 50 is currently trading above its 20-day and 50-day exponential moving averages (EMAs), indicating a bullish trend.
Key observations:
The Nifty has been following a trendline since January 20, 2024, suggesting a potential upside.
The 22,150-22,200 range remains a major resistance zone, while 21,000 is a crucial support level.
A breach above 22,300 could lead to further gains towards 22,500 and 22,600.
Support and Resistance Levels:
Immediate Resistance: The immediate hurdle for the Nifty 50 is seen at 22,300, followed by 22,500.
Immediate Support: The immediate support is at 22,000, with a crucial level at 21,875, which coincides with the 20-day EMA and Thursday's low.
Expert Opinions:
Several technical analysts believe that the Nifty 50 has formed a bullish reversal pattern on the daily chart, suggesting a potential move above 22,500.
However, some experts caution that the 22,300 level could be a significant short-term obstacle and recommend waiting for a confirmation breakout before taking any aggressive positions.
Overall, the technical analysis of the Nifty 50 Daily Chart as of February 23, 2024, suggests a cautiously optimistic outlook. While the index faces some immediate hurdles, the overall trend appears to be bullish. Investors should carefully consider their risk tolerance and investment goals before making any trading decisions.
Important to remember:
This information is based on past data and should not be considered financial advice.
Market conditions can change rapidly, and it is important to do your own research before making any investment decisions.
I hope this information is helpful. Please let me know if you have any other questions.
Disclaimer: I am not a financial advisor and this information should not be considered financial advice. Please consult with a qualified financial advisor before making any investment decisions.
Happy learning with trading. Cheers!🥂

NIFTY--Impulse-Correction?? A Strong impulse wave is identified in NIFTY.
Wait for the corrective wave to continue its direction or reversal.
After corrective wave will decide further direction of NIFTY.
Now it is at Resistance zone.
will see tomorrow outside bearish candle or Outside bullish candle forms.
Because liquidity lies on both sides.
Until price breaks the 21800 levels no short side view.

NiftyNifty weekly chart forming flag and Pole breakout but waiting for price sustain.. Buy on dip nifty Stock's..

NIFTY--Bullish View (22.5K) ??Bullish Scenario::
----->> if price breaks the trendline on topside.. price will reach ATH, and facing resistance at ATH.. before going to reach ATH ,on topside we have intermediate resistances at 22050 level..
---->>if price opens upside above 21950...we have consolidation chance between the trendline and 22050.
If price consolidation for the entire day, and price closes at ATH.
Then we have chance of Gap down(If Bearish view)..continue moving downside and will test 21300 level of demand zones.
or
Continuation may happens to upside...Keylevel to watch--21800.
if trendline acts as support...Wait for the trendline retest, Price again tries to test the trendline and moves upside for targets of 22450,22600 levels,

NIFTY--Consolidation or Bearish??look for bearish from 22050 and trendline...
Keep in long side as long as price is above the 21950 levels...
if you want to go short wait for the price to facing the resistance from 21875 key zone
If price takes the support at trendline or 21950 go bullish by keeping the SL at Key zone.
we have a chance of consolidation between the zones 22050 and 21950 and manipulation to ATH, and then Distribution to downside.
Keep safe here...price is now at turning point...
Have a look at the Bullish Continuation and Bearish view for complete analysis.

KHAICHEM BUY 78-81 SL 69 TGT 95/107/140/164/200KHAICHEM BUY 78-81 SL 69 TGT 95/107/140/164/200
DISCLAIMER: These videos are for educational purposes only. Investing of any kind involves risk. While it is possible to minimize risk, your investments are solely your responsibility. It is imperative that you conduct your own research. I am merely sharing my opinion with no guarantee of gains or losses on investments.

Analysis for a Swing Position in Nifty.
Price has reacted to the Sourcre Daily Demand and has headed towards its Destination of Daily Supply.
This is the Demand and Supply Equilibrium Curve showing us the levels
As Traders we gotta Buy low and sell high
This is a Buy Trade with a substantial Reward to Risk Ratio.

NiftyNifty Daily Chart with Fib Retracement my view is Bullish because of Retracement might be will go 20870 point one it will bullish again so buy on dip only stocks for swing not nifty or banknifty..

NIFTY--Supply zone@21700 ??After a strong fall, expecting some retracement in nifty.
on topside supply zone is identified at 21650-21700 levels.
so liquidity is lies above and below this levels,
after testing these levels again have a chance of fallback to test the demand zones at 21300 levels and at 20800 levels.
If 21300 level fails to push it upside, quick drop and rise will see in coming sessions.
so this week mostly in this range 21700-21300 levels.
Be careful, long after 21700 short below 21300.

Falling Wedge pattern breakout in NIFTY 50NIFTY 50 INDEX
Key highlights: 💡⚡
✅On 15 MIN Time Frame Stock Showing Breakout of Falling Wedge Pattern.
✅Strong Bullish Candlestick Form on this timeframe.
✅It can give movement up to the Breakout target of 22040+.
✅Can Go Long in this stock by placing a stop loss below 21700-.

Happiest Minds (NSE: HAPPSTMNDS) // Going Bullishwww.tradingview.com
HAPPSTMNDS : After a great fall and making 52w low, this is currently trying to exit from consolidation phase. One can look for medium to long term buy by keeping the StopLoss at 890, the first target can be 960 and then the next target will be 1015 and then 1120. These are immediate targets. The final target will be 1490. One can start with low volume and gradully keep increasing that.

NiftyNifty 1hr chart nifty forming like Ascending Triangle Pattern nifty if will be go upside only one condition it have to break trendline firstly then it will be sustain on 21755 with good green candle..

Nifty has taken support at 50EMA and can go towards new ATHIt looks Like RSI on Nifty Hourly chart has cooled down and is set for another rally. Once the Nifty and if the Nifty is able to cross 20946 and close above it on hourly candle, we may see Nift rise towards 21026, 21125 or even 21254 within a short span of time. Supports for Nifty on the lower side are 20867, 20813 and 20763.

#NIFTY: Next Possible target 24000?Hey Everyone,
In our view 19000 region remain important and I think price will fall within this week. once it falls at our region we can then take swing buy entry up towards 24000 region which will be area where sellers can aim at.
Please like and share!

NIFTY VIEW , SELL YOUR HOLDINGSif you have any holdings make sure you book your profits. you have to know when to book profits and when to not.

NIFTY--Trading in a channel??Keep in long even if price comes down.
as long as price is in a channel keep in long side only....
no sign of bearishness as of now in nifty...
If 19700 holds then it will soon touch the ATH.
If price breaks the channel then will thin of short side, after a retest is done.
Thanks for your support and Encouragement. Trade safe.
Nifty Head and shoulder patternNifty formed a Head and shoulder pattern and now in retesting area, new sellers can enter with conservative mind. Target mentioned in chart kindly check it.
