NIFTY|BANKNIFTY|NIFTYANALYSIS|BANKNIFTYANALYSIS FOR EDUCATIONNIFTY |BANKNIFTY|NIFTYANALYSIS | BANKNIFTYANALYSIS FOR MONDAY
| nifty analysis for tomorrow | #niftypredictions | nifty live trading |Nifty50
BANKNIFTY:-
If Banknifty sustain the level of 44300 and spend time and break 44350, then 44450-44550
If Banknifty break down 44300 spend time below it and break 44150 then 44050-43950
NIFTY:-
If Nifty sustain the level of 18600 and spend time and break 18625, then 18650-18675-18700
If Nifty break down of 18600 spend time and break down 18575, then Nifty 18500-18525-18500
This video is for educational purpose and my personal view .We are NOT SEBI registered Advisor, we only give the level on our practical trading experience. Kindly take the trade according to your risk and reward position and consulting your advisor.
#stockmarkets
#nifty
#MondayMarketPrediction
#nifty50
#nfityoutlookfornextweek
#bankniftyoutlookfornext week
#niftyoutlookformonday
#bankniftyoutlookformonday
#niftyforecast
#bankniftyforecast
#niftyshareprice
#bankniftyshareprice
#tommorrow niftyprediction
#tommorrow bankniftypredicton
#niftytargettommrrow
#bankniftytargettommrrow
#30may nifty
#30may banknifty
#30may marketanalysis
#bankniftylive
#banknifty
#bankniftyoptions
#bankniftystrategies
#bankniftyfuture
#bankniftyoptionstrategy
#bankniftycalls
#bankniftyintraday
#bankniftylivetrading
#bankniftyweeklyexpiry
#bankniftycrash
#bankniftytomorrow
#bankniftypredictions
#bankniftychart
#bankniftytips
#bankniftypremium
#bankniftyoptions
#bankniftyfuture
#bankniftytomorrowprediction
#bankniftyoption
Niftyoptions

Nifty Trade Setup (26-May-2023)This will be my personal trade Setup, This is not an advice of any kind to initiate trade according to this setup.
As i was busy with some work i didn't posted my trade setup for 25-May-2023 and also didn't traded on 24-May-2023 although it was good session too. watched chart for few minutes today and closed terminal because of work today. Today on expiry day there were opportunities also if someone trade with patience. I didn't took trade today because i didn't planned anything and this was my bad habit before that i always trade if market in moving from support or resistance i took trade with out any setup or patience so that i don't miss any profits as you may know this (FOMO). Which was my reason for more losses than profits. I will post on what i am doing to improve it in separate post. This is going to be my setup for tomorrow:
Today market opened flat and there was selloff from 18265 to 18200 almost 65 points down. but in last 1 and half hour it took support at (18200) and then rise like rocket making almost all green candles without any pullbacks on 5 min TF gaining almost 100 points from day's low.
Price is forming triangle and closed near trendline resistance.
Setup for Tomorrow:
1.) If it opens flat and sustains this trendline resistance on 15 TF then i will look to buy CE for target of 18363, 18371 and 18380.
2.) If it opens gap up i will look for rejections from same targets or near by CPR and will buy PE trade for near by support levels which is 18300 as 1st support or CPR whichever will be closer.
3.) If it opens gap down 1st support is placed at 18300 level if it takes support at this level and holds for 15 to 30 minutes. I will look for buying CE.
Views are bullish so will trade cautiously if i am trading in opposite direction. As from Volume there was lot of buying buying when price was moving above today as compared to while it was selling off.
Hit like to keep me motivated for keeping my trading journal also if you can help as Trading View is holding rewards if Ideas or Script can be listed in Editor Picks :) . also one can comment how i can make it better or any improvements i can make in my trading setups or improving this journal.

Nifty Price Forecast for May and JuneNifty Price Forecast for May and June, July.
Note: Only if Nifty price does not hold above 18350 to confirm this prediction.

Nifty 50 Index Next MovePair : Nifty 50 Index
Description :
Bearish Channel as an Corrective Pattern in Long Time Frame with the Breakout of the Upper Trend Line and Retracement
Divergence - RSI
Break of Structure
Completed " 12345 " Impulsive Wave and " ABC " Corrective Wave
SMC - CHOCH
Fibonacci Level - 78.60%

Nifty Intraday trade set-up 8 May 2023NSE:NIFTY
Important levels for tomorrow
If ₹18050 is broken
Short entry: ₹18040
Stop Loss: ₹18100
Target: 1) ₹17920
2) ₹17800
Never trade a short without a stoploss.
*Not a financial advice.
My charts speaks louder than words.
I'm a chartist and I paint charts.

Pin Point Prediction Of Stocks updated On 6-5-23Hello Traders,
Presenting a good simp [le and crystal clear analysis for the stock of week to add extra income in your pockets. To understand complete entry and exit check below.

Clearly Nifty will break 18000 level. Expiry day, tough day because mostly time decay enjoys the premium, therefore tougher for option buyers like me to result into profit. Nonetheless, we enjoy rallies or drops when Open Interest data tells us that Funds have been trapped at the surpassing of Support level that was at a strike price or rallies that gap up above resistances. These two levels in the graph I have found to be appropriate for tomorrows' gameplay.

Nifty Futures Chart Analysis for Friday#Nifty Futures Chart Analysis for Friday.
While global indices have been moving lower for the few days, But many major markets have shown strong recovery over the past day. However, when analyzing the US indices, it is still below the resistance zone. That's the only thing we have to say on the negative side of the market right now. Apart from that, our market continues to have a very bullish momentum.

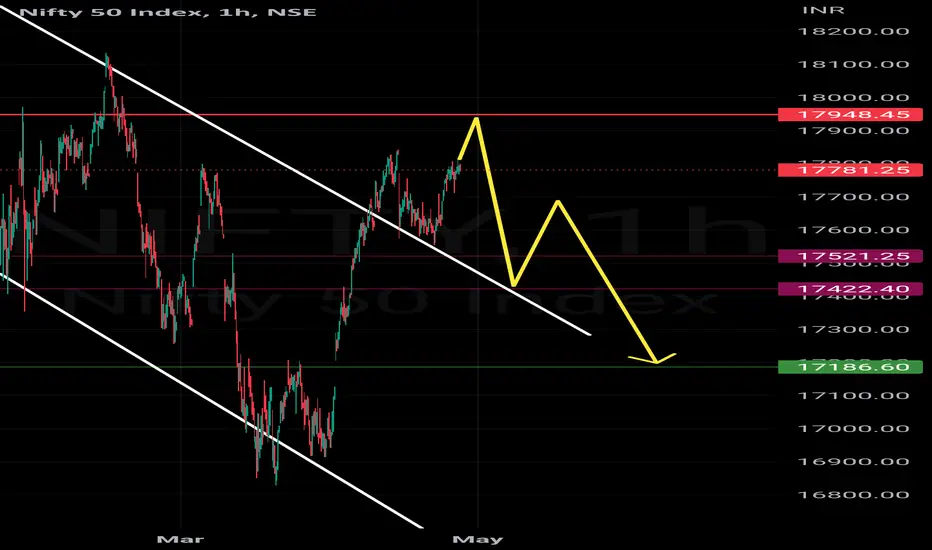
Nifty 50 index: is this breakout sustainable?Greetings Fellow Traders,
As we can see in this chart that Nifty was trading inside the Chanel down from past few days and since yesterday price broke that Chanel down and bounced on it few times...but will this be a sustainable breakout for further upside move?
Well in my opinion that will be dependent on 17,950
As a resistance it's more prominent than that Chanel down...and for any sustainable upside move price needs to break that area... otherwise downside areas are mentioned in Chart...
Good Luck 🍀
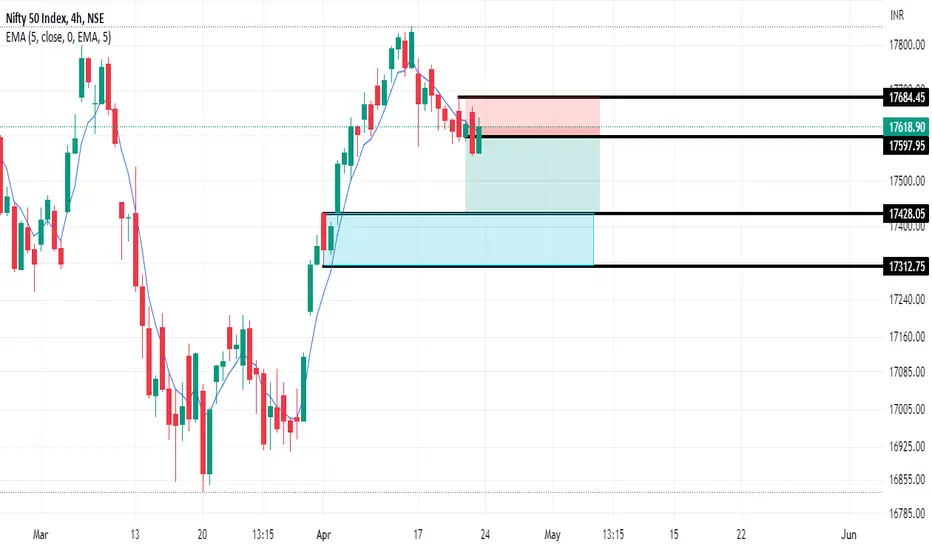
NIFTY OPTION TRADE FOR 200 POINTS!!!
We have a Correction as of now, Price is marching towards the Daily Demand formed @ 17482.05 (SHown in the Chart), This is the Demand area where the FIIs have their unfilled orders, Currently Price is in a Powerful 4H Supply and Price should decline from this area itself hence Buying 17800 PE for April Expiry with a Target of 381.50.
CHEEERRRRRSSSSSS!!!!! ENJOY THE RIDE!!!
NIFTY 21st April 2023 SetupBUY Above 17633 (NIFTY 17550 CE) Target 17666, 17700, 17777,17826
Sell Below 17575 (17600 PE) Target 17514, 17483
RISK Traders can start selling at 17615 ( 17650 PE) Target 17575, 17514, 17483

Nifty 19th April 2023 BUY Above 17666 (NIFTY 17600 CE) Target 17700, 17777,17826
Sell Below 17618 (17650 PE) Target 17564, 17514, 17483

Pin Point Predictions Of Nifty For 17-4-23Hello Traders,
To make your trading easy posted these prefect marking levels from where price always reacted in a particular direction. To know more in details how to use then to create returns check below.

Pin Point Predictions Of Nifty For 6-4-23Hello Traders,
My bit is to make your trading stress free with right prediction these marking shows all . If you want complete details for next day trading then check below.

Whipsaw Must Happen.Nifty has entered the supply zones Cluster, it cannot go further no matter what ranges of Dow futures or FTSE openings try to escalate it. CE at this moment would be a disaster. Trendline breakdown would give you a better way out and short the 17200 strike price till it reaches at the end of Wednesday's closing.

IF PRICE ACTION IS WRONG THEN I AM HAPPY TO LOOSE MONEY.Go short, I cannot shout more. A little change of direction does not hurt a trend, a trend takes huge momentum which is missing till now, DJI for instance has just retraced back from risk aversion levels of crisis haphazard, nonetheless they have shifted to uptrend no doubt but India lacks that fundamental support from Foreign Investments and also our Domestic Institutions have filled their belly of buying equities as much as possible. The index has a bit more room in downtrend, smaller up ticks would occur for sure but at the end April is going to be a BEARISH month.

Pin Point Prediction Of Nifty For 31-3-23Hello Traders,
This chart was posted to make your trading easy to know more about it future predictions can check below.

No bear has to worry about Nifty.Trend line plus Global Cues affirm that Bullish momentum has begun in the markets. I think opposite thats why than providing boring arguments like retracing lines or bearish indicators, I went through Classic Chart Patterns mythology. Nifty aft 16500 Hala Bol.

NIFTY VERY DUSKYA bullish start can be traded as a sell on rise opportunity not for this expiry as a long consolidation awaits. Nonetheless Supply zones have started to react and price soon will reach at the bottom of 16900.

Pin Point Prediction Of Nifty For 27-3-23Hello Traders,
To make your trading easy , I marked perfect intraday levels so that your trading could be meaningful & profitable. For complete details check below.

Until there is clarity there is chance of trend reversals.U.S. markets had started to recapitalise with strong volumes and Federal Reserve had yet again thrown the markets into dungeons, sentiments for far ended future is dark but calmness in Traders mind is soothing who do not indulge into straightforward long calls, and have fun with PUTS. Theme of Global Securities and ETFs is increasing at higher ends but Equities have shown bad faith to the Investors at large. Soon there will come another retracing peak and everybody will start to think the Downtrend ends here and Uptrend begins, it could be because it is much required and estimated now, not even now then when? But technical analysis is giving vibes of Shorting the NSE indices each and everyday, but fundamentally speaking going long is always the choice we all like and end up thinking more about it and then ultimately doing the human error. Bots are vitalised well enough to trade in any environment but are they configured to see an end of a trend and signal it to us? No only TA can do that.

Pin Point Predictions Of Nifty For 24-3-23Hello Traders,
This chart marking was done for all traders , to make their trading easy. For more details check below.

The father of Classical Chart Patterns.What do you think Downtrend is ending or the chart pattern has forecasted a huge durational outcome? join us at www.herozero.co.in. Trade Now $.
