Major Breakout in Nifty now holding the levels key. We saw a major Breakout in Nifty today. Finally Nifty closed above much coveted levels of 25251. Nifty made a high of 25565 and closed at 25549 which was a remarkable comeback. What we are seeing on chart is a cup formation happening in Nifty. For flying further Nifty needs to have a strong closing tomorrow and stronger monthly closing on Monday that is 30th June. These 2 closings will be very important. We need a Nifty closing above 25884. Even if that does not happen a monthly closing above 25251 will also be considered a strong closing. Nifty is strongly on the path of recovery for sure and supports and resistances for Nifty remain as under:
Nifty Supports Remain At: 25251, 24994, 24760 and 24588 (Mother line). If by chance under unlikely circumstances Mother line is broken then Bears will become more empowered and might try to pull Nifty towards 24209 or even 23892 (Father line support).
Nifty Resistances Remain At: 25565, 25740, 25884, 26066 and finally previous All time high resistance of 26277.
Disclaimer: The above information is provided for educational purpose, analysis and paper trading only. Please don't treat this as a buy or sell recommendation for the stock or index. The Techno-Funda analysis is based on data that is more than 3 months old. Supports and Resistances are determined by historic past peaks and Valley in the chart. Many other indicators and patterns like EMA, RSI, MACD, Volumes, Fibonacci, parallel channel etc. use historic data which is 3 months or older cyclical points. There is no guarantee they will work in future as markets are highly volatile and swings in prices are also due to macro and micro factors based on actions taken by the company as well as region and global events. Equity investment is subject to risks. I or my clients or family members might have positions in the stocks that we mention in our educational posts. We will not be responsible for any Profit or loss that may occur due to any financial decision taken based on any data provided in this message. Do consult your investment advisor before taking any financial decisions. Stop losses should be an important part of any investment in equity.
Niftyoutlook

Final hurdle remains to be crossed before Nifty can fly further.One important final hurdle of 25251 remain just in front of Nifty before it can fly further. I can it a final hurdle because it is an important trendline resistance. Last 2 days Nifty has tried to climb above it but we did not get a closing above it yesterday and today as well. Today Nifty made a high of 24266 but closed at 25244. It could not hold on to the ground above 25251. The level is challenging but positive momentum built from today's display might allow it to close above the same. Only time will tell. Closing of this week will be very important.
Nifty resistances remain at: 25251, Closing above 25251 will empower Bulls to pull Nifty further upwards towards 25317, 25491 and 25660.
Nifty supports remain at: 24999, 24713, 24749 (Mother Line Support), 23875 (Father line support). (Closing below Father line support can bring Bears back into the game).
Disclaimer: The above information is provided for educational purpose, analysis and paper trading only. Please don't treat this as a buy or sell recommendation for the stock or index. The Techno-Funda analysis is based on data that is more than 3 months old. Supports and Resistances are determined by historic past peaks and Valley in the chart. Many other indicators and patterns like EMA, RSI, MACD, Volumes, Fibonacci, parallel channel etc. use historic data which is 3 months or older cyclical points. There is no guarantee they will work in future as markets are highly volatile and swings in prices are also due to macro and micro factors based on actions taken by the company as well as region and global events. Equity investment is subject to risks. I or my clients or family members might have positions in the stocks that we mention in our educational posts. We will not be responsible for any Profit or loss that may occur due to any financial decision taken based on any data provided in this message. Do consult your investment advisor before taking any financial decisions. Stop losses should be an important part of any investment in equity.
Nifty lost gains but it is a positive sign to close above 25KNifty in the Euphoria of ceasefire between Iran and Israel gained a lot of ground early in the day and made a high of 25317 but could not sustain the levels and lost massive 273 points due to profit booking to close the day at 25044. Although the loss was big but the silver lining is Nifty still ended the day 72 points in the green and closed above 25K levels. As there were news and claims related to ceasefire violations from both sides a lot of investors and participants were apprehensive of carrying long positions forward. If the things remain positive over night and if important resistance levels of 25116 and 25251 are crossed we might yet again see positive momentum building.
Nifty Resistances remain at: 25116, 25251, 25317. Closing above 25317 will lead to further upside towards the next resistance levels of 25491 and 25660.
Nifty Supports remain at: 25499 (Trend line support), 24713, 24521 (Mother Line Support) and 24463. closing below 24463 can had over the gains to the Bears who can drag index down towards Father line support of 23861.
Disclaimer: The above information is provided for educational purpose, analysis and paper trading only. Please don't treat this as a buy or sell recommendation for the stock or index. The Techno-Funda analysis is based on data that is more than 3 months old. Supports and Resistances are determined by historic past peaks and Valley in the chart. Many other indicators and patterns like EMA, RSI, MACD, Volumes, Fibonacci, parallel channel etc. use historic data which is 3 months or older cyclical points. There is no guarantee they will work in future as markets are highly volatile and swings in prices are also due to macro and micro factors based on actions taken by the company as well as region and global events. Equity investment is subject to risks. I or my clients or family members might have positions in the stocks that we mention in our educational posts. We will not be responsible for any Profit or loss that may occur due to any financial decision taken based on any data provided in this message. Do consult your investment advisor before taking any financial decisions. Stop losses should be an important part of any investment in equity.

Great recovery by Nifty to end the week. Nifty has shown a great recovery to end the week at 25112 despite persisting global uncertainties. This again shows imminent strength of Indian markets and confidence on the local factors by Bulls.
Nifty however is now entering a tough resistance zone which starts exactly from 25113 and extends till 25251. Once we get a closing above 25251 the Bulls will try to control the market with more strength. Till that happens it can still go in any direction. The supports for Nifty remain at 24869, 24713, 24480 (Mother line support), 24175 and finally 23838 (Father line support).
If any major further global escalation happens during the weekend and we get a closing below 23838 then Bears can become more powerful and they might have potential to push market further down towards 23047 or below.
Things hang in balance despite a strong closing on Friday as the shadow of the candle is still neutral.
Disclaimer: The above information is provided for educational purpose, analysis and paper trading only. Please don't treat this as a buy or sell recommendation for the stock or index. The Techno-Funda analysis is based on data that is more than 3 months old. Supports and Resistances are determined by historic past peaks and Valley in the chart. Many other indicators and patterns like EMA, RSI, MACD, Volumes, Fibonacci, parallel channel etc. use historic data which is 3 months or older cyclical points. There is no guarantee they will work in future as markets are highly volatile and swings in prices are also due to macro and micro factors based on actions taken by the company as well as region and global events. Equity investment is subject to risks. I or my clients or family members might have positions in the stocks that we mention in our educational posts. We will not be responsible for any Profit or loss that may occur due to any financial decision taken based on any data provided in this message. Do consult your investment advisor before taking any financial decisions. Stop losses should be an important part of any investment in equity.

Nifty Analysis EOD – June 19, 2025 – Thursday🟢 Nifty Analysis EOD – June 19, 2025 – Thursday 🔴
📉 Bookish Spinning Top Doji – Another Day of Indecision on Expiry
Nifty opened with a mild +16-point gap-up and immediately dipped to test the Previous Day Low (PDL), marking the day low at 24,738.10. A quick reversal took the index 125 points higher, reaching a high of 24,863, only to settle back into theta-eating mode around VWAP.
Just as things looked ready to turn, a 13:50 breakout attempt fizzled as the price faced rejection above the CPR zone, leading to a final dip below the previous low, touching a new intraday low at 24,733.
Though the intraday close was at 24,744.70, the settlement close was 24,793.25 — a 47.65-point difference that’s not trivial, especially on expiry day.
The entire day remained a narrow-range, rollercoaster ride — clearly showing neither bulls nor bears could take charge. The total range was just 130 points, forming a textbook Spinning Top, which reflects market contraction.
📌 Now what?
Keep a close eye on the range:
🟢Bullish Breakout ➤ above 24,862 (CDH)
🔴Bearish Breakdown ➤ below 24,733 (CDL)
The squeeze is on. Expansion is near.
🕯 5 Min Time Frame Chart with Levels
🕯 Daily Time Frame Chart
🕯 Daily Candle Breakdown
Open: 24,803.25
High: 24,863.10
Low: 24,733.40
Close: 24,793.25
Change: −18.80 (−0.08%)
📊 Candle Structure Breakdown
Real Body: 10.00 pts → 🔻 Small Red Candle
Upper Wick: 59.85 pts
Lower Wick: 59.85 pts
🔍 Interpretation
Equal wicks show balanced buying and selling.
Small real body signals strong indecision.
Intraday volatility was neutral despite expiry impact.
🕯 Candle Type
⚖️ Perfect Spinning Top / Doji-like Candle – Indicates market contraction, waiting for directional resolution.
📌 Key Insight
The market continues its tight range-bound structure.
Any breakout beyond 24,865 or breakdown below 24,730 could trigger directional moves.
Till then: “Wait and watch mode.”
🛡 5 Min Intraday Chart
⚔️ Gladiator Strategy Update
ATR: 240.08
IB Range: 125.00 → Medium IB
Market Structure: ⚖️ Balanced
Trades:🚫 No Trade Triggered by System
📌 Support & Resistance Zones
Resistance Levels
24,894 ~ 24,882
24,972 ~ 25,000
25,060 ~ 25,080
25,102 ~ 25,125
Support Levels
24,825 ~ 24,847
24,725 ~ 24,735
24,660
24,590
💭 Final Thoughts
The market is compressing like a coiled spring.Spinning tops near resistance often signal upcoming volatility.Let the breakout come to you — don’t pre-empt, participate.
🧠 “When the market sleeps in narrow ranges, it dreams of big moves.”
✏️ Disclaimer
This is just my personal viewpoint. Always consult your financial advisor before taking any action.

Nifty Analysis EOD – June 18, 2025 – Wednesday🟢 Nifty Analysis EOD – June 18, 2025 – Wednesday 🔴
⚖️ Dhamakedar Start, But Indecisive Close – Weekly Expiry Caution Ahead
Nifty opened with a 65-point gap-down at 24,788.35, but what followed was a power-packed bullish start — within just 25 minutes, it surged over 150 points, hitting a day high of 24,947.55.
However, the euphoria didn’t last.
As the session progressed, the index gradually gave up all its gains, slipped below the previous day’s low, and finally found support at 24,750, a critical level. By the end of the day, Nifty settled around the opening zone at 24,812.05, just +23 points above open, while net change remained −41.35 points from the previous close.
The day showcased both strength and weakness — a typical "everyone-expected-fall-but-it-didn't-fall-enough" kind of day. The long upper wick reflects failed attempts by bulls, while the lack of breakdown keeps the bears in check.
Tomorrow is weekly expiry — caution is advised.
🕯 5 Min Time Frame Chart with Levels
🕯 Daily Time Frame Chart
🕯 Daily Candle Breakdown
Open: 24,788.35
High: 24,947.55
Low: 24,750.45
Close: 24,812.05
Change: −41.35 (−0.17%)
📊 Candle Structure Breakdown
Real Body: 23.70 pts → ✅ Green Candle (tiny body)
Upper Wick: 135.50 pts
Lower Wick: 37.90 pts
🔍 Interpretation
Strong bullish momentum early on, but buyers failed to hold above 24,900.
Long upper wick signals supply or profit-booking at higher levels.
Price closed near open despite wide range → indecision between bulls and bears.
🕯 Candle Type
🟨 Spinning Top – A textbook indecisive candle, often seen at turning points or during pauses in trend.
📌 Key Insight
Buyers couldn’t reclaim or close above 24,950 — resistance strengthened.
Support held at 24,750 — but barely.
Watch 24,950 on upside and 24,750 on downside — a breakout from either may decide expiry-day trend.
🛡 5 Min Intraday Chart
⚔️ Gladiator Strategy Update
ATR: 252.34
IB Range: 170.65 → Medium IB
Market Structure: ⚖️ Balanced
Trades:🚫 Short Trigger at 12:45 : Trapped - SL Hit
📌 Support & Resistance Zones
Resistance Levels
24,894 ~ 24,882
24,972 ~ 25,000
25,060 ~ 25,080
25,102 ~ 25,125
Support Levels
24,825 ~ 24,847
24,725 ~ 24,735
24,660
24,590
💭 Final Thoughts
When price travels 200 points but closes flat, it tells you something: Smart money is waiting.Weekly expiry ahead could bring unexpected moves.✅ Stay nimble. Stay alert.
🧠 “When in doubt, let the market shout — not whisper. Listen for the breakout.”
✏️ Disclaimer
This is just my personal viewpoint. Always consult your financial advisor before taking any action.

Resistance zones and Geo-political instability acting up.Geo-Political instability and resistance zone are acting up together to stop Nifty and not allowing it to close above 25K. As the world is looking at developments in Iran Vs Israel conflict with beated heart market today gave up some gains from yesterday. The only index looking strong is IT index right now. Avoid taking very long positions unless you are very sure of the company. Yesterday also Nifty failed to close above 25K opened briefly near 25K today and then moved downwards. Lot will be decided in the short term by the developments that happen tonight. Important G7 meet and US Federal reserve Rate Cut meet is also to happen later in the week. These 2 global factors will decide fate of the market in the short term. Local factors are all in line and nothing to worry for Indian markets on that front.
The supports for Nifty remain at: 24713 (Trend line support), 24425 (Mother line support of Daily chart), next support is near 23917, 23806 (Father line support of daily chart is in place). Closing below 23906 can lead to further down side and in such a scenario Nifty can fall further towards 23500 or 23047 levels. If we get a closing below that we will give updates regarding the same.
Resistances for Nifty remain at: 24982 (Today's high), 25112 and trend line resistance of 25251. When we get a closing above 25251 we will update you regarding the further upward resistnace levels.
Disclaimer: The above information is provided for educational purpose, analysis and paper trading only. Please don't treat this as a buy or sell recommendation for the stock or index. The Techno-Funda analysis is based on data that is more than 3 months old. Supports and Resistances are determined by historic past peaks and Valley in the chart. Many other indicators and patterns like EMA, RSI, MACD, Volumes, Fibonacci, parallel channel etc. use historic data which is 3 months or older cyclical points. There is no guarantee they will work in future as markets are highly volatile and swings in prices are also due to macro and micro factors based on actions taken by the company as well as region and global events. Equity investment is subject to risks. I or my clients or family members might have positions in the stocks that we mention in our educational posts. We will not be responsible for any Profit or loss that may occur due to any financial decision taken based on any data provided in this message. Do consult your investment advisor before taking any financial decisions. Stop losses should be an important part of any investment in equity.

Solid V Shaped recovery within the Parallel channel for NiftyNifty recovered sharply within the parallel channel. The reasons that can be attributed are inherent strength in the Indian market and swift recovery in IT, Infra, Metal, commodities, Realty, Mid and Small cap browsers. The closing of Nifty was at 24946 which is just above the mother line which is at 24908. The same mother line provided the support to Nifty in the last few hours of trade when there was some intraday profit booking pressure.
Nifty Supports remain at: 24908 (Mother line Support), 24836, 24690 (Father Line Support), 24555 (Channel Bottom Support) and 24480 recent low. Below 24880 Nifty will be very weak and Bears in that scenario can drag Nifty further down to 24195 or 23957. These are the levels as of now. If we go below these levels in unlikely circumstances we will update the levels once we get there.
Nifty Resistances remain at: 24973, 25106 (Mid Channel Resistance) and 25231.Once we close above 25231 we will update further levels.
Disclaimer: The above information is provided for educational purpose, analysis and paper trading only. Please don't treat this as a buy or sell recommendation for the stock or index. The Techno-Funda analysis is based on data that is more than 3 months old. Supports and Resistances are determined by historic past peaks and Valley in the chart. Many other indicators and patterns like EMA, RSI, MACD, Volumes, Fibonacci, parallel channel etc. use historic data which is 3 months or older cyclical points. There is no guarantee they will work in future as markets are highly volatile and swings in prices are also due to macro and micro factors based on actions taken by the company as well as region and global events. Equity investment is subject to risks. I or my clients or family members might have positions in the stocks that we mention in our educational posts. We will not be responsible for any Profit or loss that may occur due to any financial decision taken based on any data provided in this message. Do consult your investment advisor before taking any financial decisions. Stop losses should be an important part of any investment in equity.

Nifty Analysis EOD – June 13, 2025 – Friday 🟢 Nifty Analysis EOD – June 13, 2025 – Friday 🔴
🕊️ Gap-Down on Geopolitical Tension – Buyers Step In at Crucial Support
Nifty opened with a massive gap-down of 415 points at 24,473 triggered by overnight geopolitical tensions — testing a crucial swing low from May 22. Interestingly, the market formed an OL (Open = Low) pattern and staged a powerful 281-point intraday recovery, closing near the day’s high at 24,718.60.
While the adjusted close still reflects a −0.68% drop, the price action was dominantly bullish. The strong bounce from the 24,460–24,520 demand zone — a region that had acted as a reversal zone multiple times earlier — reaffirms its significance.
🧭 If global cues stabilize or turn positive, this could pave the way for a bounce back toward 25,000. But if Friday’s low is breached, sentiment damage may deepen further. For now, intraday opportunities are preferable over positional plays, as uncertainty persists.
📝 A reminder from the May 22 note:
“Is the retracement run finished? Technically, YES. A bold call, but unless global headwinds reappear, today’s low must sustain.”
Nifty has once again honored this level — but the coming sessions will determine whether this bounce was genuine or temporary.
🛡 5 Min Chart with Levels
🕯 Daily Time Frame Chart
🕯 Daily Candle Breakdown
Open: 24,473.00
High: 24,754.35
Low: 24,473.00
Close: 24,718.60
Net Change: −169.60 (−0.68%)
📊 Candle Structure Breakdown
Real Body: 245.60 pts → 🟢 Strong Green Candle
Upper Wick: 35.75 pts
Lower Wick: None (OL Formation)
🔍 Interpretation
Despite the gap-down, bulls took control right from the open.
The absence of a lower wick signals firm intraday confidence.
Closing near the high reinforces the buying strength, even on a net down day.
🔦 Candle Type
💚 Bullish Marubozu–like (OL) Candle– Represents a strong intra-session reversal, where buyers dominated from the very first tick.
📌 Key Insight
Price respected the 24,460–24,520 zone, once again validating it as key support.
If the next session crosses and sustains above 24,750–24,770, a short-term reversal confirmation could follow.
However, a breakdown below 24,473 may renew bearish pressure.
🛡 5 Min Intraday Chart
⚔️ Gladiator Strategy Update
ATR: 269.05
IB Range: 145.05 → Medium IB
Market Structure: Balanced
Trades:✅ 10:20 AM – Long Triggered → Target Achieved, Trailing SL Hit (RR: 1:1.7)
📌 Support & Resistance Zones
Resistance Levels
24,725 ~ 24,735
24,825 ~ 24,847 (Fibonacci 0.5 retracement level)
24,882 ~ 24,894
24,972 ~ 25,000
25,060 ~ 25,080
Support Levels
24,660
24,640 ~ 24,625
24,420
24,365 ~ 24,330
24,245 ~ 24,220
💭 Final Thoughts
Friday’s session was a battle between fear and resilience — and bulls showed up just in time. The key test ahead: can the index reclaim 25K or will the bounce fade away?
🧠 “Great rebounds are born from great fear — but follow-through is what separates noise from reversal.”
✏️ Disclaimer
This is just my personal viewpoint. Always consult your financial advisor before taking any action.

Market Recap & Outlook – Nifty and S&P 500, Bulls coming?The Indian stock market witnessed a volatile week, with the Nifty 50 closing at 24,718, down nearly 300 points from the previous week's close. The index hit a high of 25,222 and a low of 24,473, moving precisely within the range of 25,500–24,500 that I highlighted last week. I hope some of you took advantage of the cautionary signal!
Key Support Zone in Focus
The 24,400 level continues to act as a strong support—bulls have fiercely defended this zone for the past five weeks. However, if this level cracks, we could see Nifty test deeper supports at 23,900 and 23,700.
Geopolitical Overhang
The ongoing Iran-Israel tensions remain a wildcard. Unless the situation escalates significantly, I expect Nifty to trade in the 24,400–25,200 range this week.
Short-Term Strategy
I believe the current selling pressure might persist for 2–3 more sessions before the bulls regain control. Historically, Nifty tends to stay under pressure until mid-June, followed by a bullish phase leading into mid-July. If we get more dips, I’ll be looking to accumulate quality mid-cap and small-cap stocks for potential short-term gains.
S&P 500 Update
The S&P 500 closed at 5,976, down just 25 points from the previous week. The index made a high of 6,059 and a low of 5,963, forming a bearish candle on the weekly chart.
Watch These Levels
If 5,963 breaks, expect further downside towards 5,899 and 5,875. On the flip side, a sustained move above 6,030 could ignite bullish momentum, targeting resistance zones at 6,090 and 6,142.
Final Take – Bulls Gearing Up?
The broader trend still favors bulls, especially if key support levels hold. Watch for a turnaround by mid-week—"Bulls may soon reclaim the throne!"

Nifty 12-JUNE-25 VIEW Everything is on chart for SWING view
AREA UP AREA LOW SPACE
AND MY VIEW FOR LONGTERM IS SAME

Nifty Analysis EOD – June 12, 2025 – Thursday🟢 Nifty Analysis EOD – June 12, 2025 – Thursday 🔴
📉 Range Breakout on Expiry – Bears Steal the Show
As highlighted in yesterday’s note — “Watch 25,222 on the upside and 25,080 on the downside for breakout” — Thursday’s expiry session decisively broke the range to the downside, unleashing a sharp bearish move.
Nifty opened strong at 25,164.45, briefly tested 25,196, but once again failed to challenge 25,200. The rejection triggered a slide to 25,083, and shortly after, the critical support of 25,080 gave way. This breakdown triggered long unwinding and fresh shorts, accelerating the fall all the way to 24,825.90 — a sharp 197-point drop.
Though there was a brief 90-point retracement, that too was sold into, and the index closed at 24,888.20 (adjusted), very close to the day’s low. This fall filled the Gaps created on June 6 and 9, and settled around the 0.5 Fibonacci retracement level (based on June 3 low to June 11 high).
With such a close, the market signals a strong shift in sentiment. Going ahead, 24800–24768 becomes a critical support zone. Bulls now need to reclaim and close above 25,020 to regain any strength. Until then, bias remains bearish.
🛡 5 Min Chart with Levels
🕯 Daily Time Frame Chart
🕯 Daily Candle Breakdown
Open: 25,164.45
High: 25,196.20
Low: 24,825.90
Close: 24,888.20
Net Change: −253.20 (−1.01%)
📊 Candle Structure Breakdown
Real Body: 276.25 pts → 🔴 Strong Red Candle
Upper Wick: 31.75 pts
Lower Wick: 62.30 pts
🔍 Interpretation
Bears dominated from start to finish, with hardly any resistance from the bulls.
The close near the day’s low reinforces strong bearish sentiment.
The lower wick is minimal — buying interest was absent post-selloff.
🔦 Candle Type
🔥 Bearish Marubozu–like Candle– Reflects powerful downside momentum and strong seller conviction.
📌 Key Insight
The candle wipes out 3 sessions of buildup — textbook bearish breakdown.
Support at 24,820–24,850 is critical. A breakdown from here could invite deeper correction.
Only a close above 25,020 can negate this bearish tone. Otherwise, weakness may persist.
🛡 5 Min Intraday Chart
⚔️ Gladiator Strategy Update
ATR: 252.81
IB Range: 131.4 → Medium IB
Market Structure: Balanced
Trades:✅ 11:10 AM – Short Triggered → Target Achieved, Trailing SL Hit (RR: 1:4.65)
📌 Support & Resistance Zones
Resistance Levels
24,920
24,972 ~ 25,000
25,060 ~ 25,080
25,102
25,125
25,180 ~ 25,212
Support Levels
24,820
24,800 ~ 24,768
24,735 ~ 24,725
24,660
24,640 ~ 24,625
💭 Final Thoughts
With a decisive range breakdown and expiry volatility behind us, the battle zone shifts to 24,800–25,000. Expect more pressure if bulls fail to reclaim 25,020.
🧠 “Markets don’t wait forever at the edge of range—they break, and break hard.”
✏️ Disclaimer
This is just my personal viewpoint. Always consult your financial advisor before taking any action.


Nifty Facing resistnace above 25200 zoneToday Nifty closing above 25141 is a positive sign but it is evidently facing resistnace above 25200 zone. Nifty made a high of 25222 today but could not sustain at those levels and fell but eventually closed in the positive. The daily candle formed is an indecisive Doji.
IT Sector seems to be on the verge of a Reverse Head and Shoulder Breakout. If this breakout happens and Nifty gets support from other heavy weights we can see it growing further.
The resistances for Nifty now are at 25222, 25270 and 25310.
The supports for Nifty are at 25104, 25044, 24977 (Mother line support of Daily chart and 24953 Channel bottom. Things are in balance with shadow of the candle slightly positive.
Disclaimer: The above information is provided for educational purpose, analysis and paper trading only. Please don't treat this as a buy or sell recommendation for the stock or index. The Techno-Funda analysis is based on data that is more than 3 months old. Supports and Resistances are determined by historic past peaks and Valley in the chart. Many other indicators and patterns like EMA, RSI, MACD, Volumes, Fibonacci, parallel channel etc. use historic data which is 3 months or older cyclical points. There is no guarantee they will work in future as markets are highly volatile and swings in prices are also due to macro and micro factors based on actions taken by the company as well as region and global events. Equity investment is subject to risks. I or my clients or family members might have positions in the stocks that we mention in our educational posts. We will not be responsible for any Profit or loss that may occur due to any financial decision taken based on any data provided in this message. Do consult your investment advisor before taking any financial decisions. Stop losses should be an important part of any investment in equity.
Nifty Analysis EOD – June 11, 2025 – Wednesday🟢 Nifty Analysis EOD – June 11, 2025 – Wednesday 🔴
♻️ Déjà vu Day – Bulls Attempt, Bears Resist
For the third consecutive session, Nifty started on a positive note with a 45-point gap-up at 25,134.15, but as has been the pattern lately, early optimism was wiped out instantly, with the index hitting the day’s low of 25,081 within the first 5 minutes.
What followed was a gradual climb as bulls gained some momentum, pushing Nifty to test the 25,200 zone. However, resistance in the 25,200–25,222 band proved too strong. Despite multiple attempts, bulls gave up the level around 13:20, triggering a sharp fall to 25,100.
Post-fall, the market struggled to recover and closed at 25,141.40, up just 37 points from the previous close. It was yet another rangebound, indecisive session, showing that the index is coiling for a potential breakout—but the direction remains uncertain.
🛡 5 Min Chart with Levels
🕯 Daily Time Frame Chart
🕯 Daily Candle Breakdown
Open: 25,134.15
High: 25,222.40
Low: 25,081.30
Close: 25,141.40
Net Change: +37.15 (+0.15%)
📊 Candle Structure Breakdown
Real Body: 7.25 pts → 🟢 Small Green Candle
Upper Wick: 81.00 pts
Lower Wick: 52.85 pts
🔍 Interpretation
Strong intra-day swings in both directions signal high volatility with no control on either side.
Bulls failed at resistance (25,222); bears couldn’t break support (25,081).
The tiny real body with long shadows reflects market indecision.
🔦 Candle Type
⚖️ Spinning Top– Neutral structure with no clear directional conviction.
📌 Key Insight
The market is clearly taking a breather after recent moves.
Watch 25,222 on the upside and 25,080 on the downside — a breakout from either could set the next directional tone.
Bias stays mildly bullish as long as 25,080 holds, but it’s hanging by a thread.
🛡 5 Min Intraday Chart
⚔️ Gladiator Strategy Update
ATR: 239.75
IB Range: 72.9 → Small IB
Market Structure: Balanced
Trades:✅ 10:30 AM – Long Triggered → Target Achieved, Trailing SL Hit (RR: 1:1.65)
📌 Support & Resistance Zones
Resistance Levels
25,116 ~ 25,128
25,180 ~ 25,222
25,285
Support Levels
25,062 ~ 25,070
24,972
24,920 ~ 24,894
24,800 ~ 24,768
💭 Final Thoughts
Market is in a tight tug-of-war. No clear winner yet, but momentum can build quickly once a side gives in.Patience will pay—wait for the range breakout.
🧠 "Pressure builds silently before an explosion—so does the market before a breakout."
✏️ Disclaimer
This is just my personal viewpoint. Always consult your financial advisor before taking any action.

Nifty Analysis EOD – June 10, 2025 – Monday🟢 Nifty Analysis EOD – June 10, 2025 – Monday 🔴
🔄 Fallback From the Top – Another Rangebound Day
Nifty began the session on a bullish note with a Gap-Up of 97 points at 25,199.30, but that turned out to be both the Open and High of the day.
Within the first 20 minutes, the index plunged 144 points, even breaking below the previous day’s low, signaling a swift sentiment shift. However, just a few minutes later, it rebounded sharply and tested the previous day’s high — not surprising, given the narrow range of the prior session.
But after 11:00 AM, the action dried up. The rest of the day saw tight, sideways movement within just 35 points, eventually closing at 25,104.25, barely 1 point above the previous close.
On paper, it looks like a neutral session, but price action reveals weakness and distribution near the top. Bulls need to reclaim control quickly, or the door opens for a short-term dip.
🛡 5 Min Chart with Levels
🕯 Daily Time Frame Chart
🕯 Daily Candle Breakdown
Open: 25,196.05
High: 25,199.30
Low: 25,055.45
Close: 25,104.25
Net Change: +1.05 (0.00%)
📊 Candle Structure Breakdown
Real Body: 91.80 pts → 🔴 Red Candle (Close < Open)
Upper Wick: 3.25 pts (Very Small)
Lower Wick: 48.80 pts
🔍 Interpretation
Price opened at the top, immediately reversed, and closed near the lower end of the day’s range.
Despite the flat close, the intraday structure is weak, showing signs of profit booking or early distribution.
The small upper wick reflects no follow-through buying.
🔦 Candle Type
🟥 Bearish Candle with Long Body and Lower Wick– Often seen during pullbacks or trend pauses.
📌 Key Insight
Support near 25,050–25,070 is critical—if it breaks, expect further downside pressure.
Bulls must reclaim 25,200 to keep the uptrend intact.
🛡 5 Min Intraday Chart
⚔️ Gladiator Strategy Update
ATR: 250.71
IB Range: 143.85 → Medium IB
Market Structure: Balanced
Trades:❌ No Trade Triggered by the system
📌 Support & Resistance Zones
Resistance Levels
25,116 ~ 25,128
25,180 ~ 25,212
25,285
Support Levels
25,062 ~ 25,070
24,972
24,920 ~ 24,894
24,800 ~ 24,768
💭 Final Thoughts
Market is playing inside a box, testing patience on both sides.Expansion is near, but which way? Keep risk defined and emotions in check.
🧠 “Don't mistake silence for weakness. The market is coiling—ready to snap.”
✏️ Disclaimer
This is just my personal viewpoint. Always consult your financial advisor before taking any action.

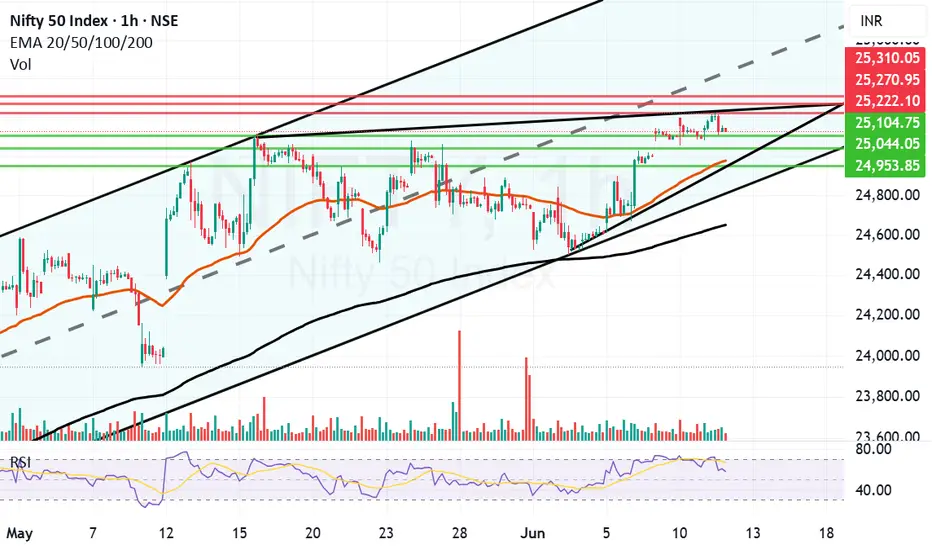
Nifty facing trendline resistance and RSI cooling down. Nifty had come close to overbought zone. Not that it was immensely overbought. It is also facing a trendline resistance which is hampering it's further progress. Bears are trying their best to bring it down while Bulls are trying to pull it above the trend line. The trade is in perfect balance right now. Once during the day Nifty had broken the trendline resistnace too as it made a high of 25199 but could not sustain the levels and was pulled down immediately. 25055 provided support and kept it Flat.
Supports for Nifty now remain at 25052, 24957, 24917 (Mother line of hourly chart), 24846 is another trend line support. Father line support is at 24614. Below this level bears will take over.
Resistances for Nifty remain at 25118, 25199 (Trend line resistance), A closing above 25199 will enable and empower bears as this will be a closing above mid channel resistance too. In such a scenario Bulls can further full Nifty upwards towards 25298 and 25387 levels.
Disclaimer: The above information is provided for educational purpose, analysis and paper trading only. Please don't treat this as a buy or sell recommendation for the stock or index. The Techno-Funda analysis is based on data that is more than 3 months old. Supports and Resistances are determined by historic past peaks and Valley in the chart. Many other indicators and patterns like EMA, RSI, MACD, Volumes, Fibonacci, parallel channel etc. use historic data which is 3 months or older cyclical points. There is no guarantee they will work in future as markets are highly volatile and swings in prices are also due to macro and micro factors based on actions taken by the company as well as region and global events. Equity investment is subject to risks. I or my clients or family members might have positions in the stocks that we mention in our educational posts. We will not be responsible for any Profit or loss that may occur due to any financial decision taken based on any data provided in this message. Do consult your investment advisor before taking any financial decisions. Stop losses should be an important part of any investment in equity.

Nifty Analysis EOD – June 9, 2025 – Monday🟢 Nifty Analysis EOD – June 9, 2025 – Monday 🔴
🎯 Stuck at the Top – Expansion Coming Soon?
Nifty opened with a strong Gap-Up of 127 points at 25,127, landing right at the upper resistance cap. But from the very first candle, it was clear that the market was unsure—price action showed indecision, and the index could barely add another 16 points before hitting the day’s high of 25,143.45.
From there, the index retraced about 66 points, marking a low at 25,077.15, before attempting a gradual recovery toward the high. But that breakout attempt was unsuccessful, and Nifty drifted back to the mean and closed the day at 25,103.20—essentially wrapping the entire session within a tight 65-point range.
Buyers fought hard to defend 25,100, while sellers tried to fill the morning gap. The narrow range and mean reversion hint at consolidation, setting the stage for a possible expansion in the coming sessions. Stay patient—the coil is tightening.
🛡 5 Min Chart with Levels
🕯 Daily Time Frame Chart
🕯 Daily Candle Breakdown
Open: 25,160.10
High: 25,160.10
Low: 25,077.15
Close: 25,103.20
Net Change: +100.15 (+0.40%)
📊 Candle Structure Breakdown
Real Body: 56.90 pts → 🔴 Red candle (Close < Open)
Upper Wick: 0 pts (Open = High)
Lower Wick: 26.05 pts
🔍 Interpretation
Price opened at the high and failed to push any higher – showing no strength above the open.
Despite a positive close versus the previous session, the candle is bearish intraday.
The lower wick shows some support, but not enough to flip the bias.
🔦 Candle Type
🟥 Red Inverted Hammer / Bearish Pin Bar– Typically signals weakness or potential reversal, especially when forming near resistance zones.
📌 Key Insight
The structure shows exhaustion or profit booking.
A move below 25,077 could open the door to further downside.
However, holding above 25,100–25,130 will keep bullish hopes alive.
🛡 5 Min Intraday Chart
⚔️ Gladiator Strategy Update
ATR: 262.59
IB Range: 66.3 → Small IB
Market Structure: imBalanced
Trades:❌ No Trade Triggered by the system
📌 Support & Resistance Zones
Resistance Levels
25,116 ~ 25,128
25,180 ~ 25,212
25,285
Support Levels
25,062 ~ 25,070
24,972
24,920 ~ 24,894
24,800 ~ 24,768
💭 Final Thoughts
Today was a pause, not a pullback—yet.With price compressed in a tight band, volatility expansion is likely ahead.
🧠 “Markets don't stay quiet for long. Silence often precedes a scream—watch which direction the breakout takes.”
✏️ Disclaimer
This is just my personal viewpoint. Always consult your financial advisor before taking any action.

Nifty Daily Trend AnaysisMy Observation:
Nifty Spot had been consolidating within a range for 16 consecutive trading sessions. Today, it broke out decisively and is now trading above that range. If it sustains this breakout, it indicates bullish momentum and the index could potentially rally towards the targets of 25,800 and 26,500.
However, if the market slips back into the previous range, I anticipate support around 24,600—although this scenario seems less likely given the strength of today’s breakout.
Disclaimer: This is purely my personal view and is shared for educational purposes only. Please do your own analysis before making any trading decisions.

Nifty Analysis EOD – June 6, 2025 – Friday🟢 Nifty Analysis EOD – June 6, 2025 – Friday 🔴
🎯 25K Now, What's Next?
Nifty opened on a neutral tone, cautiously awaiting the outcome of the RBI Monetary Policy. As the event unfolded and the repo rate cut of 0.5% was announced, the celebration began on Dalal Street—and the charts reflected it.
What followed was a clean, powerful rally, breaking through key levels and carrying the index all the way to the psychological milestone of 25,000, where it closed almost flat on the round number at 25,003.05.
Today’s close is just shy of the May 26th high, and a few hurdles still remain:👉 25,060–25,070👉 25,115–25,130👉 25,180–25,212
These levels will decide whether the breakout from the box range—which we’ve discussed in earlier reviews—truly sustains. As long as there’s no negative trigger over the weekend, bulls may carry the momentum into next week.
🛡 5 Min Chart with Levels
🕯 Daily Time Frame Chart
🕯 Daily Candle Breakdown
Open: 24,748.70
High: 25,029.50
Low: 24,671.45
Close: 25,003.05
Net Change: +252.15 (+1.02%)
📊 Candle Structure Breakdown
Real Body: 254.35 pts (Strong Green)
Upper Wick: 26.45 pts
Lower Wick: 77.25 pts
🔍 Interpretation
A session that began quietly turned into a bullish sprint.
The small upper wick shows there was minimal rejection at higher levels.
The lower wick reflects early dip buying.
The strong green body signals dominant intraday momentum, with bulls in charge from start to finish.
🔦 Candle Type
🟢 Bullish Marubozu–like candle– Almost a full body with small wicks, indicating powerful follow-through buying and confidence among bulls.
📌 Key Insight
25,000 breakout looks clean and technically sound.
Holding above 24,900–24,950 in the coming session could lead to further upside exploration.
All eyes on volume confirmation and whether we can conquer the next resistance band near 25,130+.
🛡 5 Min Intraday Chart
⚔️ Gladiator Strategy Update
ATR: 274.31
IB Range: 91.90 → Medium IB
Market Structure: Balanced
Trades:✅ 10:05 AM – Long Triggered → Target Achieved (1:1.4)✅ 10:40 AM – Long Triggered → Target Achieved (1:2)
📌 Support & Resistance Zones
Resistance Levels
25,062 ~ 25,070
25,116 ~ 25,128
25,180 ~ 25,212
Support Levels
24,972
24,920 ~ 24,894
24,800 ~ 24,768
24,727 ~ 24,737
24,660
💭 Final Thoughts
Momentum is back.Bulls not only broke free from consolidation—they made a statement. The RBI’s surprise move might just be the fuel Nifty needed to launch toward unexplored zones.
📌 “Big breakouts don’t ask for permission. They just happen—when doubt is highest.”
✏️ Disclaimer
This is just my personal viewpoint. Always consult your financial advisor before taking any action.

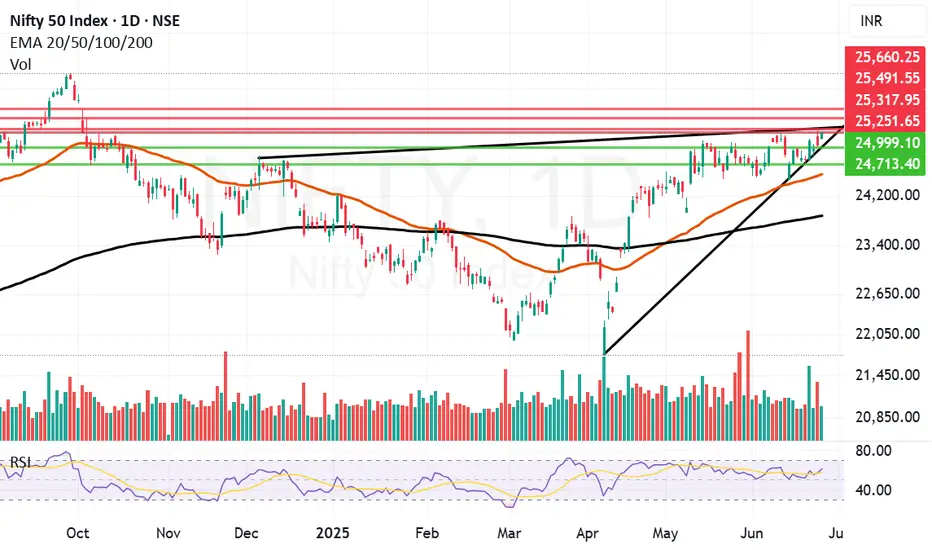
50 bps Repo Rate Cut boosts Nifty. Can it fly further now?The market was expecting a Repo Rate Cut From RBI. The expectation was for 25bps but what we got today from RBI was a bumper 50 bps rate cut. This propelled Nifty to close above much coveted level of 25K as Nifty managed to close at 25003. Now Nifty has entered a critical resistance zone. This zone starts from around 25037 to 25146. Closing above 25146 is mandatory for Nifty to fly further and gain further momentum. Last 4 weeks or so Nifty has been returning back from this zone. We can see this in the weekly chart of Nifty. With rate cut the chances for Nifty to fly above this most important levels has increased a lot.
The resistances for Nifty Now Remain at: 25037, 25146 (Important Trend line Resistance, Bulls will be very active above this level.), 25473, 25804 and 26277. Further levels will be given once we get a closing above 26277.
The supports for Nifty remain at: 24642, 24425, 23904, 23597 (Most important Mother Line of Weekly Candles). Below this level Nifty will become very week again and bears can drag Nifty further down towards 23201 (Important Trend Line Support). If this is broken in unlikely global or local geo-political event then Nifty can further fall to 22169 or even 21671 levels in unlikely scenario of major geo-political event unfolding.
Disclaimer: The above information is provided for educational purpose, analysis and paper trading only. Please don't treat this as a buy or sell recommendation for the stock or index. The Techno-Funda analysis is based on data that is more than 3 months old. Supports and Resistances are determined by historic past peaks and Valley in the chart. Many other indicators and patterns like EMA, RSI, MACD, Volumes, Fibonacci, parallel channel etc. use historic data which is 3 months or older cyclical points. There is no guarantee they will work in future as markets are highly volatile and swings in prices are also due to macro and micro factors based on actions taken by the company as well as region and global events. Equity investment is subject to risks. I or my clients or family members might have positions in the stocks that we mention in our educational posts. We will not be responsible for any Profit or loss that may occur due to any financial decision taken based on any data provided in this message. Do consult your investment advisor before taking any financial decisions. Stop losses should be an important part of any investment in equity.

Nifty Analysis EOD – June 5, 2025 – Thursday🟢 Nifty Analysis EOD – June 5, 2025 – Thursday 🔴
🎭 Trap and Manipulation on Expiry Day
As discussed in yesterday’s note—a calm before the storm—today delivered the volatility, but not in the form anyone truly expected. Nifty opened with a 53-point gap-up, filled the gap in the first 5 minutes, and then marched upwards to hit a day high of 24,761.
But that wasn't the end…
Within just 20 minutes, Nifty spiked to 24,899—a sharp and unexpected move that defied recent technical context. Why?Because just two sessions ago (June 3), the 24,800 level was a clear rejection zone, yet today the price cut through that zone like butter, crossing the highs of the past 6 sessions—only to fall just as sharply.
📉 That’s not strength—it’s classic expiry day manipulation.
The past 16 sessions have shown candles with unusual shadows, and today added another one to the list. For swing traders, this market structure has been offering no clean entry triggers. The message is loud and clear: focus only on intraday setups and stay cautious.
🛡 5 Min Chart with Levels
🕯 Daily Time Frame Chart
🕯 Daily Candle Breakdown
Open: 24,691.20
High: 24,899.85
Low: 24,613.10
Close: 24,750.90
Net Change: +130.70 (+0.53%)
📊 Candle Structure Breakdown
Real Body: 59.70 pts (Green)
Upper Wick: 148.95 pts
Lower Wick: 78.10 pts
🔍 InterpretationThe candle paints a story of early optimism followed by profit booking or supply absorption near 24,900. Though the day closed green, the long upper shadow shows sellers dominating higher levels, leaving buyers with little to celebrate by the close.
🔦 Candle Type
🟢 Green Spinning Top with Long Upper Wick
Indicates indecision, with a bullish undertone that lacks conviction at higher levels.
📌 Key Insight
24,900 remains a psychological and technical barrier.
A bullish close above 24,900 might invite momentum traders, but until then—suspicion stays.
A breakdown below 24,600 may trigger downside interest again.
🛡 5 Min Intraday Chart
⚔️ Gladiator Strategy Update
ATR: 265.01
IB Range: 148.4 → Medium IB
Market Structure: imBalanced
Trades:✅ 11:00 AM – Long Triggered → Target Achieved (1:1.5)✅ 11:50 AM – Long Triggered → Trailing SL Hit, but Target Achieved (1:4.8)
📌 Support & Resistance Zones
Resistance Levels
24,768 ~ 24,800
24,820
24,882
24,894 (Strong Resistance)
Support Levels
24,727 ~ 24,737
24,660
24,625 ~ 24,640
24,600
24,530 ~ 24,480
24,460
💭 Final Thoughts
A day of deception more than direction.This expiry session was less about trend and more about clearing premiums, trapping both sides, and faking strength in the middle of a boxed consolidation.
📌 “Not every green candle is bullish. Some are just well-disguised traps.”
✏️ Disclaimer
This is just my personal viewpoint. Always consult your financial advisor before taking any action.

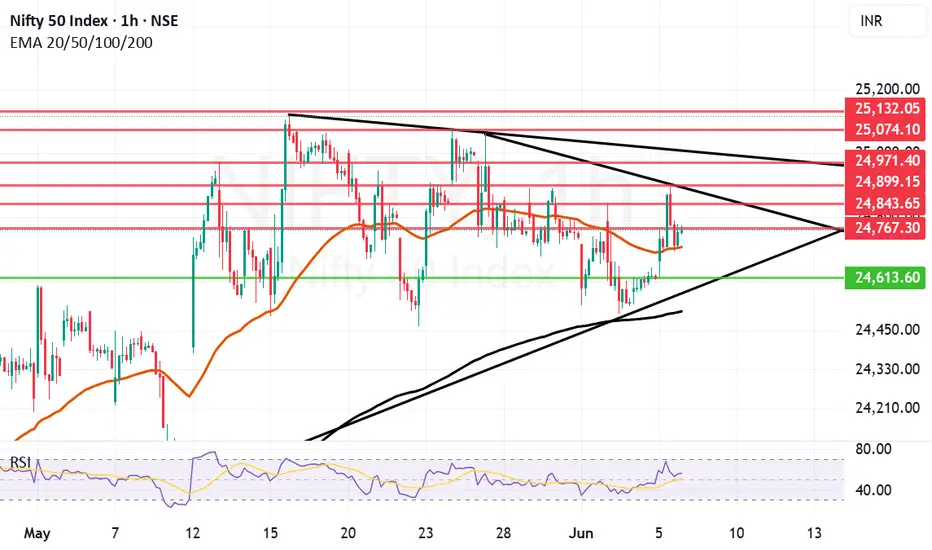
Nifty bounce between Trendline resistance and Mother lineWe Saw a jump of 130 points in Nifty today. The jump could have been higher if trend line resistance would not have come into play. This trend line resistance which came into effect is exactly around 24899 as it can be seen in the chart which was also the day's high. After making this high Nifty fell again until Mother line support present near 24706 again came into act for Nifty to close near 24750.
Thus the supports for Nifty now remain at: 24706 (Mother Line Support), 24613 (Low of today) and Father line Support near 24508. Below 24508 there will be further weakness and Bears will take control of the market.
The Resistances for Nifty now remain at: 24767, 24843, 24899 (trend line resistance), and 24971(Another Trend line resistance). Above 24971 closing Nifty will gain strength again and Bears can pull the market upwards towards 25074 or 25132. Closing above 25132 will be very good for the market as there seems to be a pure Bull territory above this zone.
Disclaimer: The above information is provided for educational purpose, analysis and paper trading only. Please don't treat this as a buy or sell recommendation for the stock or index. The Techno-Funda analysis is based on data that is more than 3 months old. Supports and Resistances are determined by historic past peaks and Valley in the chart. Many other indicators and patterns like EMA, RSI, MACD, Volumes, Fibonacci, parallel channel etc. use historic data which is 3 months or older cyclical points. There is no guarantee they will work in future as markets are highly volatile and swings in prices are also due to macro and micro factors based on actions taken by the company as well as region and global events. Equity investment is subject to risks. I or my clients or family members might have positions in the stocks that we mention in our educational posts. We will not be responsible for any Profit or loss that may occur due to any financial decision taken based on any data provided in this message. Do consult your investment advisor before taking any financial decisions. Stop losses should be an important part of any investment in equity.