NIFTY RISING WEDGE PATTERNHello
Welcome to this analysis about NIFTY , we are looking at daily timeframe perspectives. NIFTY in recent times heavily increased with Bullishness however it now moved into an overbought condition. NIFTY is developing here that will be a decisive factor in the upcoming times. I discovered the main formation NIFTY is developing here that will be a decisive factor in the upcoming times. As when looking at my chart now we can watch there how NIFTY has emerged with this key NIFTY RISING WEDGE PATTERN marked in my chart with the black boundaries. NIFTY is near support region which is an important support and also psychological resistance-mark together with the upper-boundary of the RISING WEDGE PATTERN a pullback
In this manner, thank you for watching my update-analysis about NIFTY and its major RISING WEDGE PATTERN with the determining factors we need to consider in upcoming times, support the analysis with a like and follow or comment for more market insight!
Niftyshort

Nifty50 Prediction & Analysis [30 Aug 2021]Nifty Prediction and Trade Setup for 30 Aug 2021
Long Setup:
Case 1:
Buy Nifty if it stays above 16725 for some time and breaks out of the range for a Target of 16750 followed by 16815
Case 2:
Buy Nifty if it stays and consolidate near 16630 for some time and breaks out of the range for a Target of 16675
Short Setup:
Short Nifty if it stays below 16675 for some time and breaks out of the range for a Target of 16625

Nifty50 Prediction & Analysis [11 Aug 2021]Nifty50 Prediction and Analysis For Tomorrow
Nifty50 Spot Levels to watch out for trading on 10th Aug 2021
Long Opportunity:
1. Price breaks out of 16300 and retests the level again is good support to go long
Short Opportunity:
1. Gap down opens below 16200 and stays below 16200 for some time and retested back the 16200 levels is a good resistance zone to short Bank Nifty.

BERGER PAINT SHORT JULY FUTUREBERGER PAINT SHORT JULY FUTURE 800 PUT PE BUY JULY BEFORE BUY SELL MUST CONFIRM
HOLD OR PROFIT BOOK
9872412530

NIFTY WILL TEST 15300Historically NIFTY showed possitive clossing for many years, what about this june? Is it different?
YES.... Read my simple EW chart with NW timing.
It is obvious from the chart , when to take long or short ,with targets. (The power of EW forecasting)
Happy Trading!!


NIFTY CLIMAX RALLY TO 16000With all odds absorbed NIFTY will make its landmark figure 16000 on 10/06/21
It is a simple ABC correction with C=1.62*A
nifty will hold this level for day long so ,the TRADE PLAN is
take LONG today (09/06/21)for profiting long calls.
take SHORT tomorrow after 3.15 pm(10/06/21)and keep it for 3 days for 15450 levels

Nifty Deep Crab Harmonic PatternNifty is forming Deep Crab in 1 Hour and 2 Hour and pattern is confirmed.
It is still not bearish at the moment therefore, please wait for some signs of weakness.
Per Scott Carney (Harmonic Trader) , SL for Deep crab should be around FIb level 2 of XA Leg.
Other possible levels are 2.618 FIB Extension of BC Leg and 1.618 FIB derived from trend based FIB from ABC Swing. (Pl note that this 1.618 FIB is not prescribed level per harmonic trader books and strategies. This is based on my experience and learning.
Again, right now it is not at all weak, Let is show some signs of weakness, like RSI sliding down, Bearish Div. on RSI, bearish candlestick pattern, bearish price action patterns etc.

Nifty Short There is a RSI Divergence as can be seen in the chart. RSI is showing a down trend but nifty is at same level. Consider shorting and target shall be 14900 level.The decrease in volume as shown by decreasing height of green candles also strengthens the above argument of mine.
Target - 14930 to 14900
Stoploss - 15160.

NIFTY AND BANKNIFTY LEVELS, 20 MAY 2021, TRADE SETUPIn this video we discuss about DEMAND AND SUPPLY ZONES in nifty and bank nifty.
DISCLAIMER:-
I AM NOT A SEBI REGISTERED FINANCIAL ADVISER.*
ALL MY VIDEOS AND RECOMMENDATION ARE ONLY FOR EDUCATIONAL AND MOTIVATIONAL PURPOSE. PLEASE DON'T TAKE RISK ON YOUR HARD EARN MONEY ON THE BASIS OF MY RECOMMENDATION AND VIDEOS.
MUST TAKE ADVICE FROM YOUR FINANCIAL ADVISER BEFORE PUTTING REAL MONEY INTO STOCK MARKET.

NIFTY 13155 ALMOST ALL TRADERS LOST THEIR MONEY IN THIS BEAR TRAP,
REASON; FII selling in cash is ignored, blue colour numbers are long/short positions
15000CE writters burnt their fingers YESTERDAY, 14700PE writters today.
NOW the bears took control till 17 th may upto 13155( ''C''Wave begins)
Ride on right side
Happy trading

NIfty view for 6th April Sell On Rise
Disclaimer: We are not SEBI registered analysts.All information/calls posted here are for educational purpose only.

SHORT NIFTY NEXT WEEK FOR 14500c4 wave should take the nifty to 14912 on monday(5th April)where upper hands unload their longs and add shorts
Let us be on that side ,we do take shorts for a while
targets given
enjoy trading
B.selvam, Neowave analyst

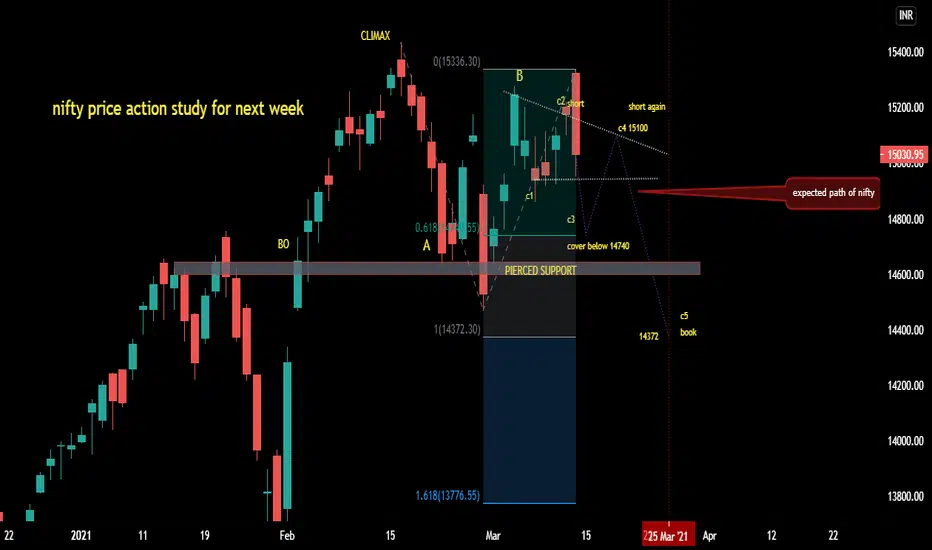
NIFTY IN DISTRIBUTION STAGEWave 'C' emerged as a DISTRIBUTION patten(FLAT) unlike SHARP REVERSAL(ZIGZAG).
Here you have 5 good opertunities for both long and shorts( as we PA traders like to trade both sides)
Blue line is expected path of NIFTY next week (approximatelly).
It is normal to have a FLAT pattern after a CLIMAX rally where more YOUNG traders rushing to 'BUY' the shits of MONKEY's
NIFTY REVERSAL TRAJECTORYAS we fix the path of rocket by calculating velocity and time , I tried my level best to project the path of NIFTY with PA analysis .

Nifty Buy / Sell Based on FIBO and GANN IntradaySell nifty 14815
Stop loss 14845
Target 14670 - 14590

Be careful Bulls Nifty is trading at a strong FIB Resistance level. be careful bulls out there.
(1) 1.618 FIB from Feb-2020 High
(2) 2.618 as a FIB projection
(3) Tredline Resistance
(4) RSI Divergence (Price higher high RSI lower high)
Can it go high from this reange- yes it can, but it must break 15275-15300 with strong buying force and close above it
Path of least Resistance is downards.
Can it crash like Covid-19" - I dont think so, this is running correction for now until it breaches some major support. We will see when we reach there.
Low Risk Short is on 4 Sure, Sl is 15310
Short at CMP with Possible target of 15k and 14800 k, this is swing short.


Nifty, What are you trying to say us ?Nifty current level look Bearish but its possible that can break the levels and move upward
.
.
.
thanks
god bless you all
have a profitable week a head

Nifty 50 viewNifty is looks like negative after a double top formation and quick fall. We can see RSI diversion too. Just like before March crash see in monthly chart.

Nifty Buy / Sell Based on FIBO and GANNAs per my analysis Nifty in on sell on positional view
Sell at 13770
Stop Loss 13905
Target 13010
Target 12400
Have a happy and prosperous new year 2021

Double top formed! Will Nifty reverse it's trend?After having a bull run for a while, Nifty has finally formed a double top pattern. If the next session breaks the previous day high, it can rally upto 13700. If Nifty fail to cross the mark, there are chances it might consolidate.
Disclaimer: These are my personal views. I have drawn the chart in such a simple manner for the beginners to understand. I don't recommend anyone taking trades blindly. Please analyze yourself before you enter a trade.

