AMBUJA CEMENT FOR SWINGA Good opportunity in Ambuja Cement for swing trade, weekly resistance break and retesting, so add in your watchlist.
Niftytradesetup

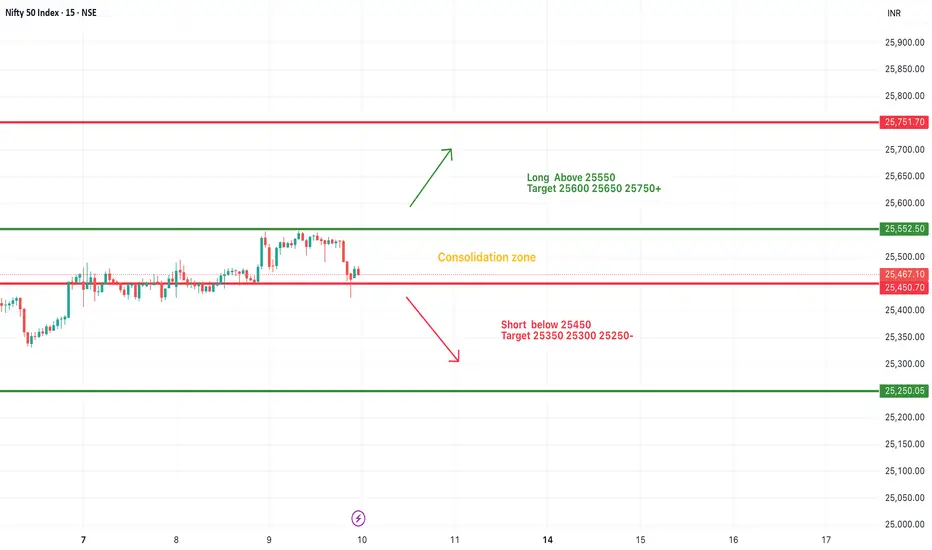
#NIFTY Intraday Support and Resistance Levels - 10/07/2025Nifty is also expected to open flat today, reflecting a similar consolidation pattern observed in recent sessions. The index continues to trade within a tight range, signaling indecisiveness among traders and lack of strong directional momentum.
Currently, Nifty is oscillating in a consolidation zone between 25550 resistance and 25450 support. A breakout above 25550 could trigger fresh long entries, with potential upside targets at 25600, 25650, and 25750+. Sustained strength above 25750 may open the way for extended bullish movement.
Conversely, a breakdown below the 25450 level may lead to short opportunities, with downside targets at 25350, 25300, and 25250-.
Until the index decisively breaks out of this range, sideways movement is likely to persist. Traders should wait for confirmation before taking aggressive directional positions.
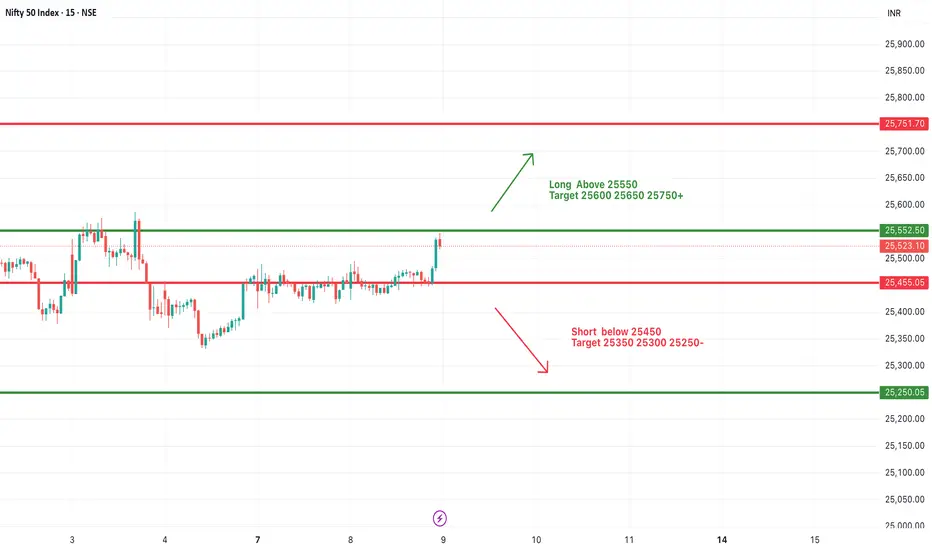
#NIFTY Intraday Support and Resistance Levels - 09/07/2025Nifty is expected to open slightly gap up around the 25500–25520 zone, showing positive momentum from the previous day’s breakout above its recent consolidation range. If the index sustains above the 25550 level, we can expect bullish continuation toward the upside targets of 25600, 25650, and 25750+ levels. This zone may act as an intraday breakout trigger.
On the downside, 25450 will now act as immediate support. Any sharp move below 25450 could invite selling pressure, and we may see a downside slide toward 25350, 25300, and 25250-. The trend remains mildly bullish above 25550, while below 25450 the trend may turn weak intraday.
#NIFTY Intraday Support and Resistance Levels - 08/07/2025Nifty is expected to open flat with no major change in the overall levels compared to the previous session. The index continues to hover near a crucial resistance zone around 25450–25500. A breakout above 25550 will indicate bullish strength and may lead to an upward move toward 25600, 25650, and even 25750+. This zone has been tested multiple times, and a decisive break can attract further buying.
On the downside, the support remains at 25450. A break below this level can invite selling pressure, with immediate targets at 25350, 25300, and 25250-. The market is clearly respecting this consolidation band, so any directional move will depend on a confirmed breakout or breakdown from these levels.
Traders should remain cautious and avoid early entries unless a clean move is seen beyond the 25550 or below the 25450 levels.

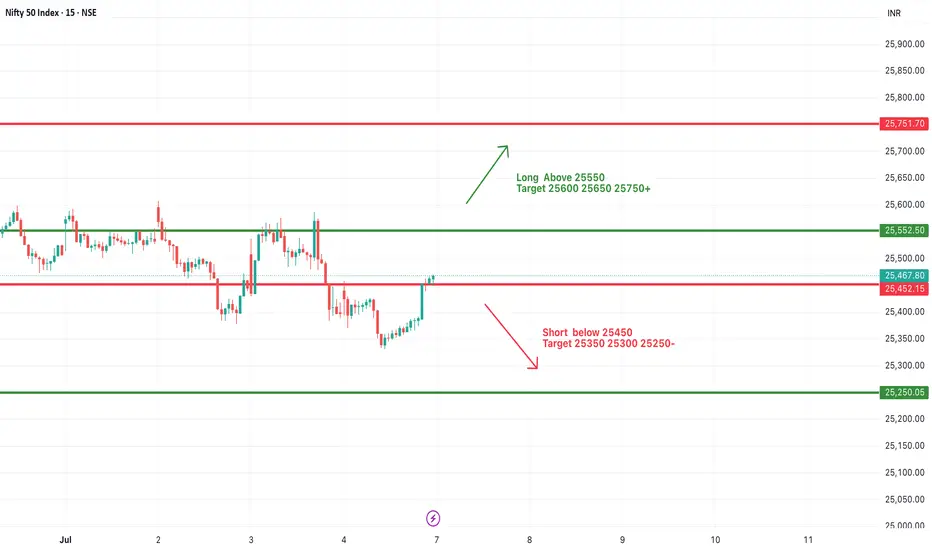
#NIFTY Intraday Support and Resistance Levels - 07/07/2025Nifty is expected to open flat near the 25450–25500 zone, which lies close to an important decision area. If Nifty manages to sustain above the 25550 level, we can expect bullish momentum to resume with upside targets of 25600, 25650, and possibly 25750+. This level marks a potential breakout zone, and holding above it could bring back buyers’ interest.
On the downside, a breakdown below 25450 may trigger fresh selling pressure, leading to downside targets of 25350, 25300, and 25250. The 25450 level has acted as both a support and resistance in recent sessions, making it a key pivot point for intraday direction.
Traders should be patient and wait for a clear breakout or breakdown above or below these levels. Volatility may be witnessed around the opening range, so it's advisable to trade with strict stop losses and manage risk through partial profit booking near targets.
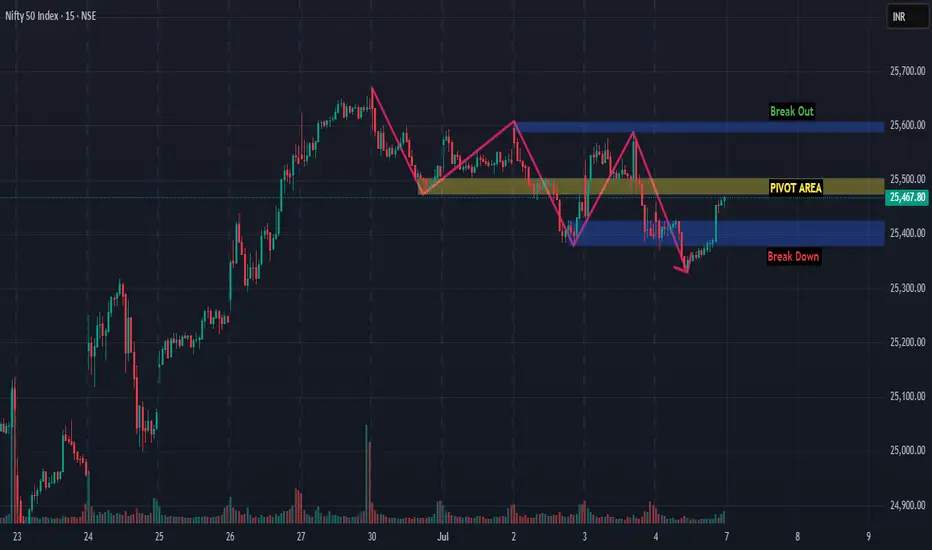
NIFTY ANALYSIS FOR 07-11/07 WEEKThis analysis based on purely zigzag drawing. As per drawing we can see nifty is still in a rangebound position but this phase is important.
from a neutral zone if we can make position with proper analysis and risk management then Break out or Break Down anything happen we can enjoy the ride.
I would like to encourage you just practice the simple drawing. Practice a lot.
On the basis of opening on Monday we can analyze further, till then learn and enjoy weekend.
Thanks for reading. 🙏
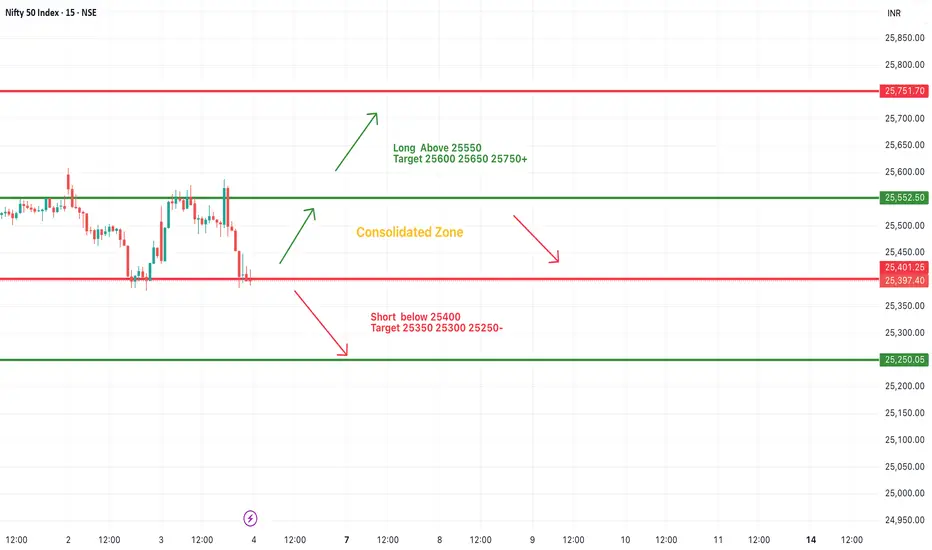
#NIFTY Intraday Support and Resistance Levels - 04/07/2025Nifty is expected to open with a gap-up near the 25500 zone. This places it right around the consolidation zone seen in the previous sessions, between 25400 and 25550. If Nifty sustains above 25550, it may trigger a fresh upward move with immediate targets at 25600, 25650, and potentially 25750+. This breakout level should be watched closely for bullish confirmation before entering long positions.
However, if the index fails to hold above the consolidation zone and slips below 25400, it could open the door for a downside move. A short opportunity may arise below 25400, targeting levels at 25350, 25300, and 25250. This would indicate a breakdown from the consolidation and suggest renewed selling pressure.
Traders should remain cautious within the consolidation range and act only on confirmed breakout or breakdown levels.
#NIFTY Intraday Support and Resistance Levels - 03/07/2025Nifty is expected to open flat near the 25,450 level, continuing to trade within a consolidation zone. The market has recently shown signs of indecisiveness, with price movement confined between 25,550 resistance and 25,250 support. Until a clear breakout or breakdown occurs, price action may remain range-bound.
If Nifty sustains above the 25,550 level, it can trigger fresh momentum toward 25,600, 25,650, and even 25,750+. On the downside, if it breaks and trades below 25,450, we may see selling pressure accelerating toward 25,350, 25,300, and 25,250.

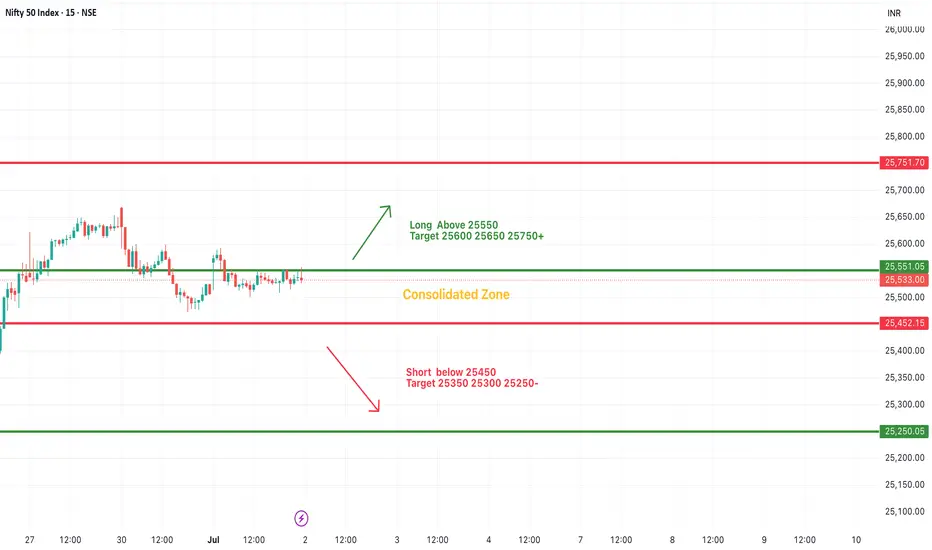
#NIFTY Intraday Support and Resistance Levels - 02/07/2025Nifty is expected to open flat near the 25,530 level, right in the middle of the consolidation zone between 25,450 and 25,550. This range has acted as a tight resistance and support band in recent sessions, indicating indecision in the market. A breakout above 25,550 can trigger bullish momentum toward 25,600, 25,650, and even 25,750+ levels, while staying within this zone may continue the sideways trend.
On the downside, if Nifty breaks below the 25,450 level, we may see selling pressure taking it toward 25,350, 25,300, or even 25,250. Traders are advised to wait for a clear breakout from this consolidation band before entering directional trades, and maintain proper risk management given the tight range and potential volatility
#NIFTY Intraday Support and Resistance Levels - 01/07/2025Nifty is expected to open with a slight gap up near the 25,550 level, which lies close to a minor resistance zone. If the index manages to sustain above this region, we may see a continuation of bullish momentum with potential upside levels at 25,600, 25,650, and 25,700. Holding above 25,550 would signal strength, supported by recent recovery attempts from lower levels.
However, if the index fails to hold above 25,550 and starts slipping below 25,450, weakness may creep in. A fall below 25,450 could open the door for downside targets of 25,350, 25,300, and possibly 25,250. Traders should stay cautious around the 25,550–25,600 zone for a clear directional move, with strict stop losses on both sides.

NIFTY Short Term View <25650-25200>If you follow my other ideas, I think you are gaining trust on the tool ZZ. Please don't blindly follow me and my posts. I just want to make you curios that one tool with clear idea is enough to predict the market. But condition is you have to practice a ton.
Here I am sharing just glimpse of it, there are so many things to do with ZZ.
Keep learning || Trust analysis || Keep Trading & Investing
Any question or suggestion please feel free to comment below.

NIFTY THIS WEEK? What's the plan
"There’s more hidden in a candle chart than most headlines will ever reveal.”
If you look at this NIFTY chart casually, you’ll see just another uptrend. But if you feel the price — really look into the structure — you’ll notice something deeper:
We’re not just in a rally. We’re in a breakout after base-building. And that’s a very different game.
What I Noticed This Week:
1. Strong Follow-Through
NIFTY didn’t just pop — it’s sustaining gains. Each green candle is following the next without hesitation. That means institutions are buying, not just retailers reacting.
2. Previous Resistance = Gone
Look back at 25,200–25,300. That zone rejected price multiple times. Now? It’s broken clean, with a bullish Marubozu-style candle. That’s a confirmation, not just a fluke.
3. No Panic Selling Yet
Usually, breakouts invite profit booking. This one? Sellers are quiet. When there's no rejection at new highs, it tells you confidence is strong.
But Here’s What You Must Watch:
Are we near psychological exhaustion? Markets can get euphoric and overextend - even in strong trends. Volume Spike or Divergence? If volumes dry or RSI starts diverging, stay alert.
Global cues & Bank Nifty:
If Bank Nifty stalls, NIFTY will slow too. Watch correlation.
What This Means for You:
Trend is strong, but smart traders plan exits in upmoves - not panic in downmoves.
Ask yourself:
Do you have entries based on structure?
Are you overexposed at highs, hoping for more?
Are you following momentum blindly or with plan?
Personal Reflection:
I’ve learned this the hard way:
“Buying strength is good. But riding strength without a stop loss is just greed in disguise.”
So this week:
Observe, don’t chase.
Track - don’t blindly enter.
There’s always another breakout. But there’s only one portfolio.

NIFTY OVERVIEWGet to know something from Manish Bhai that happened in the past. Now, compared to the current market, this is what the market is looking for.

#NIFTY Intraday Support and Resistance Levels - 27/06/2025Nifty is expected to open with a strong gap up near the 25,750 level, indicating bullish sentiment continuation from the previous sessions. If Nifty sustains above this 25,750 mark, it could trigger a breakout setup. In that case, long positions can be considered above 25,750 with targets placed at 25,850, 25,900, and 25,950+. This zone aligns with a potential resistance-turned-breakout level, and a move beyond it could bring in further momentum on the upside.
On the other hand, if Nifty fails to hold above the 25,750 level and shows signs of rejection, then it may consolidate or experience mild profit booking. Key intraday support lies near the 25,550–25,600 range. A break below this can drag the index down to 25,450 or even 25,250.

#NIFTY Intraday Support and Resistance Levels - 25/06/2025Nifty is expected to open with a gap-up near the 25,250 level, signaling early bullish strength. If the index sustains above the 25,250–25,300 zone after opening, we could see a continuation of the upward momentum toward the next resistance levels at 25,350, 25,400, and possibly 25,450+. However, if it fails to hold above 25,250 and slips back into the 25,100–25,050 zone, there could be selling pressure. A break below 25,050 may drag Nifty further down to 24,950. If 24,950 breaks, then a short trade could trigger, with targets at 24,850, 24,800, and 24,750. The key levels to watch today are 25,250 on the upside and 24,950 on the downside.

#NIFTY Intraday Support and Resistance Levels - 24/06/2025Today, Nifty is expected to open with a gap-up near the 25,250 level. This level is crucial, as a sustained move above it can trigger a strong upside rally. If Nifty manages to hold above 25,250, we may see targets of 25,350, 25,400, and even 25,450+ in the coming sessions. On the downside, if the index slips below 24,950, it could lead to a corrective move toward 24,850, 24,800, and potentially 24,750 zones.
Traders should closely watch the 25,050–25,100 range for intraday strength, and the 24,950 mark as immediate support. Any breakout or breakdown from these levels will offer direction for the day. Maintain strict stop-loss and consider trailing profits as levels get tested.

#NIFTY Intraday Support and Resistance Levels - 23/06/2025A flat opening is expected in Nifty today. If Nifty sustains above the 25,050–25,100 zone after the open, we can expect an upside rally toward 25,150 → 25,200 → 25,250+ levels. This bullish momentum may continue if Nifty remains strong above 25,100.
However, any downside momentum may begin if Nifty starts trading below 24,950, which is a crucial support zone. In such a scenario, the index could slip toward 24,850 → 24,800 → 24,750- levels.
For intraday trades, focus on breakout or breakdown levels, and manage risk with trailing stop-losses in place.

Bajaj finance for Swing Bajaj finance is good looking for swing,
Small sl, and good support,
Add in your watchlist.

#NIFTY Intraday Support and Resistance Levels - 20/06/2025A flat opening is expected in Nifty today. After the open, all eyes will be on the 24,700 level, which has acted as a key support zone recently.
🔽 If Nifty starts trading below 24,700, downside momentum may pick up, with potential targets at 24,650 → 24,600 → 24,550-. Sustained weakness below 24,700 could attract short positions.
🔼 On the upside, if Nifty reclaims 24,750–24,800 and sustains, a bullish move may trigger toward 24,850 → 24,900 → 24,950+. However, 24,950 remains a strong resistance area from the past sessions.
⚠️ Strategy Note:
Market remains in a range-bound zone; wait for a decisive breakout for positional trades.
Use strict stop-losses and manage risk actively.
Ideal approach: scalp the range with quick profit booking unless a directional move confirms.

Nifty Analysis EOD – June 19, 2025 – Thursday🟢 Nifty Analysis EOD – June 19, 2025 – Thursday 🔴
📉 Bookish Spinning Top Doji – Another Day of Indecision on Expiry
Nifty opened with a mild +16-point gap-up and immediately dipped to test the Previous Day Low (PDL), marking the day low at 24,738.10. A quick reversal took the index 125 points higher, reaching a high of 24,863, only to settle back into theta-eating mode around VWAP.
Just as things looked ready to turn, a 13:50 breakout attempt fizzled as the price faced rejection above the CPR zone, leading to a final dip below the previous low, touching a new intraday low at 24,733.
Though the intraday close was at 24,744.70, the settlement close was 24,793.25 — a 47.65-point difference that’s not trivial, especially on expiry day.
The entire day remained a narrow-range, rollercoaster ride — clearly showing neither bulls nor bears could take charge. The total range was just 130 points, forming a textbook Spinning Top, which reflects market contraction.
📌 Now what?
Keep a close eye on the range:
🟢Bullish Breakout ➤ above 24,862 (CDH)
🔴Bearish Breakdown ➤ below 24,733 (CDL)
The squeeze is on. Expansion is near.
🕯 5 Min Time Frame Chart with Levels
🕯 Daily Time Frame Chart
🕯 Daily Candle Breakdown
Open: 24,803.25
High: 24,863.10
Low: 24,733.40
Close: 24,793.25
Change: −18.80 (−0.08%)
📊 Candle Structure Breakdown
Real Body: 10.00 pts → 🔻 Small Red Candle
Upper Wick: 59.85 pts
Lower Wick: 59.85 pts
🔍 Interpretation
Equal wicks show balanced buying and selling.
Small real body signals strong indecision.
Intraday volatility was neutral despite expiry impact.
🕯 Candle Type
⚖️ Perfect Spinning Top / Doji-like Candle – Indicates market contraction, waiting for directional resolution.
📌 Key Insight
The market continues its tight range-bound structure.
Any breakout beyond 24,865 or breakdown below 24,730 could trigger directional moves.
Till then: “Wait and watch mode.”
🛡 5 Min Intraday Chart
⚔️ Gladiator Strategy Update
ATR: 240.08
IB Range: 125.00 → Medium IB
Market Structure: ⚖️ Balanced
Trades:🚫 No Trade Triggered by System
📌 Support & Resistance Zones
Resistance Levels
24,894 ~ 24,882
24,972 ~ 25,000
25,060 ~ 25,080
25,102 ~ 25,125
Support Levels
24,825 ~ 24,847
24,725 ~ 24,735
24,660
24,590
💭 Final Thoughts
The market is compressing like a coiled spring.Spinning tops near resistance often signal upcoming volatility.Let the breakout come to you — don’t pre-empt, participate.
🧠 “When the market sleeps in narrow ranges, it dreams of big moves.”
✏️ Disclaimer
This is just my personal viewpoint. Always consult your financial advisor before taking any action.

Nifty 50 Trapped in a Tight Range – Breakout or Breakdown Ahead?📍 Market Overview:
For over a month now, the Nifty 50 Index has been moving sideways in a tight consolidation range, frustrating both bulls and bears. Since May 12, 2025, the index has fluctuated between 24,350 on the lower side and 25,250 on the upper side, forming a classic rectangular pattern often associated with accumulation or distribution phases.
This zone is now becoming a crucial battlefield that could define the index’s direction for the coming sessions.
🔲 The Consolidation Zone
Support Zone: 24,350 – 24,450
Resistance Zone: 25,150 – 25,250
Consolidation Duration: ~30+ days
Current Price: 24,793.25
This range has seen multiple rejections at the top and bottom, reflecting indecisiveness in broader market sentiment. Traders are waiting for a trigger — either fundamental or technical — that could push the index out of this range with strength.
📈 Bullish Scenario: Breakout Above 25,350
If Nifty 50 breaks and sustains above 25,350, especially with higher volume and a strong daily close, it could signal a bullish continuation pattern. This scenario would be supported by:
A potential breakout from the rectangle consolidation.
Positive sentiment from global markets or domestic catalysts (monsoon, earnings, policy announcements, etc.)
A shift in FII or DII buying behavior.
📌 Breakout Target:
👉 26,000 – 26,100 (Based on measured move projection)
📌 Next Resistance Zone:
👉 26,050 – 26,200
In this case, traders may look for long opportunities with trailing stop-losses under the breakout zone.
📉 Bearish Scenario: Breakdown Below 24,350
On the flip side, a decisive breakdown below the 24,350 mark, especially with increased selling pressure and bearish candles, may lead to a quick decline toward the next major support levels.
📌 Breakdown Target:
👉 23,550 – 23,400
📌 Next Support Zone:
👉 23,500 – 23,300
This could trigger panic selling or profit-booking in frontline stocks. Caution is advised in such scenarios, and shorting opportunities may arise for experienced traders.
🧠 Strategic Insights for Traders
Avoid trading within the range: Unless you're scalping, wait for breakout/breakdown.
Watch global cues and FII flows: They often align with large breakouts.
Stick to risk management: Whichever direction the index moves, always set a stop loss.
🚀 Final Thoughts
The market is clearly in a wait-and-watch phase, but such consolidation periods often precede large moves. Nifty’s current structure suggests a breakout or breakdown is imminent — and being positioned correctly can make a big difference in returns.
Stay alert. Don’t predict — prepare.
⚠️ Disclaimer
This article is for educational and informational purposes only and does not constitute financial advice or a recommendation to buy or sell any securities. Trading and investing in the stock market involve risk, including the risk of losing capital. Always conduct your own research or consult with a qualified financial advisor before making any trading decisions. We are not responsible for any losses incurred from decisions based on this analysis.

#NIFTY Intraday Support and Resistance Levels - 19/06/2025Today, a flat opening is expected in Nifty around the 24,800 level. The index continues to trade within a narrow range, indicating market indecision and potential consolidation.
🔼 On the upside, if Nifty sustains above the 24,750–24,800 zone, it may trigger a bullish move toward 24,850 → 24,900 → 24,950+. Sustained strength above 24,950 can further open room for a breakout.
🔽 On the downside, if the index slips below 24,700, a short opportunity may arise toward 24,650 → 24,600 → 24,550-. Breach of 24,550 could lead to deeper correction.
⚠️ Key Notes:
The market is likely to remain range-bound and volatile.
Reversals from resistance and support levels are possible.
Trade with a strict stop loss and manage positions actively.

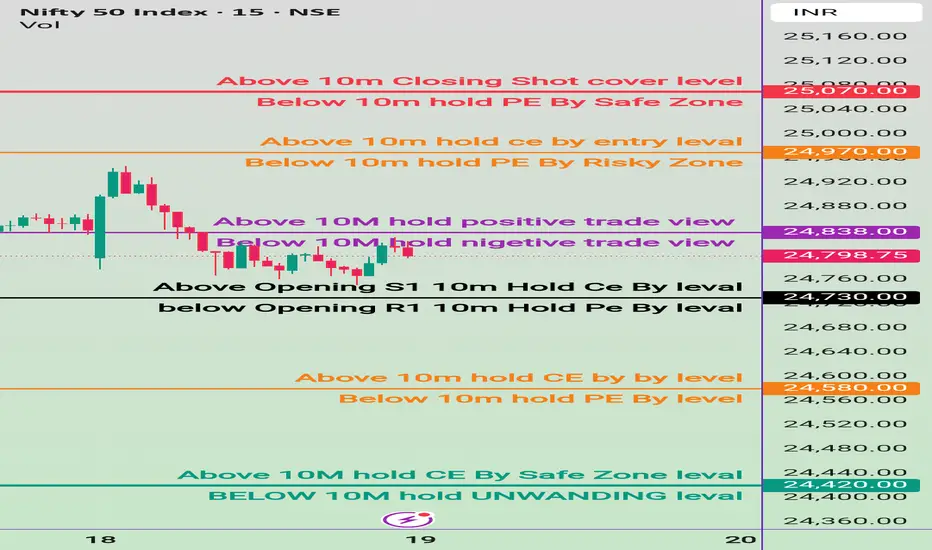
19 june Nifty50 brekout and Breakdown leval
✅ Safe Buy Zone (Support Levels):
24,437.70 → Above 10M: Hold CE by Safe Zone Level
24,420.00 → Below 10M: Hold Unwinding Level
→ Breach below could trigger unwinding / profit booking.
🔴 Resistance & Bearish PE Zones:
25,070.00 – Above 10m closing: Short Cover Level
→ Strong resistance; if crossed and sustained, short covering possible.
24,970.00 – Above 10m: Hold CE by Entry Level
→ Bullish entry confirmation level.
24,838.00 – Above 10M: Hold Positive Trade View
→ Indicates shift to bullish bias if held above.
⚫ Opening Based Levels:
24,730.00
→ Above Opening S1: Hold CE by Level
Below Opening R1 (level not clearly marked with value but appears near 24,730)
→ Hold PE by Level