#NIFTY Intraday Support and Resistance Levels - 22/04/2025Today slightly gap up opening expected in nifty. After opening if nifty starts trading above 24250 level then expected further bullish rally upto 24500+ level in today's session. 24000-24200 level will act as a consolidation zone for today's session. Any major downside only expected below 24000 level.
Niftytradesetup

#NIFTY Intraday Support and Resistance Levels - 21/04/2025Today will be flat opening expected in nifty. After opening 23850 will act as a resistance for today's session. If nifty starts trading below this resistance level then expected downside upto 23600 support level. Strong bullish rally expected in nifty if it's started trading above 23900 level. This upside bullish rally can goes upto 24200+ level in today's session.

Decoding NIFTYDear Traders,
I hope this message finds you well in your trading endeavours and personal pursuits. I am excited to share a compelling opportunity with you through a new NIFTY analysis that sheds light on the continuation of the market shift.
Preliminary Analysis Overview:
The downtrend from all-time highs has reached approximately 65% of its progression.
The recent upward surge is somewhat concerning due to concerns about a new trend or a correction within a correction in a larger degree (downtrend).
Let us discuss the key points to distinguish between these two scenarios:
The second leg of the downtrend is experiencing a correction, having completed approximately 89/90 days (which reinforces the interim trend’s completion).
The current correction is progressing rapidly, exhibiting limited sub-waves, which is typically not a characteristic of a motive wave (especially at the beginning of a trend).
The accompanying chart illustrates this point.
Let us elucidate the reasons behind this assertion:
Reason I:
As a staunch believer and ardent follower of Master WDG , the significance of time cannot be disregarded.
The primary downtrend commenced on September 27, 2024, and is poised to encounter a pivotal juncture, namely 180 days from its commencement on March 25, 2025 (Tuesday). This date also coincides with a cross-over with the Fibonacci value of 21 from March 4, 2025, where the interim correction commenced (21,964.60).
The 180D is a component of both the tetragram and the hexagram, and it also represents the midway point of a complete circle (360).
There is also another weird correlation, 4th MAR’25 & 25th MAR’25 both falls on Tuesday marking initiation & termination, the same day.
Reason II:
The geometric patterns of preceding and ongoing movements further support this analysis.
Analyzed both on a daily and weekly basis. The correction responded favorably to both Fibonacci retracements and trendlines. Upcoming resistance levels include:
RI: 23,590~23,600
RII:23,653 (23.6% of the downtrend)
RIII: 23,807
The previous support level is acting as a crucial resistance.
I also observe that there will not be a positive close in 3M charts.
Reference:
Important Dates to Remember:
As suggested, March 25, 2025, marks a significant juncture in the overall trend.
This is pure technical based analysis & does not involve any economic data releases other factors.
** Final Verdict: **
The market is anticipated to conclude its final leg of the downtrend, commencing from this Tuesday. However, the duration of this leg can range from 1 to 2 months.
I have identified several crucial dates for monitoring the upcoming trend. Stay informed!
**Strategy:**
Given the prevailing market conditions, adopting a bearish stance appears prudent.
Any sell positions executed after 23,550 will yield positive returns.
While it may seem counterintuitive to deviate from the prevailing trend, I am merely adhering to the established rules (without expressing any personal sentiment). However, it is inherently risky. Therefore, it is imperative to implement robust risk management strategies during such high-risk trades that are significantly influencing the market.
Additionally, please exercise caution regarding option buying. The low volatility environment is concerning, but it is anticipated to normalize as the downtrend progresses.
Fellow Traders,
The creation of this valuable analytical resource has required countless hours of dedication and effort. If you find it useful, I humbly request your support by boosting the idea and following me (updates will be provided via this post, new posts, and through minds). Your comments and thoughts on this idea are highly valued, and I am committed to engaging with each one personally.
Thank you for investing your time in reading this article.
Wishing you profitable and fulfilling trading endeavors!
Disclaimer:
Before concluding, I must emphasize that the insights shared are based on my analysis. It is crucial for you to conduct your own research and, if necessary, consult with a financial advisor before making any trading decisions. The dynamic nature of financial markets necessitates that your strategies align with your financial objectives and risk tolerance.

Nifty Futures intraday analysis for April 17, 2025As explained yesterday, I foresee a bearish trend and the support1 zone at 23358 and Support 2 is at 23313. A breakout below 23313 will bring the Nifty Futures down to 23237. Our Market Timing indicator is in line to our analysis.
This is just my view for the day. Traders must use their own technical study before entering into trades. Stop-Loss is a must for every trade.

#NIFTY Intraday Support and Resistance Levels - 17/04/2025Slightly gap down expected in nifty. After opening if nifty sustain above 23300 level then expected nifty will consolidated between 23300 to 23500 level in today's session. Any strong rally in index only expected breakout of this level. Strong upside rally expected if nifty starts trading above 23500 level in today's session.

17 April Nifty50 trading zone #15 April Nifty50 trading zone
#Nifty50 #Toady #NIFTYBANK #options
99% working trading plan
👉Gap up open 23481 above & 15m hold after positive trade target 23612, 23888
👉Gap up open 23481 below 15 m not break upside after nigetive trade target 23380
👉Gap down open 23380 above 15m hold after positive trade target 23481, 23612
👉Gap down open 23380 below 15 m not break upside after nigetive trade target 23238,
💫big gapdown open 23238 above hold 1st positive trade view
💫big Gapup opening 23612 below nigetive trade view
📌 Trade plan for education purpose I'm not responsible your trade
More education following me

#NIFTY Intraday Support and Resistance Levels - 16/04/2025Today will be slightly gap up opening expected in nifty. After opening if nifty sustain above 23300 level then possible upside rally upto 23500 in opening session. This rally can be expected for further 200+ points in case nifty gives breakout and starts trading above 23550 level. Any major downside only expected below 23250 level.

Nifty Futures Daily Trend AnalysisNifty Futures has been in an uptrend since closing above the SSL level at 23,018. The MastersCycleSignal indicator is currently acting as resistance at 23,460. A breakout above this level could open the path toward the next resistance at 23,801.
The Future Candle Reversal Projection indicator highlights potential upcoming intraday opportunities that contrast with the intraday trend of the day prior to the reversal. This is my personal view and shared for educational purposes only. Please conduct your own technical analysis and always trade with a stop-loss.

15 April Nifty50 trading zone live update 23418 above positive trade view
23192 below nigetive trade view
Target on check chart

#NIFTY Intraday Support and Resistance Levels - 15/04/2025Nifty will open gap up in today's session. Expected opening above 23050 level. After opening if it's sustain above this level then possible short upside rally upto 23300+ level in opening session. 23300 level will act as an immediate resistance. Expected reversal from this level. Any further upside rally only possible above this level. Major downside expected if nifty starts trading below 23000 level in today's session.

NIFTY Futures | Liquidity Sweep + Bullish Structure Shift NIFTY Futures (15min) – Technical Analysis using SMC | ICT | Price Action
1. Price took liquidity below 22,405, sweeping sell-side stops — a common smart money move
before reversing.
2. A clear market structure shift occurred as price broke previous swing highs after the liquidity
grab.
3. Price is currently reacting from a bullish order block between 22,440 – 22,480, showing signs
of accumulation.
4. The entry aligns with ICT’s Optimal Trade Entry (OTE) zone near the 61.8% Fibonacci
retracement level.
5. Price was consolidating in a tight range (5min) and has now started breaking out to the
upside.
6. There is a visible imbalance / fair value gaps between 22,760 – 22,920 that price may look to
fill.
7. Immediate targets are:
- 22,760 (start of imbalance)
- 22,920 (buy-side liquidity above recent highs)
- 23,250 (clean inefficiency zone)
- 23,310 (major resistance / previous high)
8. The setup becomes invalid if price breaks and closes below 22,405 — that’s the stop-loss level.
Thanks for your time..

#NIFTY Intraday Support and Resistance Levels - 11/04/2025Gap up opening near 23000 level expected in nifty. After opening if nifty starts trading above 23050 level then expected further upside rally upto 23250+ level in opening session. Downside 22800 level will act as a strong support for today's session. Any major downside rally only expected if nifty not sustain above level and starts trading below 22750 level.

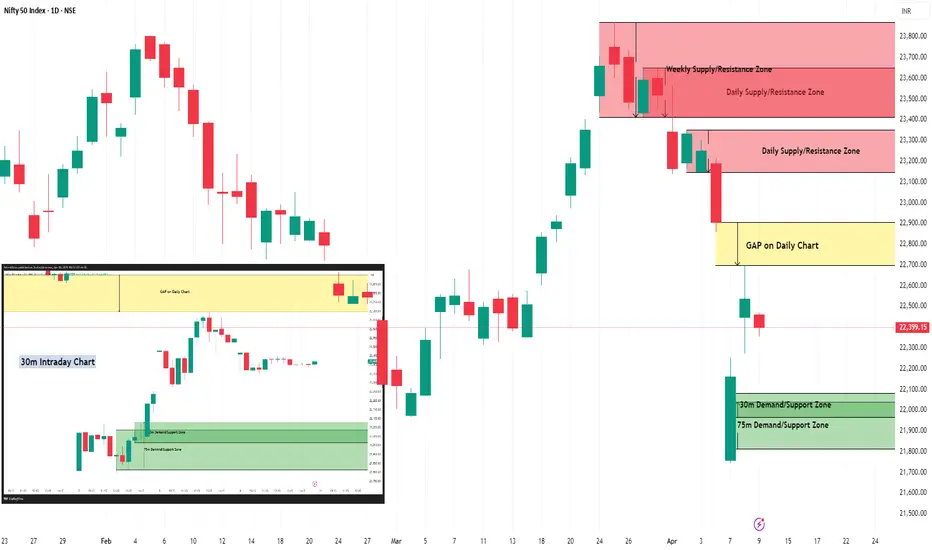
Nifty Intraday Support & Resistance Levels for 11.04.2025🔄 Recap since last update (21.03.2025):
Nifty rallied to a high of 23,869.60 on 25th March, right into the Weekly Supply Zone highlighted earlier — and then the storm hit. Triggered by Trump’s tariff announcements, Nifty crashed over 2,000 points in just 8 sessions, bottoming out at 21,743.65 on 7th April.
🌍 Global markets have since remained highly volatile. Interestingly, Dow Futures have bounced back 4,000 points (10%) from their lows and are now hovering around 40,700 (while writing this).
⚠️ With the looming Trade War, expect continued volatility across global and Indian markets. Be nimble and cautious.
📅 On Wednesday (Weekly Expiry):
Nifty opened gap-down, moved in a tight range between 22,468.70 and 22,353.25, and closed at 22,399.15, down 137 points from the previous session.
🔹 Trend Analysis:
Weekly Trend (50 SMA): Sideways
Daily Trend (50 SMA): Sideways
📉 Demand/Support Zones
Near Support (30m): 21,964.85 – 22,080.85
Near Demand/Support (75m): 21,814.35 – 22,037.80
Far Support: 21,281.45 (Low of 4th June 2024)
Far Demand/Support (Daily): 20,769.50 – 20,950
📈 Supply/Resistance Zones
Near Supply (Gap Zone - Daily): 22,697.20 – 22,904.45
Far Supply (Daily): 23,145.80 – 23,350
Far Supply (Daily): 23,412.20 – 23,649.20 (Inside Weekly Supply)
Far Supply (Weekly): 23,412.20 – 23,869.60
Far Supply (Weekly): 24,180.80 – 24,792.30
🔍 Outlook:
Nifty has shown signs of stabilization post the sharp fall, but the presence of a Daily Gap Zone at 22,697 – 22,904 will be the first hurdle for bulls. If this gets cleared with volume, we could see a climb toward 23,145–23,350.
However, global uncertainties and overhead supply zones suggest a sell-on-rise approach may be more appropriate in the short term. Stay agile and manage risk diligently.
📢 Disclaimer: This analysis is for educational purposes only and not investment advice. Please do your own research or consult a financial advisor before making trading decisions.
Nifty Daily view on Friday (April 11, 2025)According to my analysis, the Nifty is still bearish on a daily basis. However, I foresee an opportunity in the bullish signals on April 11, 2025. Since I am considering the gaps on the either direction, traders should follow technical analysis before entering into trades.

#NIFTY Intraday Support and Resistance Levels - 09/04/2025Today will be slightly gap down opening expected in nifty. After opening if nifty starts trading below 22450 level then possible sharp downside rally in index upto 22250 level. 22250 will act as a strong support for today's session. Any major downside in index expected below this support level. Upside rally expected if nifty starts trading and sustain above the 22550 level in today's session

Nifty’s Make-or-Break Zone: Will Bulls Charge or Bears Bite?www.tradingview.com
---
### 🧠 **1. Context at-a-glance**
- Recent bounce from a **Demand Zone (D1 Key Level)** around **21,800**.
- Strong bullish rally into a **Supply Zone (~22,600–22,750)**.
- Price is currently showing **hesitation within this resistance**, with smaller-bodied candles forming → potential reversal signals.
- The oscillator has **crossed bullish** from oversold but is nearing a decision zone.
---
### 🔮 **Future Move Scenarios**
#### 🟥 SCENARIO A: **Rejection from Supply Zone** (Most Likely Short-Term)
- **Why?** Price has hit a resistance with fading momentum and no breakout confirmation.
- **What happens?**
- Price retraces toward **22,200**, potentially even **21,800–21,900**.
- Retest of BOS level possible before the next directional leg.
- **Watch for:** Bearish candle formations (engulfing / long wicks), oscillator stalling below 50.
---
#### 🟩 SCENARIO B: **Bullish Breakout Above 22,750**
- **What confirms it?**
- A strong bullish candle closing above 22,750 with follow-through.
- **Next Targets:**
- 🔼 **23,000** (round level and minor resistance)
- 🔼 **23,300–23,500** (old supply zone)
- Eventually back to **23,750+**
- **Oscillator support:** If the indicator crosses 50+, bullish momentum could sustain.
---
### 📉 Oscillator Hints:
- Still below 50 — **recovery in progress**, not full momentum yet.
- If price rejects and oscillator drops → **Bearish divergence** possibility.
---
### 🧭 **Your Playbook**
| Zone | Action Idea | Trigger to Watch |
|------------------|-------------------------------|----------------------------------|
| 22,600–22,750 | Short / Hedge | Rejection candle, loss of momentum |
| 22,200–22,300 | Potential buy zone (aggressive) | Bullish candle or bounce confirmation |
| Break > 22,750 | Buy on Retest or Momentum | Breakout candle + volume |
| < 21,800 | Bearish continuation | Break of demand zone + close below |
---

#NIFTY Intraday Support and Resistance Levels - 08/04/2025Gap up opening in nifty. After opening if nifty sustain above 22500 level then possible upside move upto 22750+ level in opening session. 22750 level will act a strong resistance expected reversal from this level. If nifty starts trading below 22400 then possible sharp downside rally upto 22050 in today's session.

#NIFTY Intraday Support and Resistance Levels - 07/04/2025Strong gap down opening expected in nifty near 22050 level. After opening if nifty sustain above 22050 level and gives reversal then expected some correction rally upto 22450 level. This level will act as a strong resistance for today's session. Any bullish side rally can reverse from this level. Downside in case nifty gives breakdown of 22000 level and starts trading below 21950 then expected sharp downside upto 21550 level in today's session.

Nifty Futures intraday trend analysis on April 7th & 8thAccording to my Trend Analysis, on 7th Nifty Futures is likely to bounce back and the raise will not sustain on April 8th. The levels provided in the chart are calculated without taking Gaps into account. In the first 15mts on 7th April, there is a bullish candle formation. Trade with Stop-Loss.

Nifty Chart DevelopmentA beautiful Inverse Head & Shoulder pattern under formation on the daily chart of Nifty 50.
The support level stands in the range 22600-22800.
Do your own research before taking any financial decision.

TIME TO BUY NIFTY AGAIN!! NIFTY SEEMS POSITIVEHello All!!
I am back with totally different opinion on Nifty Futures, I had checked with Media and some published articles, most of all are Bearish On Nifty for coming day!!
But I don't think so.......
Today on 04-04-2025, Nifty is negative by more than -1.5%.
I think it is very right time to buy Nifty!!
Nifty futures CMP:22950.00
Nifty has beached its valuable support at 23,270.00
Now, Nifty's next big support is at 22,930.00
RSI is just above it's 40 Mark level!!
If RSI manages to hold that 40 Mark level, Nifty is going to switch it's direction and start moving upwards.
Simple terms: Risk to Reward ratio is most favorable at current market price.
So, if Nifty holds 22,930.00 level and RSI holds it's 40 Mark level, Bulls are back in market.
Target: 24,000.00 with in this month.
Stoploss: Mange as per your risk tolerance capacity.
Let's hope for the best!!
Be cautious, Market is teaching us something which is not so often!!
Note: This is just my attempt to Analyze Nifty chart, I don't recommend any one to trade or invest based on this study. This is just of educational purpose.

Nifty Futures Intraday analysis for April 04, 2025Trend is bearish. These are the support levels if the bearish trend will continue for the day.
Trade with Stop Loss

#NIFTY Intraday Support and Resistance Levels - 04/04/2025Gap down opening expected in nifty near 23200 level. After opening if nifty starts trading below this level then possible strong downside upto 23000 level in opening session. Currently consolidated movements in nifty. If nifty sustain above 23250 level then possible upside movement upto 23450 level. For today's session 23450 level will act as a strong resistance for index.
