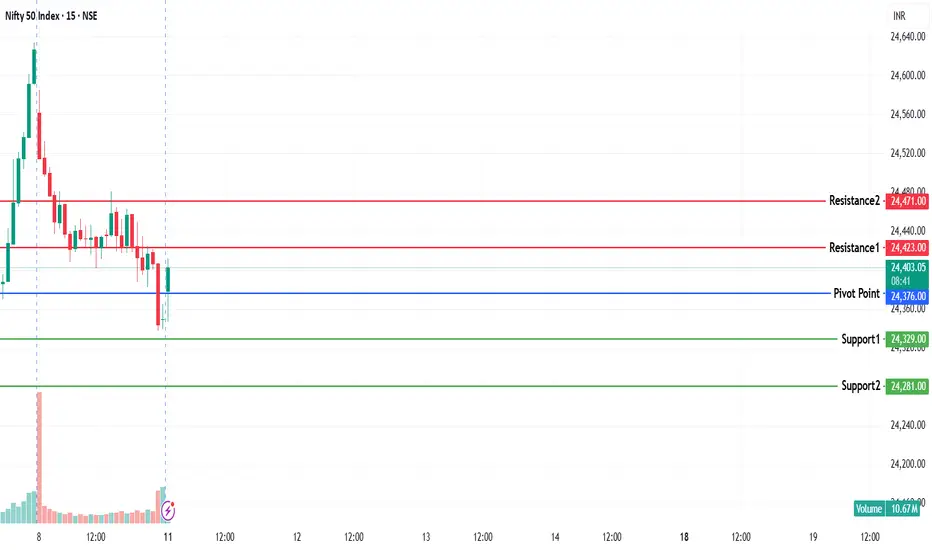
NIFTY KEY LEVELS FOR 11.08.2025NIFTY KEY LEVELS FOR 11.08.2025
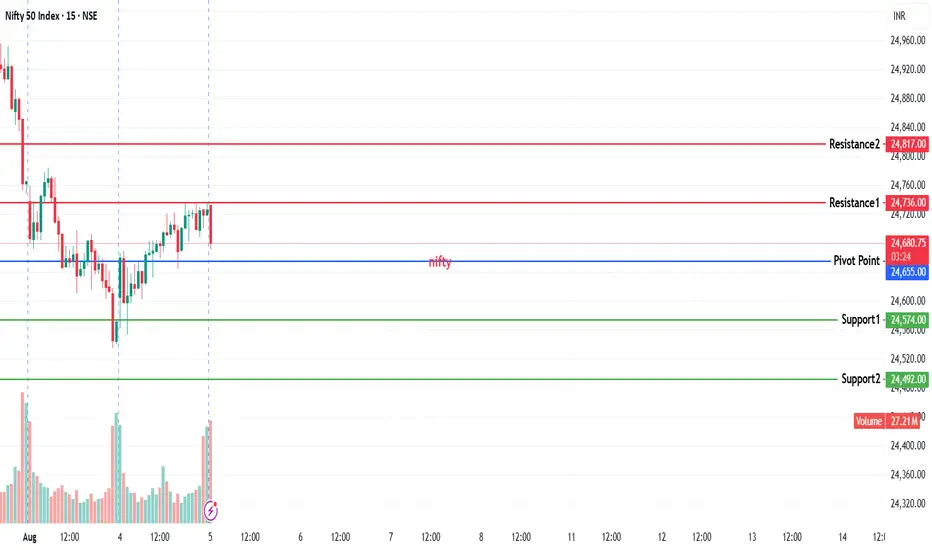
If the candle stays above the pivot point, it is considered a bullish bias; if it remains below, it indicates a bearish bias. Price may reverse near Resistance 1 or Support 1. If it moves further, the next potential reversal zone is near Resistance 2 or Support 2. If these levels are also broken, we can expect the trend.
If the range(R2-S2) is narrow, the market may become volatile or trend strongly. If the range is wide, the market is more likely to remain sideways
📢 Disclaimer
I am not a SEBI-registered financial adviser.
The information, views, and ideas shared here are purely for educational and informational purposes only. They are not intended as investment advice or a recommendation to buy, sell, or hold any financial instruments.
Please consult with your SEBI-registered financial advisor before making any trading or investment decisions.
Trading and investing in the stock market involves risk, and you should do your own research and analysis. You are solely responsible for any decisions made based on this research.
Niftytrendanalysis
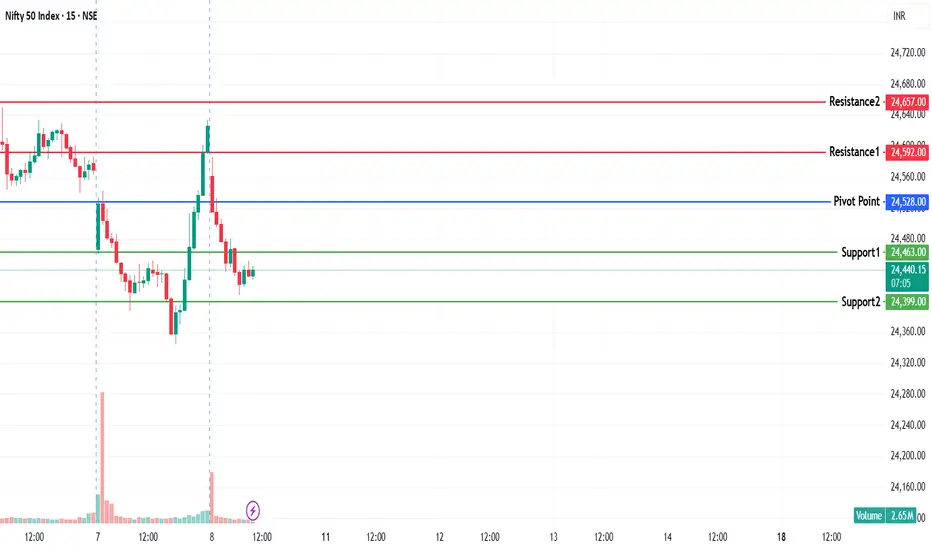
NIFTY KEY LEVELS FOR 08.08.2025NIFTY KEY LEVELS FOR 08.08.2025
Apologies for the delay in sharing this..
If the candle stays above the pivot point, it is considered a bullish bias; if it remains below, it indicates a bearish bias. Price may reverse near Resistance 1 or Support 1. If it moves further, the next potential reversal zone is near Resistance 2 or Support 2. If these levels are also broken, we can expect the trend.
If the range(R2-S2) is narrow, the market may become volatile or trend strongly. If the range is wide, the market is more likely to remain sideways
📢 Disclaimer
I am not a SEBI-registered financial adviser.
The information, views, and ideas shared here are purely for educational and informational purposes only. They are not intended as investment advice or a recommendation to buy, sell, or hold any financial instruments.
Please consult with your SEBI-registered financial advisor before making any trading or investment decisions.
Trading and investing in the stock market involves risk, and you should do your own research and analysis. You are solely responsible for any decisions made based on this research.
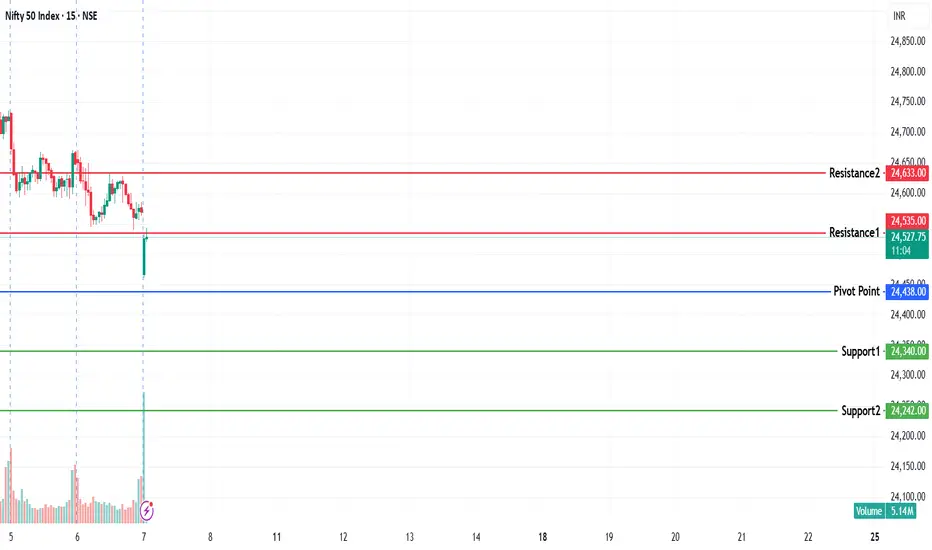
NIFTY KEY LEVELS FOR 07.08.2025NIFTY KEY LEVELS FOR 07.08.2025
If the candle stays above the pivot point, it is considered a bullish bias; if it remains below, it indicates a bearish bias. Price may reverse near Resistance 1 or Support 1. If it moves further, the next potential reversal zone is near Resistance 2 or Support 2. If these levels are also broken, we can expect the trend.
If the range(R2-S2) is narrow, the market may become volatile or trend strongly. If the range is wide, the market is more likely to remain sideways
📢 Disclaimer
I am not a SEBI-registered financial adviser.
The information, views, and ideas shared here are purely for educational and informational purposes only. They are not intended as investment advice or a recommendation to buy, sell, or hold any financial instruments.
Please consult with your SEBI-registered financial advisor before making any trading or investment decisions.
Trading and investing in the stock market involves risk, and you should do your own research and analysis. You are solely responsible for any decisions made based on this research.
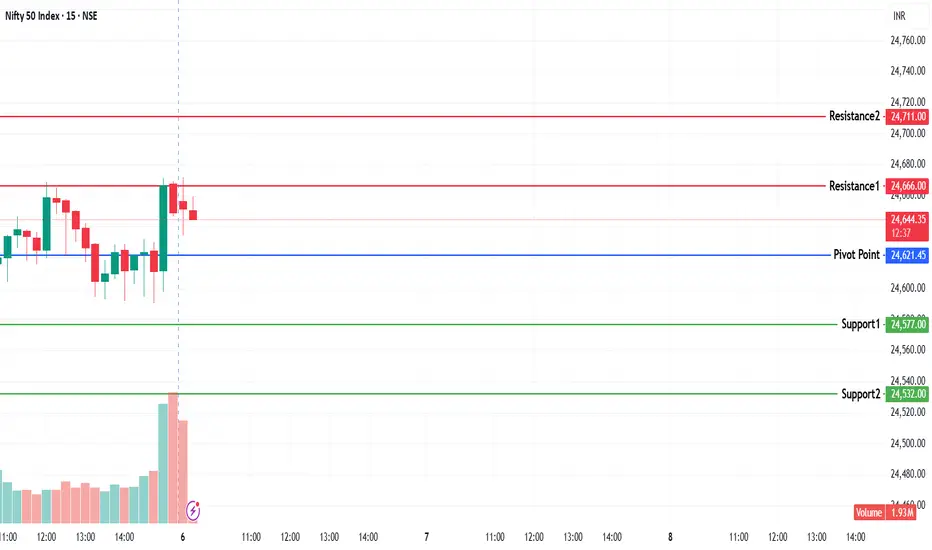
NIFTY KEY LEVELS FOR 06.08.2025NIFTY KEY LEVELS FOR 06.08.2025
If the candle stays above the pivot point, it is considered a bullish bias; if it remains below, it indicates a bearish bias. Price may reverse near Resistance 1 or Support 1. If it moves further, the next potential reversal zone is near Resistance 2 or Support 2. If these levels are also broken, we can expect the trend.
If the range(R2-S2) is narrow, the market may become volatile or trend strongly. If the range is wide, the market is more likely to remain sideways
📢 Disclaimer
I am not a SEBI-registered financial adviser.
The information, views, and ideas shared here are purely for educational and informational purposes only. They are not intended as investment advice or a recommendation to buy, sell, or hold any financial instruments.
Please consult with your SEBI-registered financial advisor before making any trading or investment decisions.
Trading and investing in the stock market involves risk, and you should do your own research and analysis. You are solely responsible for any decisions made based on this research.
Targets Achieved in NIFTY 50 THE RESULT
Follow for more Simple And accurate swing analysis on Indices, Currency, Commodities.

NIFTY KEY LEVELS FOR 05.08.2025NIFTY KEY LEVELS FOR 05.08.2025
If the candle stays above the pivot point, it is considered a bullish bias; if it remains below, it indicates a bearish bias. Price may reverse near Resistance 1 or Support 1. If it moves further, the next potential reversal zone is near Resistance 2 or Support 2. If these levels are also broken, we can expect the trend.
If the range(R2-S2) is narrow, the market may become volatile or trend strongly. If the range is wide, the market is more likely to remain sideways
📢 Disclaimer
I am not a SEBI-registered financial adviser.
The information, views, and ideas shared here are purely for educational and informational purposes only. They are not intended as investment advice or a recommendation to buy, sell, or hold any financial instruments.
Please consult with your SEBI-registered financial advisor before making any trading or investment decisions.
Trading and investing in the stock market involves risk, and you should do your own research and analysis. You are solely responsible for any decisions made based on this research.
Good comeback candle by Nifty today. Nifty fought back against the Tariff odds today and gained 157.4 points. The combination of Friday's candle and today's candle are forming a Bullish Harami kind of pattern. Harami in Japanese means pregnant woman. Usually this is a Bullish pattern but it requires a follow up positive candle in its support. So if we get a positive candle tomorrow then we can consider Friday's low as a good temporary support.
Supports for Nifty currently remain at: 24482 (Important Trend line resistance), 24317, 24186 (Father line support on daily chart), The zone between 23932 (final support, below this level Bears can take total control of the index).
Resistances for Nifty currently remain at: 24802, 24906 (Mother line resistance on daily chart), 25007, 25249-25346 (Important trend line resistance zone, a closing above 25346 will give control of the index to Bulls).
Disclaimer: The above information is provided for educational purpose, analysis and paper trading only. Please don't treat this as a buy or sell recommendation for the stock or index. The Techno-Funda analysis is based on data that is more than 3 months old. Supports and Resistances are determined by historic past peaks and Valley in the chart. Many other indicators and patterns like EMA, RSI, MACD, Volumes, Fibonacci, parallel channel etc. use historic data which is 3 months or older cyclical points. There is no guarantee they will work in future as markets are highly volatile and swings in prices are also due to macro and micro factors based on actions taken by the company as well as region and global events. Equity investment is subject to risks. I or my clients or family members might have positions in the stocks that we mention in our educational posts. We will not be responsible for any Profit or loss that may occur due to any financial decision taken based on any data provided in this message. Do consult your investment advisor before taking any financial decisions. Stop losses should be an important part of any investment in equity.

NIFTY KEY LEVELS FOR 04.08.2025NIFTY KEY LEVELS FOR 04.08.2025
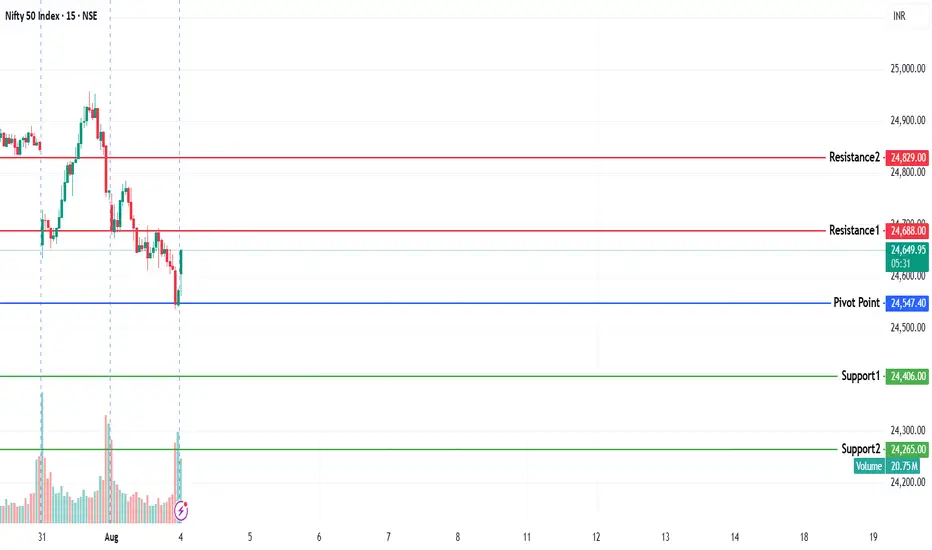
If the candle stays above the pivot point, it is considered a bullish bias; if it remains below, it indicates a bearish bias. Price may reverse near Resistance 1 or Support 1. If it moves further, the next potential reversal zone is near Resistance 2 or Support 2. If these levels are also broken, we can expect the trend.
If the range(R2-S2) is narrow, the market may become volatile or trend strongly. If the range is wide, the market is more likely to remain sideways
📢 Disclaimer
I am not a SEBI-registered financial adviser.
The information, views, and ideas shared here are purely for educational and informational purposes only. They are not intended as investment advice or a recommendation to buy, sell, or hold any financial instruments.
Please consult with your SEBI-registered financial advisor before making any trading or investment decisions.
Trading and investing in the stock market involves risk, and you should do your own research and analysis. You are solely responsible for any decisions made based on this research.
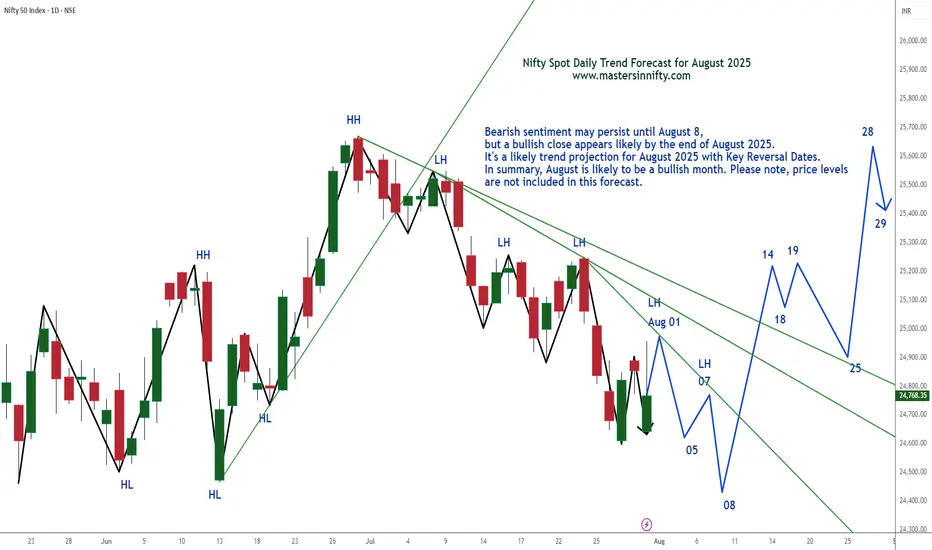
Nifty Spot Index Projection Line for August 2025Bearish sentiment may persist until August 8, but a bullish close appears likely by the end of August 2025.
It's a likely trend projection for August 2025 with Key Reversal Dates. In summary, August is likely to be a bullish month. Please note, price levels are not included in this forecast.
Traders are suggested to conduct own technical studies before entering into the trades and proper risk management is a must.
This is just my personal view.
Best of Luck & Happy Trading.
Nifty Chart📉 Nifty Technical Outlook – Bearish Bias with Macro Overhang
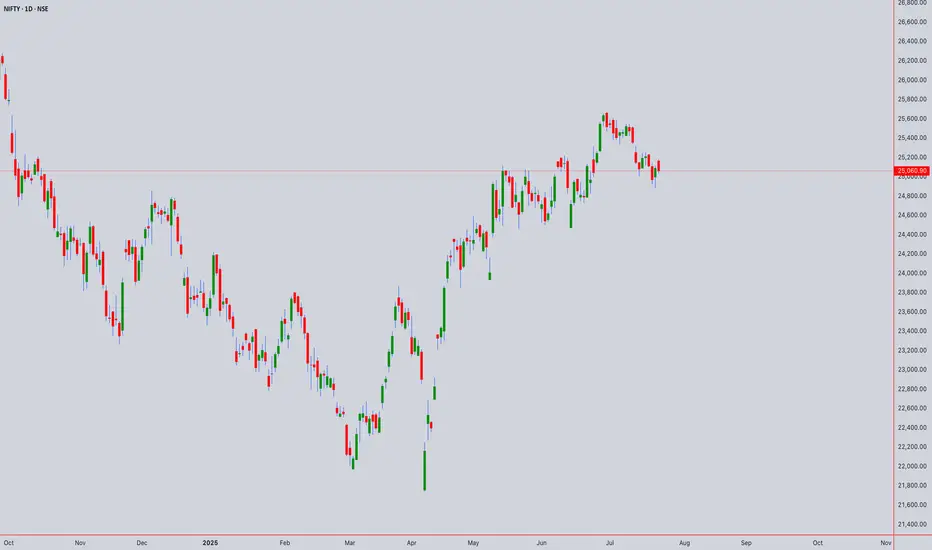
Nifty continues to show bearish momentum, having taken strong resistance near the 25450–25800 zone, which aligns with the runaway gap on the daily chart and the 78.6% Fibonacci retracement level from the recent decline.
On the short-term chart, a Head and Shoulder breakdown has already occurred, followed by a retest, which supports the ongoing weak sentiment.
In addition to technical factors, India–US trade talks are currently in focus. Uncertainty around tariffs, tech cooperation, and strategic agreements may keep market participants cautious in the near term. Any negative development could add to downside pressure, while a breakthrough might limit losses.
🔻 Key Technical Levels:
Major Resistance: 25450–25800 (Runaway Gap + Fibo 78.6%)
Immediate Support: 24200 (short-term support zone)
Next Support: 23700 (historical support level)
As long as Nifty stays below 25450, the trend remains bearish, with potential downside toward 24150–24200 and further to 23700, depending on trade talk developments and market sentiment.
📝 Note: This analysis is intended only for study and educational purposes. Please consult a qualified advisor before making any investment decisions. Market behavior is subject to change based on news, global trends, and macroeconomic factors.

Comprehensive Technical Analysis: NIFTY50 ₹25060.90 as of 22/07Long-Term (Monthly/Weekly) - SWING PERSPECTIVE
Trend & Structure:
Elliott Wave:
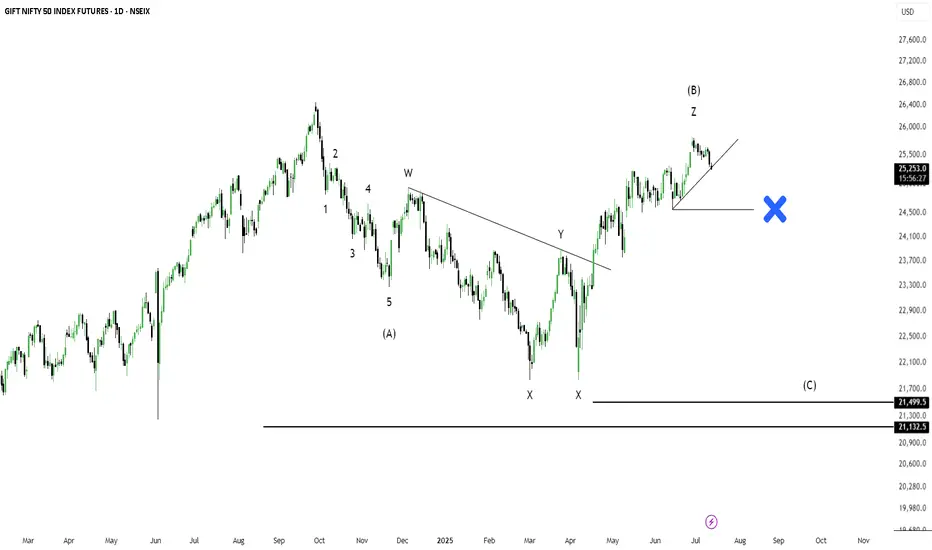
Primary Trend: Bullish (Wave 3 or 5 ongoing since 2023).
Current Phase: Likely final sub-wave (Wave 5) targeting ₹25,800–26,200.
Risk: Completion of Wave 5 may trigger a 10–15% correction (ABC pattern) toward ₹22,500–23,000 (38.2% Fib retracement).
Wyckoff & Volume:
Accumulation/Distribution: Monthly volume declining near highs → early distribution signals.
Key Level: Close below ₹24,800 confirms distribution phase (bearish reversal).
Gann Analysis (Price-Time Squaring):
Square of 9:
Key Resistance: ₹25,317 (√25,060 ≈ 158.3; 158.5² = 25,132 → 159² = 25,281).
Major Support: ₹24,649 (157.5²), ₹24,000 (psychological + Gann 45° angle).
Time Cycle:
Aug-Sep 2025 critical for reversal (90-day cycle from April 2025 high).
Ichimoku (Weekly):
Kumo Cloud: Price above cloud → bullish bias.
Lagging Span (Chikou): Above price (26 weeks back) → no congestion.
Warning: Tenkan (9) below Kijun (26) on weekly → momentum loss.
Moving Averages (Weekly):
Bullish Stacking: EMA(20) > EMA(50) > SMA(100) → trend intact.
Support: EMA(20) at ₹24,200
Medium-Term (Daily/4H) - SWING ENTRY
Candlestick Patterns:
Daily: Doji/Spinning Top near ₹25,060 → indecision.
4H: Bearish Shooting Star → resistance at ₹25,150–25,200.
Harmonic Patterns:
Bullish Bat potential (PRZ: ₹24,600–24,750).
Bearish Crab if price rejects ₹25,300 (PRZ: ₹25,280–25,350).
Gann Angles:
1x1 Angle Support (from June 2025 low): ₹24,900 (break → accelerates selling).
Price-Time Squaring:
24th July = 180° from Jan 2025 low → watch for volatility.
RSI + Bollinger Bands (Daily):
RSI(14): 68 (neutral-bearish divergence → weakening momentum).
BB(20,2): Price near upper band (₹25,200) → overbought.
VWAP (4H): Price above VWAP → intraday bullish, but divergence at highs.
Intraday (1H/30M/15M/5M)
Ichimoku (1H):
Tenkan (9) > Kijun (26): Bullish.
Kumo Twist: Support at ₹24,950 (cloud top).
Sell Signal: If price breaks below Kijun (₹25,010).
Moving Averages (30M):
EMA(20): ₹25,040 (intraday support).
Death Cross: EMA(20) < SMA(50) on 15M → short-term bearish.
RSI + BB (15M):
RSI(14): 72 → overbought.
BB Squeeze: Bands narrowing → expect breakout (bearish bias below VWAP).
Gann Intraday Levels (5M):
Resistance: ₹25,100 (1x1 angle), ₹25,180 (2x1).
Support: ₹24,980 (1x1 downside), ₹24,920 (2x1).
Synthesis & Trading Plan
Bullish Scenario (Swing):
Trigger: Hold above ₹24,900 (Gann 1x1) + RSI > 60 on weekly.
Target: ₹25,800–26,200 (Wave 5, Gann Square 159²).
Stop Loss: ₹24,650 (Harmonic Bat PRZ).
Bearish Reversal (Intraday/Swing):
Trigger: Close below ₹24,950 (Ichimoku cloud) + RSI < 50.
Target: ₹24,600 (Harmonic Bat), ₹24,000 (monthly SMA).
Stop Loss: ₹25,200 (Bollinger upper band).
Intraday Levels (23rd July):
Resistance Support
₹25,100 (1H VWAP) ₹25,000 (psych)
₹25,180 (Gann 2x1) ₹24,950 (Ichimoku)
₹25,280 (Sq9) ₹24,800 (daily pivot)
Key Risk Factors
Gann Time Cycle: 24–28 July = high volatility (price-time square).
Elliott Terminal Wave: Wave 5 exhaustion → strict stop losses.
VWAP Divergence: Failure to hold above VWAP on 4H → short.
Instrument: NIFTY50
Strategy:
Swing: Wait for daily close above ₹25,150 (confirms bullish) or below ₹24,800 (bearish).
Intraday: Sell rallies to ₹25,100–25,150 (RSI>70, BB squeeze) for ₹24,950.
Verified Tools:
Gann Square of 9 + Ichimoku for precision entries.
RSI/BB for overbought/oversold filters.
For those interested in further developing their trading skills based on these types of analyses, consider exploring the mentoring program offered by Shunya Trade.(world wide web shunya trade)
I welcome your feedback on this analysis, as it will inform and enhance my future work.
Regards,
Shunya Trade
world wide web shunya trade
⚠️ Disclaimer: This post is educational content and does not constitute investment advice, financial advice, or trading recommendations. The views expressed here are based on technical analysis and are shared solely for informational purposes. The stock market is subject to risks, including capital loss, and readers should exercise due diligence before investing. We do not take responsibility for decisions made based on this content. Consult a certified financial advisor for personalized guidance.
NIFTY 1. Rectangle Box (Sideways Zone)
Nifty had earlier made a strong range-bound consolidation around 24,400 -25,000.
This has now become a strong support zone (red shaded area).
2. Breakout & Retest Pattern:
Nifty then broke out of this zone and went to around 25,600.
Now it is retesting the same old resistance (now support).
3. Price Action Zones:
Support Zone: 24,950 25,100
Resistance Zone: 25,600 - 25,800
If you find this helpful and want more FREE forecasts in TradingView, Hit the 'BOOST' button
Drop some feedback in the comments below! (e.g., What did you find most useful?
How can we improve?)
Your support is appreciated!
Now, it's your turn!
Be sure to leave a comment; let us know how you see this opportunity and forecast.
Have a successful week
DISCLAIMER: I am NOT a SEBI registered advisor or a financial adviser. All the views are for educational purpose only

Nifty in Volatile Range#NIFTY FUT– 25,508.0
S1 – 25,395.0
S2 – 25,348.0
R1 – 25,658.0
R2 – 25,718.0
Doji formation has seen post Red
candle with inline volume,
indicates consolidation on daily
chart. Nifty has closed above 7, 14
and 21 DMA that seen at 25487,
25337 and 25222 levels. Nifty
future has resistance at 25658
levels while support seen at 25395
level..
More support and Resistance Show in chart...
All information Education Purpose only

Mount Fuji Series- Old runners waking upMount Fuji Series- Old runners waking up -
TARC - started running after 50-70 levels.. hope getting ready again.
Realty company with good land holding. Funda strong company.

28 june Nifty50 brekout and Breakdown leval ✅ Level 1: ₹26,018
Above 10-Min Candle Closing
🔹 Indicates a short covering zone
🔸 Strategy: Close all PE positions, shift to CE or book profits
Below 10-Min Candle
🔹 Hold PE positions (Safe Zone)
🔸 Suggests market facing resistance here
✅ Level 2: ₹25,830
Above 10-Min Candle
🔹 Entry-level for holding CE positions
🔸 Possible bullish breakout
Below 10-Min Candle
🔹 Hold PE – but this is a Risk Zone
🔸 Caution: Trend reversal may happen
✅ Level 3: ₹25,670
Above 10-Min Candle
🔹 Indicates positive market sentiment
🔸 Hold CE (Calls)
Below 10-Min Candle
🔹 Indicates negative trade view
🔸 Hold PE (Puts)
✅ Level 4: ₹25,578
Above Opening S1 Level (10-Min Candle)
🔹 CE buy/hold confirmation
Below Opening R1 Level (10-Min Candle)
🔹 PE hold confirmation
🔸 Market turning weak
✅ Level 5: ₹25,478
Above 10-Min Candle
🔹 Buy/Hold CE
Below 10-Min Candle
🔹 Buy/Hold PE
🔸 Important pivot level – directional bias confirmation
✅ Level 6: ₹25,290
Above 10-Min Candle
🔹 Safe Zone to hold CE
Below 10-Min Candle
🔹 Unwinding zone
🔸 Exit CE positions, reduce longs – possible sharp fall
📊 Live Market Reference
Current Market Price (CMP): ₹25,632.45
Below ₹25,670 = Negative Bias
Strategy: Until price crosses ₹25,670 and sustains for 10 min, avoid CE entries or keep trailing SL on PE.
🎯 Sample Option Strategy (Example):
If price is below ₹25,670:
✅ Buy PE (Put Option)
Strike: ATM or slightly ITM (e.g., 25,600 PE)
Stop-Loss: If price moves above ₹25,670
Target: ₹25,478 / ₹25,290
If price is above ₹25,670:
✅ Buy CE (Call Option)
Strike: ATM or slightly OTM (e.g., 25,700 CE)
Stop-Loss: If price breaks back below ₹25,670
Target: ₹25,830 / ₹26,018
📌 Important Notes:
This strategy is intraday based on 5-min chart levels.
Levels like ₹25,478 and ₹25,290 are key for risk management.

The Nifty Futures Intraday Trend analysis on June 30, 2025According to my analysis and time cycle study, a Gap Down opening is likely on Monday, June 30, 2025. However, the intraday trend appears bullish. Key support levels are at 25,707 and 25,635, while resistance is seen at 25,788 and 25,808. I consider 25,808 to be a strong resistance level—if breached, it may trigger further bullish momentum.
The magnitude of the gap remains uncertain. These levels reflect my personal analysis and are not guaranteed.
Trading in Futures and Options involves significant risk. Traders are strongly advised to conduct their own technical analysis before making trading decisions.

24 June nifty breakout & breakdown levels 🔺 Bullish (Call Option / CE) Strategy:
✅ Buy CE (Call Option) when:
Above 24,710 → Entry for bullish trade
"Above 10m hold CE by buy level"
Above 24,870 → Stronger confirmation
"Above Opening S1 10M Hold CE By level"
Above 25,020 → Positive trade view
"Above 10M hold positive trade view"
Above 25,130 → Safer CE entry zone
"Above 10M hold CE by entry level"
Above 25,233 → Closing shot level
"Above 10M Closing Shot cover level"
🔻 Bearish (Put Option / PE) Strategy:
✅ Buy PE (Put Option) when:
Below 24,710 → Entry for bearish trade
"Below 10m hold PE By level"
Below 24,870 → Bearish confirmation
"Below Opening R1 10M Hold PE By level"
Below 25,020 → Negative trade view
"Below 10M hold nigeative trade view"
Below 25,130 → Risky PE zone
"Below 10M hold PE By Risky Zone"
Below 25,233 → Safer PE Zone
"Below 10M hold PE By Safe Zone"

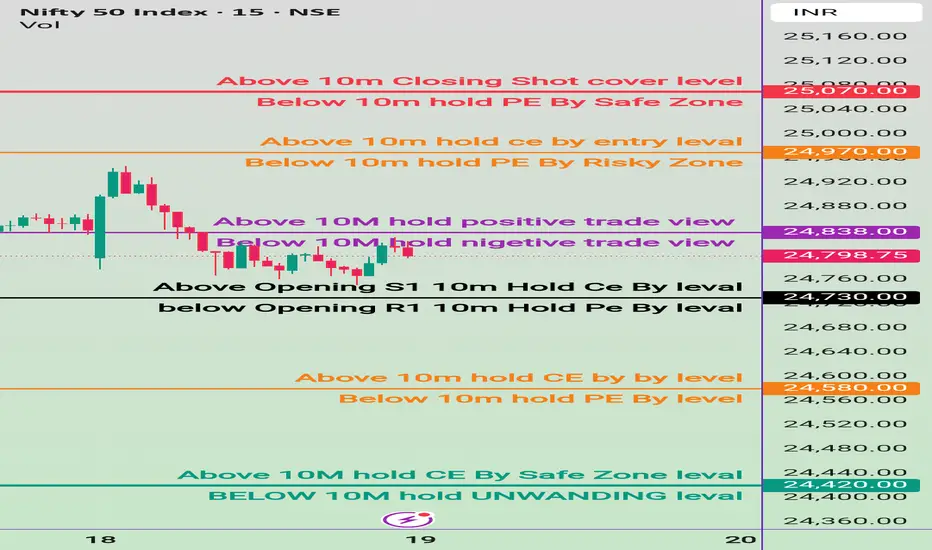
19 june Nifty50 brekout and Breakdown leval
✅ Safe Buy Zone (Support Levels):
24,437.70 → Above 10M: Hold CE by Safe Zone Level
24,420.00 → Below 10M: Hold Unwinding Level
→ Breach below could trigger unwinding / profit booking.
🔴 Resistance & Bearish PE Zones:
25,070.00 – Above 10m closing: Short Cover Level
→ Strong resistance; if crossed and sustained, short covering possible.
24,970.00 – Above 10m: Hold CE by Entry Level
→ Bullish entry confirmation level.
24,838.00 – Above 10M: Hold Positive Trade View
→ Indicates shift to bullish bias if held above.
⚫ Opening Based Levels:
24,730.00
→ Above Opening S1: Hold CE by Level
Below Opening R1 (level not clearly marked with value but appears near 24,730)
→ Hold PE by Level
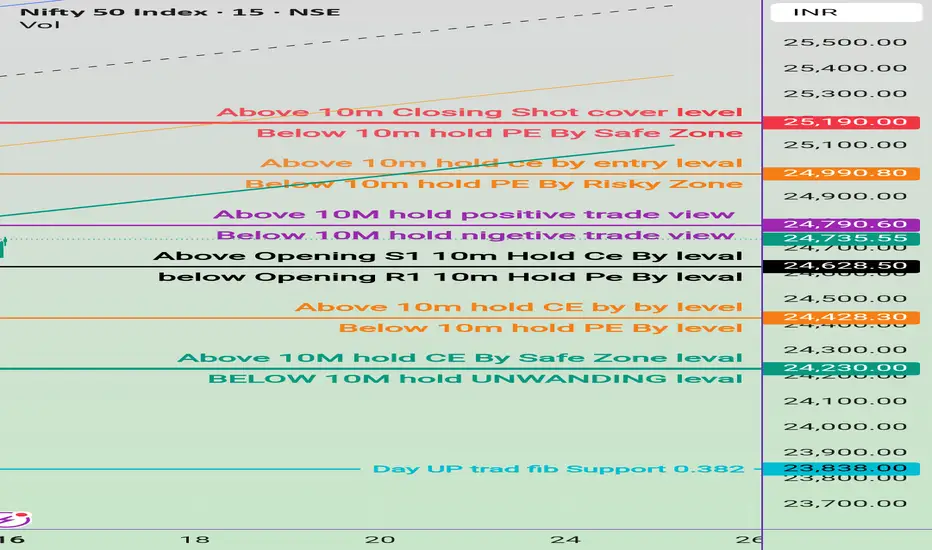
16 june Nifty50 brekout and Breakdown leval
🔺 Resistances / CE (Call) Holding Zones:
25,190.00 – 🔴 Above 10m Closing Shot Cover Level
24,990.80 – 🟠 Above 10m Hold CE by Entry Level
24,790.60 – 🟣 Above 10M Hold Positive Trade View
24,628.50 – ⚫ Above Opening S1 10m Hold CE by Level
24,428.30 – 🟠 Above 10m Hold CE by Level
24,230.00 – 🟢 Above 10M Hold CE by Safe Zone Level
🔻 Supports / PE (Put) Holding Zones:
Below 25,190.00 – Below 10m Hold PE by Safe Zone
Below 24,990.80 – Below 10m Hold PE by Risky Zone
Below 24,790.60 – Below 10M Hold Negative Trade View
Below 24,628.50 – Below Opening R1 10m Hold PE by Level
Below 24,428.30 – Below 10m Hold PE by Level
Below 24,230.00 – Below 10M Hold Unwinding Level
Nifty 12-JUNE-25 VIEW Everything is on chart for SWING view
AREA UP AREA LOW SPACE
AND MY VIEW FOR LONGTERM IS SAME

13june Nifty50 brekout and Breakdown leval✅ Bullish (Buy/Call - CE) Zones:
24628–Above 10m hold CE by zone
24788 –Above 10m hold CE by zone
24970 –Above 10m hold CE by zone
25170 –Above 10m hold CE by zone
25388 - Above 10m Closing: Shot Cover Possible
24488 -Above 10m hold CE By Safe Zone
Bearish (Buy/Put - PE) Zones:
25388 -Below 10m hold PE by zone
25170 –Below 10m hold PE by zone
24970 -Below 10m PE By Risky Zone
24628 -Below 10m Hold PE by Risky Zone
24488. BELOW UNWINDING POSSIBLE

